Cities with the Lowest Poverty Level Among Seniors Over the Age of 65 in South Dakota
RELATED REPORTS & OPTIONS
Lowest Poverty | Seniors 65+
South Dakota
Compare Cities
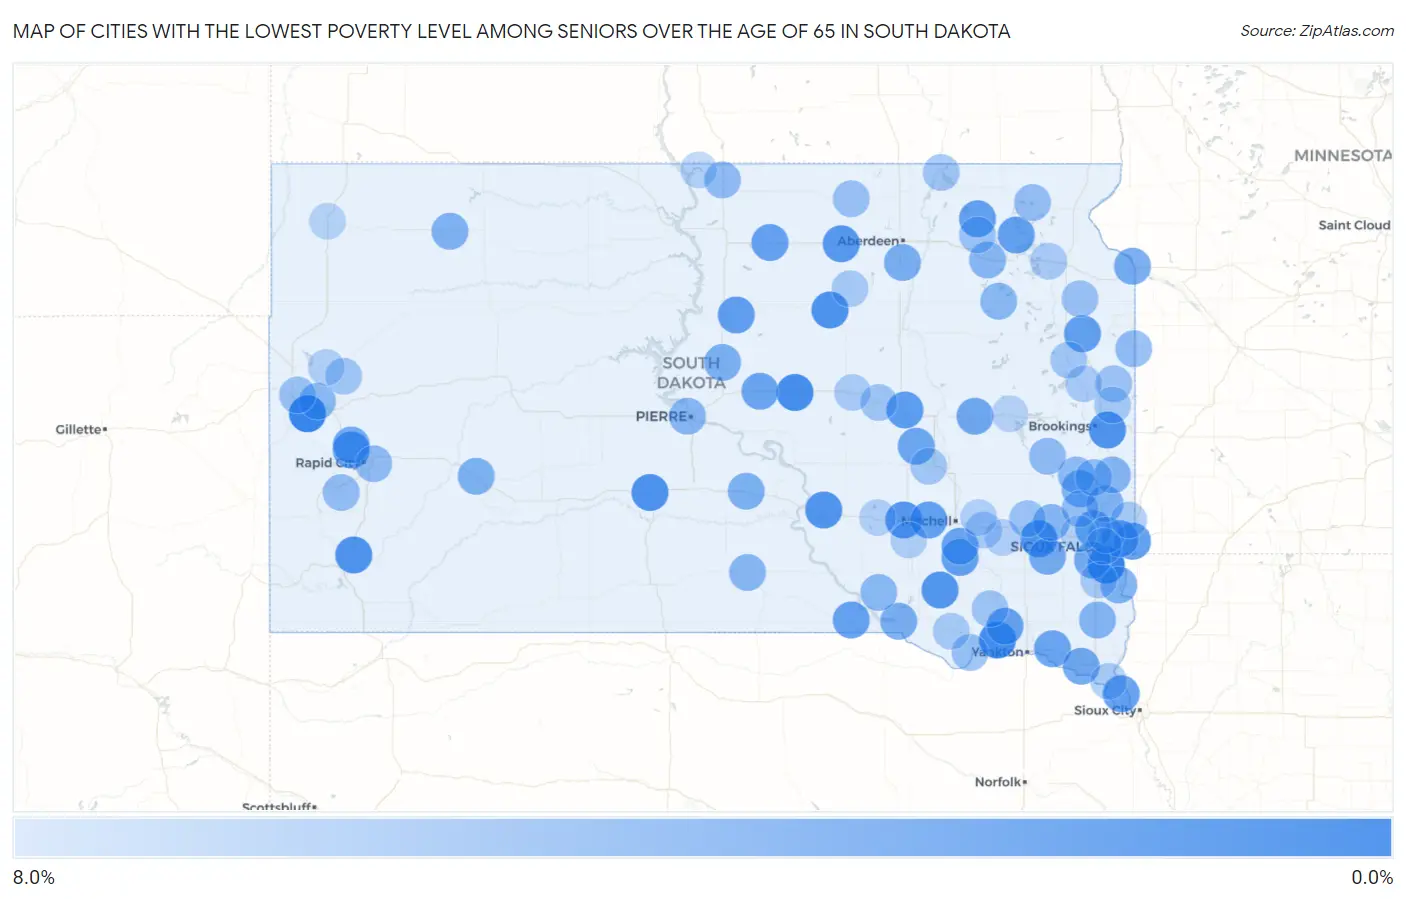
Map of Cities with the Lowest Poverty Level Among Seniors Over the Age of 65 in South Dakota
8.0%
0.0%
Cities with the Lowest Poverty Level Among Seniors Over the Age of 65 in South Dakota
| City | Senior Poverty | vs State | vs National | |
| 1. | Deadwood | 0.24% | 9.3%(-9.02)#1 | 10.0%(-9.71)#32 |
| 2. | Harrisburg | 0.38% | 9.3%(-8.89)#2 | 10.0%(-9.57)#54 |
| 3. | Tabor | 0.93% | 9.3%(-8.33)#3 | 10.0%(-9.02)#251 |
| 4. | Highmore | 1.2% | 9.3%(-8.11)#4 | 10.0%(-8.80)#378 |
| 5. | Faulkton | 1.5% | 9.3%(-7.78)#5 | 10.0%(-8.47)#636 |
| 6. | Murdo | 1.5% | 9.3%(-7.76)#6 | 10.0%(-8.45)#655 |
| 7. | Buffalo Gap | 1.6% | 9.3%(-7.65)#7 | 10.0%(-8.34)#747 |
| 8. | Aurora | 1.7% | 9.3%(-7.61)#8 | 10.0%(-8.30)#770 |
| 9. | Canistota | 1.7% | 9.3%(-7.57)#9 | 10.0%(-8.26)#805 |
| 10. | Pukwana | 1.8% | 9.3%(-7.51)#10 | 10.0%(-8.20)#870 |
| 11. | Delmont | 2.0% | 9.3%(-7.30)#11 | 10.0%(-7.99)#1,061 |
| 12. | Plankinton | 2.1% | 9.3%(-7.18)#12 | 10.0%(-7.87)#1,173 |
| 13. | Ipswich | 2.2% | 9.3%(-7.05)#13 | 10.0%(-7.74)#1,284 |
| 14. | Wolsey | 2.4% | 9.3%(-6.90)#14 | 10.0%(-7.59)#1,440 |
| 15. | Blackhawk | 2.4% | 9.3%(-6.82)#15 | 10.0%(-7.51)#1,544 |
| 16. | Valley Springs | 2.6% | 9.3%(-6.67)#16 | 10.0%(-7.35)#1,700 |
| 17. | Brandon | 2.6% | 9.3%(-6.65)#17 | 10.0%(-7.34)#1,716 |
| 18. | Gettysburg | 2.6% | 9.3%(-6.61)#18 | 10.0%(-7.30)#1,767 |
| 19. | Langford | 2.8% | 9.3%(-6.49)#19 | 10.0%(-7.17)#1,907 |
| 20. | Mount Vernon | 2.8% | 9.3%(-6.49)#20 | 10.0%(-7.17)#1,908 |
| 21. | Kranzburg | 2.8% | 9.3%(-6.49)#21 | 10.0%(-7.17)#1,914 |
| 22. | Roslyn | 2.8% | 9.3%(-6.49)#22 | 10.0%(-7.17)#1,915 |
| 23. | Jefferson | 2.8% | 9.3%(-6.46)#23 | 10.0%(-7.15)#1,934 |
| 24. | Dimock | 2.9% | 9.3%(-6.41)#24 | 10.0%(-7.09)#2,013 |
| 25. | Bowdle | 2.9% | 9.3%(-6.35)#25 | 10.0%(-7.04)#2,072 |
| 26. | Bonesteel | 2.9% | 9.3%(-6.32)#26 | 10.0%(-7.01)#2,110 |
| 27. | Lesterville | 2.9% | 9.3%(-6.32)#27 | 10.0%(-7.01)#2,117 |
| 28. | Ethan | 3.1% | 9.3%(-6.14)#28 | 10.0%(-6.83)#2,340 |
| 29. | Crooks | 3.3% | 9.3%(-6.00)#29 | 10.0%(-6.69)#2,518 |
| 30. | Gayville | 3.3% | 9.3%(-5.97)#30 | 10.0%(-6.65)#2,572 |
| 31. | Harrold | 3.3% | 9.3%(-5.93)#31 | 10.0%(-6.62)#2,645 |
| 32. | Alpena | 3.5% | 9.3%(-5.77)#32 | 10.0%(-6.46)#2,832 |
| 33. | Iroquois | 3.6% | 9.3%(-5.69)#33 | 10.0%(-6.38)#2,947 |
| 34. | Vermillion | 3.6% | 9.3%(-5.67)#34 | 10.0%(-6.36)#2,993 |
| 35. | Tea | 3.7% | 9.3%(-5.60)#35 | 10.0%(-6.29)#3,085 |
| 36. | Monroe | 3.8% | 9.3%(-5.42)#36 | 10.0%(-6.11)#3,338 |
| 37. | Big Stone City | 3.9% | 9.3%(-5.35)#37 | 10.0%(-6.04)#3,410 |
| 38. | Summerset | 4.0% | 9.3%(-5.30)#38 | 10.0%(-5.99)#3,484 |
| 39. | Pickstown | 4.2% | 9.3%(-5.10)#39 | 10.0%(-5.79)#3,790 |
| 40. | Warner | 4.3% | 9.3%(-5.01)#40 | 10.0%(-5.70)#3,893 |
| 41. | Onida | 4.3% | 9.3%(-4.92)#41 | 10.0%(-5.60)#4,036 |
| 42. | Brant Lake South | 4.4% | 9.3%(-4.87)#42 | 10.0%(-5.56)#4,125 |
| 43. | Wall | 4.4% | 9.3%(-4.86)#43 | 10.0%(-5.55)#4,132 |
| 44. | Canton | 4.4% | 9.3%(-4.86)#44 | 10.0%(-5.55)#4,137 |
| 45. | Mina | 4.4% | 9.3%(-4.85)#45 | 10.0%(-5.54)#4,147 |
| 46. | Kennebec | 4.4% | 9.3%(-4.85)#46 | 10.0%(-5.54)#4,155 |
| 47. | Dell Rapids | 4.5% | 9.3%(-4.72)#47 | 10.0%(-5.41)#4,332 |
| 48. | Bison | 4.6% | 9.3%(-4.68)#48 | 10.0%(-5.36)#4,423 |
| 49. | Beresford | 4.9% | 9.3%(-4.38)#49 | 10.0%(-5.07)#4,808 |
| 50. | Montrose | 4.9% | 9.3%(-4.34)#50 | 10.0%(-5.03)#4,880 |
| 51. | Egan | 5.0% | 9.3%(-4.26)#51 | 10.0%(-4.95)#5,001 |
| 52. | Bristol | 5.1% | 9.3%(-4.18)#52 | 10.0%(-4.87)#5,124 |
| 53. | Fort Pierre | 5.1% | 9.3%(-4.15)#53 | 10.0%(-4.84)#5,152 |
| 54. | Winner | 5.1% | 9.3%(-4.15)#54 | 10.0%(-4.84)#5,155 |
| 55. | Whitewood | 5.2% | 9.3%(-4.05)#55 | 10.0%(-4.74)#5,299 |
| 56. | Geddes | 5.3% | 9.3%(-4.00)#56 | 10.0%(-4.69)#5,407 |
| 57. | Bradley | 5.3% | 9.3%(-4.00)#57 | 10.0%(-4.69)#5,413 |
| 58. | Wentworth | 5.4% | 9.3%(-3.86)#58 | 10.0%(-4.55)#5,623 |
| 59. | Ramona | 5.5% | 9.3%(-3.81)#59 | 10.0%(-4.50)#5,698 |
| 60. | Rapid Valley | 5.6% | 9.3%(-3.65)#60 | 10.0%(-4.34)#5,978 |
| 61. | Gary | 5.6% | 9.3%(-3.64)#61 | 10.0%(-4.33)#5,990 |
| 62. | Herreid | 5.7% | 9.3%(-3.59)#62 | 10.0%(-4.28)#6,070 |
| 63. | Keystone | 5.8% | 9.3%(-3.49)#63 | 10.0%(-4.18)#6,228 |
| 64. | Colton | 5.8% | 9.3%(-3.42)#64 | 10.0%(-4.11)#6,334 |
| 65. | Clear Lake | 5.9% | 9.3%(-3.38)#65 | 10.0%(-4.07)#6,451 |
| 66. | Meadow View Addition | 5.9% | 9.3%(-3.33)#66 | 10.0%(-4.02)#6,505 |
| 67. | Colman | 6.0% | 9.3%(-3.26)#67 | 10.0%(-3.95)#6,614 |
| 68. | Springfield | 6.0% | 9.3%(-3.24)#68 | 10.0%(-3.93)#6,652 |
| 69. | Leola | 6.1% | 9.3%(-3.14)#69 | 10.0%(-3.83)#6,806 |
| 70. | South Shore | 6.1% | 9.3%(-3.14)#70 | 10.0%(-3.83)#6,813 |
| 71. | Spearfish | 6.2% | 9.3%(-3.02)#71 | 10.0%(-3.71)#6,978 |
| 72. | Toronto | 6.2% | 9.3%(-3.01)#72 | 10.0%(-3.70)#7,007 |
| 73. | Pierpont | 6.2% | 9.3%(-3.01)#73 | 10.0%(-3.70)#7,028 |
| 74. | Salem | 6.3% | 9.3%(-2.96)#74 | 10.0%(-3.65)#7,098 |
| 75. | Wessington | 6.5% | 9.3%(-2.81)#75 | 10.0%(-3.50)#7,302 |
| 76. | Hecla | 6.5% | 9.3%(-2.78)#76 | 10.0%(-3.47)#7,352 |
| 77. | Scotland | 6.5% | 9.3%(-2.72)#77 | 10.0%(-3.40)#7,438 |
| 78. | Castlewood | 6.6% | 9.3%(-2.66)#78 | 10.0%(-3.35)#7,509 |
| 79. | Vale | 6.7% | 9.3%(-2.60)#79 | 10.0%(-3.29)#7,645 |
| 80. | Woonsocket | 6.7% | 9.3%(-2.54)#80 | 10.0%(-3.23)#7,718 |
| 81. | White | 6.9% | 9.3%(-2.37)#81 | 10.0%(-3.06)#7,960 |
| 82. | Avon | 7.0% | 9.3%(-2.29)#82 | 10.0%(-2.97)#8,075 |
| 83. | Cresbard | 7.0% | 9.3%(-2.29)#83 | 10.0%(-2.97)#8,081 |
| 84. | Garretson | 7.0% | 9.3%(-2.28)#84 | 10.0%(-2.96)#8,095 |
| 85. | Worthing | 7.0% | 9.3%(-2.26)#85 | 10.0%(-2.95)#8,111 |
| 86. | Estelline | 7.1% | 9.3%(-2.12)#86 | 10.0%(-2.81)#8,299 |
| 87. | Alexandria | 7.1% | 9.3%(-2.12)#87 | 10.0%(-2.81)#8,303 |
| 88. | St Lawrence | 7.1% | 9.3%(-2.12)#88 | 10.0%(-2.81)#8,338 |
| 89. | Ortley | 7.1% | 9.3%(-2.12)#89 | 10.0%(-2.81)#8,357 |
| 90. | Elk Point | 7.2% | 9.3%(-2.05)#90 | 10.0%(-2.74)#8,421 |
| 91. | Stickney | 7.4% | 9.3%(-1.86)#91 | 10.0%(-2.54)#8,679 |
| 92. | Nisland | 7.5% | 9.3%(-1.74)#92 | 10.0%(-2.42)#8,847 |
| 93. | Emery | 7.7% | 9.3%(-1.57)#93 | 10.0%(-2.26)#9,079 |
| 94. | White Lake | 7.7% | 9.3%(-1.57)#94 | 10.0%(-2.26)#9,085 |
| 95. | Pollock | 7.7% | 9.3%(-1.57)#95 | 10.0%(-2.26)#9,102 |
| 96. | Fulton | 7.7% | 9.3%(-1.57)#96 | 10.0%(-2.26)#9,127 |
| 97. | Hartford | 7.8% | 9.3%(-1.50)#97 | 10.0%(-2.19)#9,210 |
| 98. | Buffalo | 7.8% | 9.3%(-1.45)#98 | 10.0%(-2.14)#9,282 |
| 99. | Sioux Falls | 7.9% | 9.3%(-1.37)#99 | 10.0%(-2.06)#9,382 |
| 100. | De Smet | 7.9% | 9.3%(-1.34)#100 | 10.0%(-2.03)#9,431 |
Common Questions
What are the Top 10 Cities with the Lowest Poverty Level Among Seniors Over the Age of 65 in South Dakota?
Top 10 Cities with the Lowest Poverty Level Among Seniors Over the Age of 65 in South Dakota are:
#1
0.24%
#2
0.38%
#3
0.93%
#4
1.2%
#5
1.5%
#6
1.5%
#7
1.6%
#8
1.7%
#9
1.7%
#10
1.8%
What city has the Lowest Poverty Level Among Seniors Over the Age of 65 in South Dakota?
Deadwood has the Lowest Poverty Level Among Seniors Over the Age of 65 in South Dakota with 0.24%.
What is the Poverty Level Among Seniors Over the Age of 65 in the State of South Dakota?
Poverty Level Among Seniors Over the Age of 65 in South Dakota is 9.3%.
What is the Poverty Level Among Seniors Over the Age of 65 in the United States?
Poverty Level Among Seniors Over the Age of 65 in the United States is 10.0%.