Mather, CA Map & Demographics
Mather Map
Mather Overview
$45,190
PER CAPITA INCOME
$137,474
AVG FAMILY INCOME
$135,329
AVG HOUSEHOLD INCOME
45.2%
WAGE / INCOME GAP [ % ]
54.8¢/ $1
WAGE / INCOME GAP [ $ ]
0.34
INEQUALITY / GINI INDEX
4,712
TOTAL POPULATION
2,145
MALE POPULATION
2,567
FEMALE POPULATION
83.56
MALES / 100 FEMALES
119.67
FEMALES / 100 MALES
33.4
MEDIAN AGE
3.4
AVG FAMILY SIZE
3.1
AVG HOUSEHOLD SIZE
2,422
LABOR FORCE [ PEOPLE ]
70.1%
PERCENT IN LABOR FORCE
1.3%
UNEMPLOYMENT RATE
Mather Zip Codes
Income in Mather
Income Overview in Mather
Per Capita Income in Mather is $45,190, while median incomes of families and households are $137,474 and $135,329 respectively.
| Characteristic | Number | Measure |
| Per Capita Income | 4,712 | $45,190 |
| Median Family Income | 1,234 | $137,474 |
| Mean Family Income | 1,234 | $152,211 |
| Median Household Income | 1,517 | $135,329 |
| Mean Household Income | 1,517 | $140,637 |
| Income Deficit | 1,234 | $0 |
| Wage / Income Gap (%) | 4,712 | 45.17% |
| Wage / Income Gap ($) | 4,712 | 54.83¢ per $1 |
| Gini / Inequality Index | 4,712 | 0.34 |
Earnings by Sex in Mather
Average Earnings in Mather are $72,115, $85,688 for men and $46,984 for women, a difference of 45.2%.
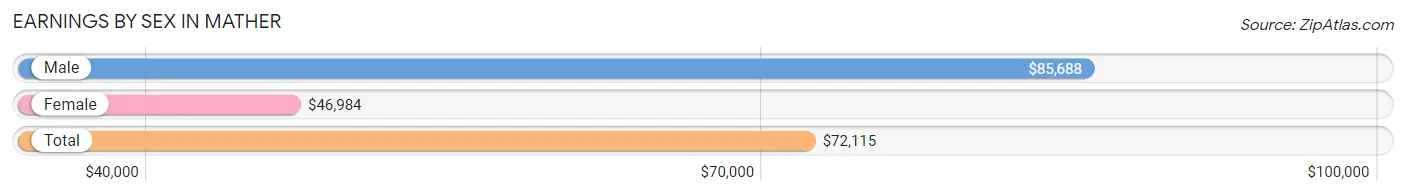
| Sex | Number | Average Earnings |
| Male | 1,287 (51.8%) | $85,688 |
| Female | 1,199 (48.2%) | $46,984 |
| Total | 2,486 (100.0%) | $72,115 |
Earnings by Sex by Income Bracket in Mather
The most common earnings brackets in Mather are $100,000+ for men (480 | 37.3%) and $75,000 to $99,999 for women (254 | 21.2%).
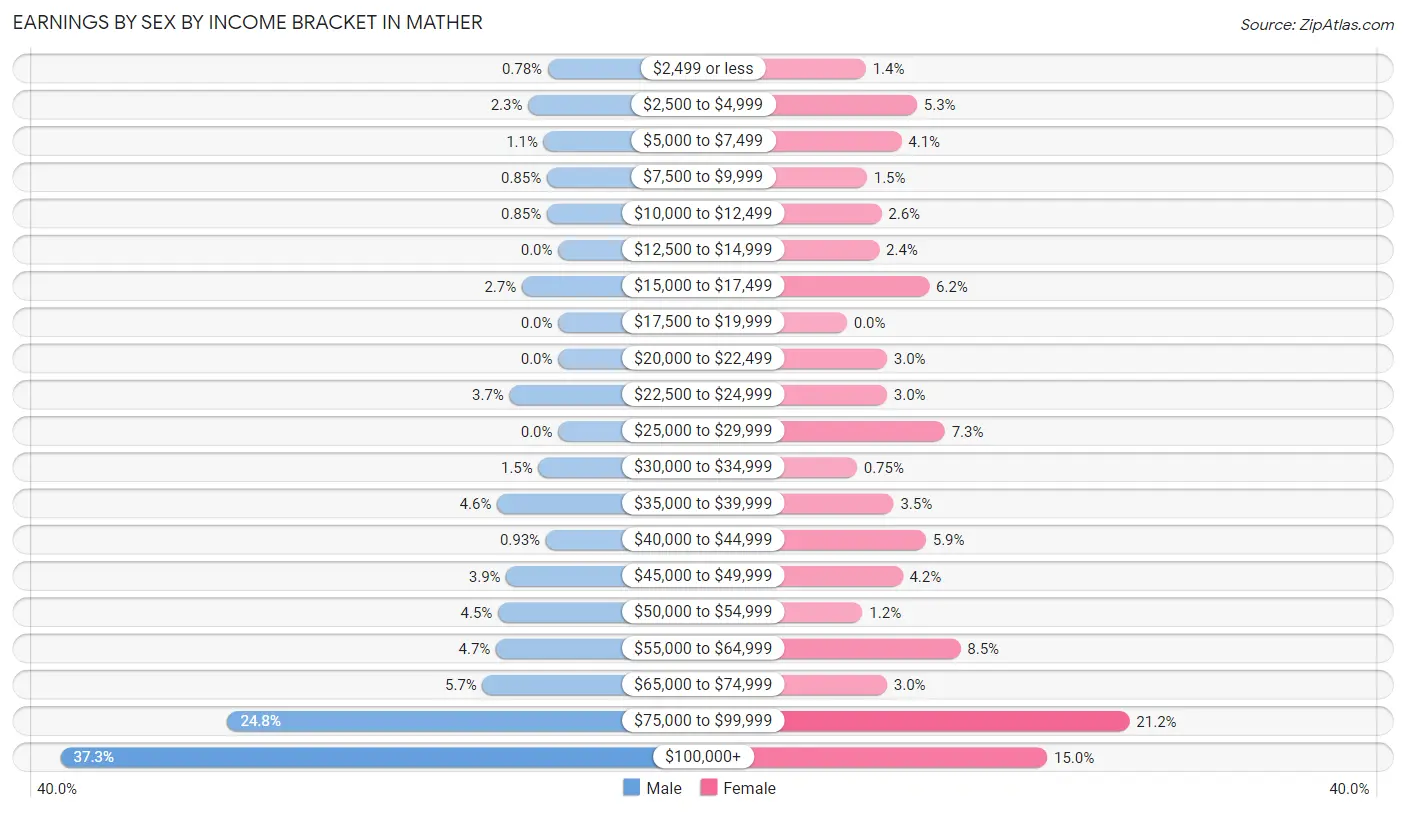
| Income | Male | Female |
| $2,499 or less | 10 (0.8%) | 17 (1.4%) |
| $2,500 to $4,999 | 29 (2.2%) | 63 (5.2%) |
| $5,000 to $7,499 | 14 (1.1%) | 49 (4.1%) |
| $7,500 to $9,999 | 11 (0.9%) | 18 (1.5%) |
| $10,000 to $12,499 | 11 (0.9%) | 31 (2.6%) |
| $12,500 to $14,999 | 0 (0.0%) | 29 (2.4%) |
| $15,000 to $17,499 | 35 (2.7%) | 74 (6.2%) |
| $17,500 to $19,999 | 0 (0.0%) | 0 (0.0%) |
| $20,000 to $22,499 | 0 (0.0%) | 36 (3.0%) |
| $22,500 to $24,999 | 47 (3.6%) | 36 (3.0%) |
| $25,000 to $29,999 | 0 (0.0%) | 88 (7.3%) |
| $30,000 to $34,999 | 19 (1.5%) | 9 (0.7%) |
| $35,000 to $39,999 | 59 (4.6%) | 42 (3.5%) |
| $40,000 to $44,999 | 12 (0.9%) | 71 (5.9%) |
| $45,000 to $49,999 | 50 (3.9%) | 50 (4.2%) |
| $50,000 to $54,999 | 58 (4.5%) | 14 (1.2%) |
| $55,000 to $64,999 | 60 (4.7%) | 102 (8.5%) |
| $65,000 to $74,999 | 73 (5.7%) | 36 (3.0%) |
| $75,000 to $99,999 | 319 (24.8%) | 254 (21.2%) |
| $100,000+ | 480 (37.3%) | 180 (15.0%) |
| Total | 1,287 (100.0%) | 1,199 (100.0%) |
Earnings by Sex by Educational Attainment in Mather
Average earnings in Mather are $90,848 for men and $63,673 for women, a difference of 29.9%. Men with an educational attainment of graduate degree enjoy the highest average annual earnings of $101,905, while those with high school diploma education earn the least with $75,189. Women with an educational attainment of graduate degree earn the most with the average annual earnings of $98,611, while those with college or associate's degree education have the smallest earnings of $43,382.
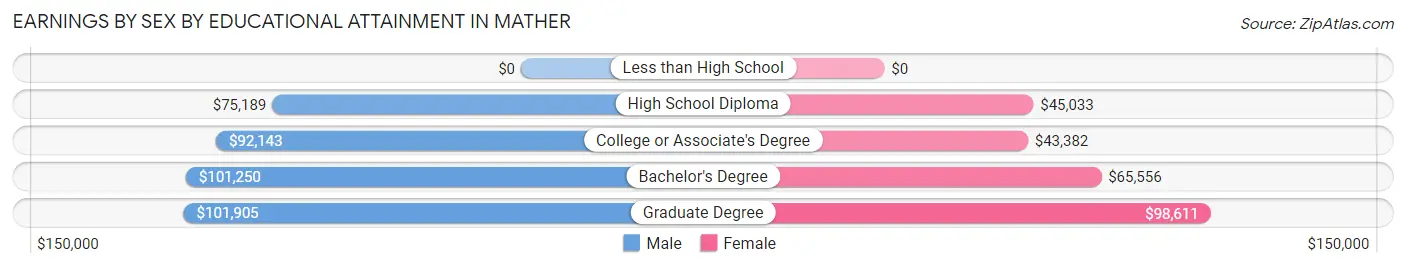
| Educational Attainment | Male Income | Female Income |
| Less than High School | - | - |
| High School Diploma | $75,189 | $45,033 |
| College or Associate's Degree | $92,143 | $43,382 |
| Bachelor's Degree | $101,250 | $65,556 |
| Graduate Degree | $101,905 | $98,611 |
| Total | $90,848 | $63,673 |
Family Income in Mather
Family Income Brackets in Mather
According to the Mather family income data, there are 380 families falling into the $100,000 to $149,999 income range, which is the most common income bracket and makes up 30.8% of all families.
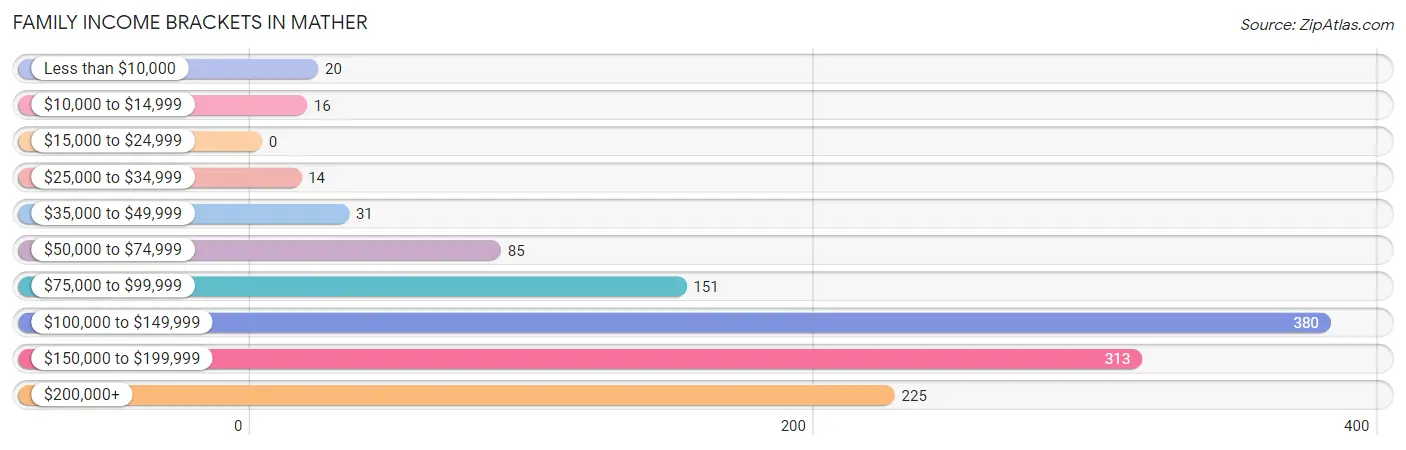
| Income Bracket | # Families | % Families |
| Less than $10,000 | 20 | 1.6% |
| $10,000 to $14,999 | 16 | 1.3% |
| $15,000 to $24,999 | 0 | 0.0% |
| $25,000 to $34,999 | 14 | 1.1% |
| $35,000 to $49,999 | 31 | 2.5% |
| $50,000 to $74,999 | 85 | 6.9% |
| $75,000 to $99,999 | 151 | 12.2% |
| $100,000 to $149,999 | 380 | 30.8% |
| $150,000 to $199,999 | 313 | 25.4% |
| $200,000+ | 225 | 18.2% |
Family Income by Famaliy Size in Mather
5-person families (79 | 6.4%) account for the highest median family income in Mather with $203,542 per family, while 2-person families (383 | 31.0%) have the highest median income of $59,236 per family member.
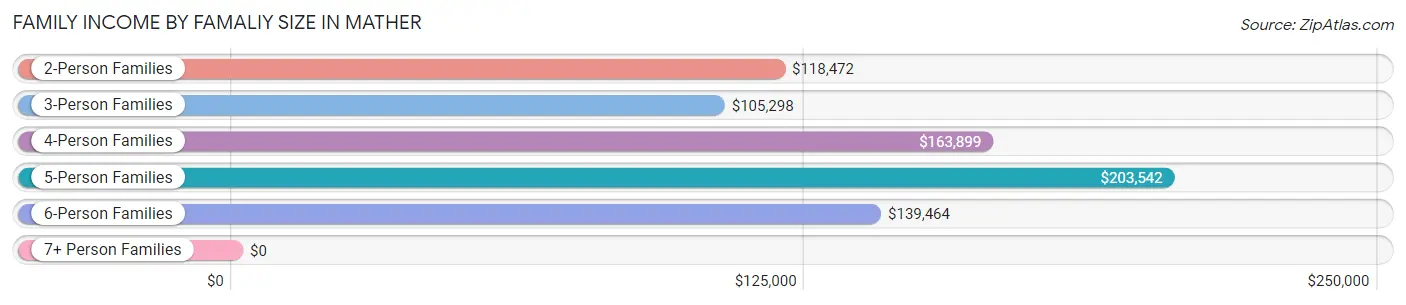
| Income Bracket | # Families | Median Income |
| 2-Person Families | 383 (31.0%) | $118,472 |
| 3-Person Families | 273 (22.1%) | $105,298 |
| 4-Person Families | 385 (31.2%) | $163,899 |
| 5-Person Families | 79 (6.4%) | $203,542 |
| 6-Person Families | 61 (4.9%) | $139,464 |
| 7+ Person Families | 53 (4.3%) | $0 |
| Total | 1,234 (100.0%) | $137,474 |
Family Income by Number of Earners in Mather
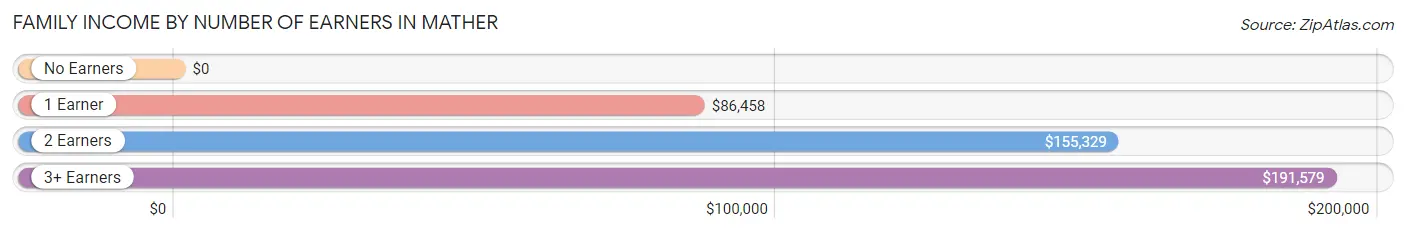
| Number of Earners | # Families | Median Income |
| No Earners | 52 (4.2%) | $0 |
| 1 Earner | 330 (26.7%) | $86,458 |
| 2 Earners | 700 (56.7%) | $155,329 |
| 3+ Earners | 152 (12.3%) | $191,579 |
| Total | 1,234 (100.0%) | $137,474 |
Household Income in Mather
Household Income Brackets in Mather
With 417 households falling in the category, the $100,000 to $149,999 income range is the most frequent in Mather, accounting for 27.5% of all households. In contrast, only 11 households (0.7%) fall into the $15,000 to $24,999 income bracket, making it the least populous group.
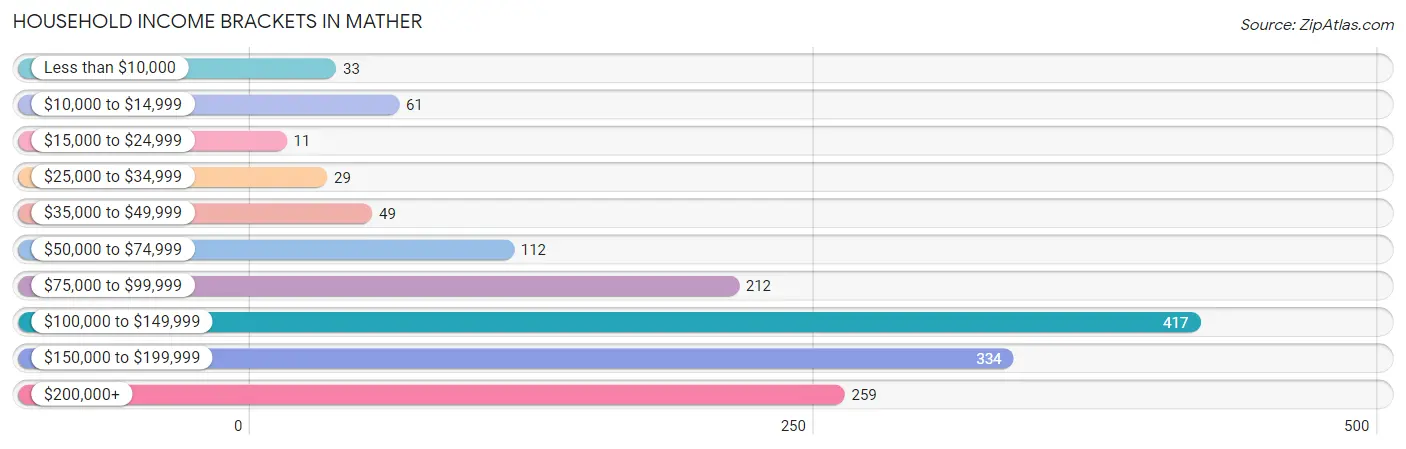
| Income Bracket | # Households | % Households |
| Less than $10,000 | 33 | 2.2% |
| $10,000 to $14,999 | 61 | 4.0% |
| $15,000 to $24,999 | 11 | 0.7% |
| $25,000 to $34,999 | 29 | 1.9% |
| $35,000 to $49,999 | 49 | 3.2% |
| $50,000 to $74,999 | 112 | 7.4% |
| $75,000 to $99,999 | 212 | 14.0% |
| $100,000 to $149,999 | 417 | 27.5% |
| $150,000 to $199,999 | 334 | 22.0% |
| $200,000+ | 259 | 17.1% |
Household Income by Householder Age in Mather
The median household income in Mather is $135,329, with the highest median household income of $141,979 found in the 45 to 64 years age bracket for the primary householder. A total of 589 households (38.8%) fall into this category. Meanwhile, the 15 to 24 years age bracket for the primary householder has the lowest median household income of $0, with 37 households (2.4%) in this group.
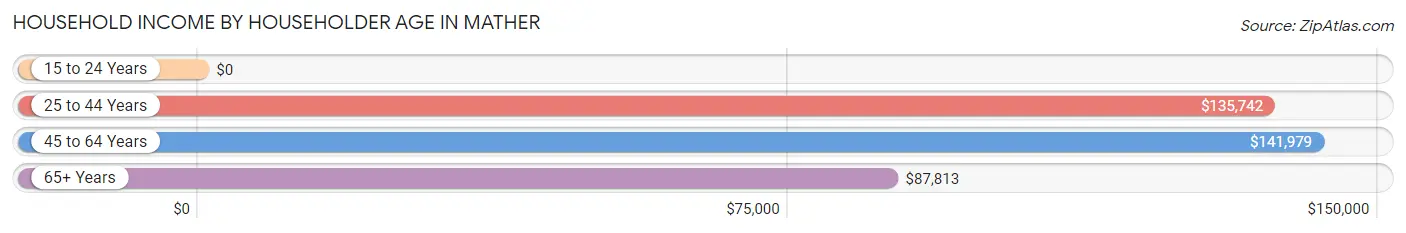
| Income Bracket | # Households | Median Income |
| 15 to 24 Years | 37 (2.4%) | $0 |
| 25 to 44 Years | 696 (45.9%) | $135,742 |
| 45 to 64 Years | 589 (38.8%) | $141,979 |
| 65+ Years | 195 (12.9%) | $87,813 |
| Total | 1,517 (100.0%) | $135,329 |
Poverty in Mather
Income Below Poverty by Sex and Age in Mather
With 3.1% poverty level for males and 6.7% for females among the residents of Mather, under 5 year old males and 18 to 24 year old females are the most vulnerable to poverty, with 13 males (30.2%) and 48 females (23.0%) in their respective age groups living below the poverty level.
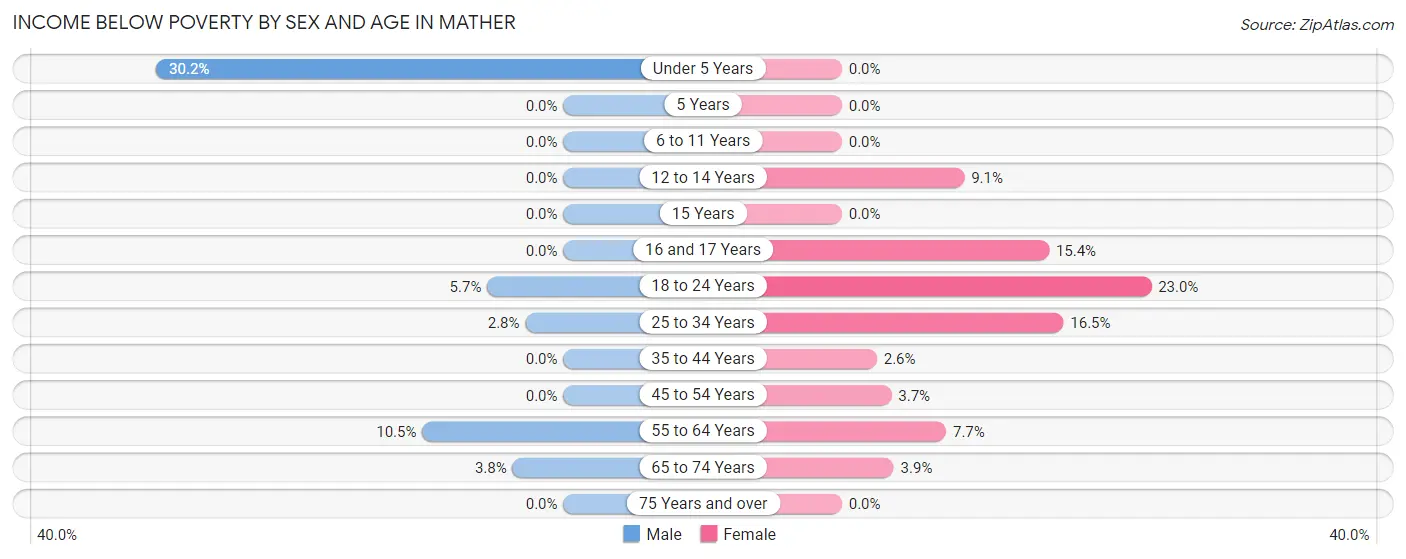
| Age Bracket | Male | Female |
| Under 5 Years | 13 (30.2%) | 0 (0.0%) |
| 5 Years | 0 (0.0%) | 0 (0.0%) |
| 6 to 11 Years | 0 (0.0%) | 0 (0.0%) |
| 12 to 14 Years | 0 (0.0%) | 10 (9.1%) |
| 15 Years | 0 (0.0%) | 0 (0.0%) |
| 16 and 17 Years | 0 (0.0%) | 10 (15.4%) |
| 18 to 24 Years | 10 (5.7%) | 48 (23.0%) |
| 25 to 34 Years | 10 (2.8%) | 63 (16.5%) |
| 35 to 44 Years | 0 (0.0%) | 9 (2.6%) |
| 45 to 54 Years | 0 (0.0%) | 12 (3.7%) |
| 55 to 64 Years | 27 (10.5%) | 12 (7.7%) |
| 65 to 74 Years | 6 (3.8%) | 8 (3.8%) |
| 75 Years and over | 0 (0.0%) | 0 (0.0%) |
| Total | 66 (3.1%) | 172 (6.7%) |
Income Above Poverty by Sex and Age in Mather
According to the poverty statistics in Mather, males aged 5 years and females aged under 5 years are the age groups that are most secure financially, with 100.0% of males and 100.0% of females in these age groups living above the poverty line.
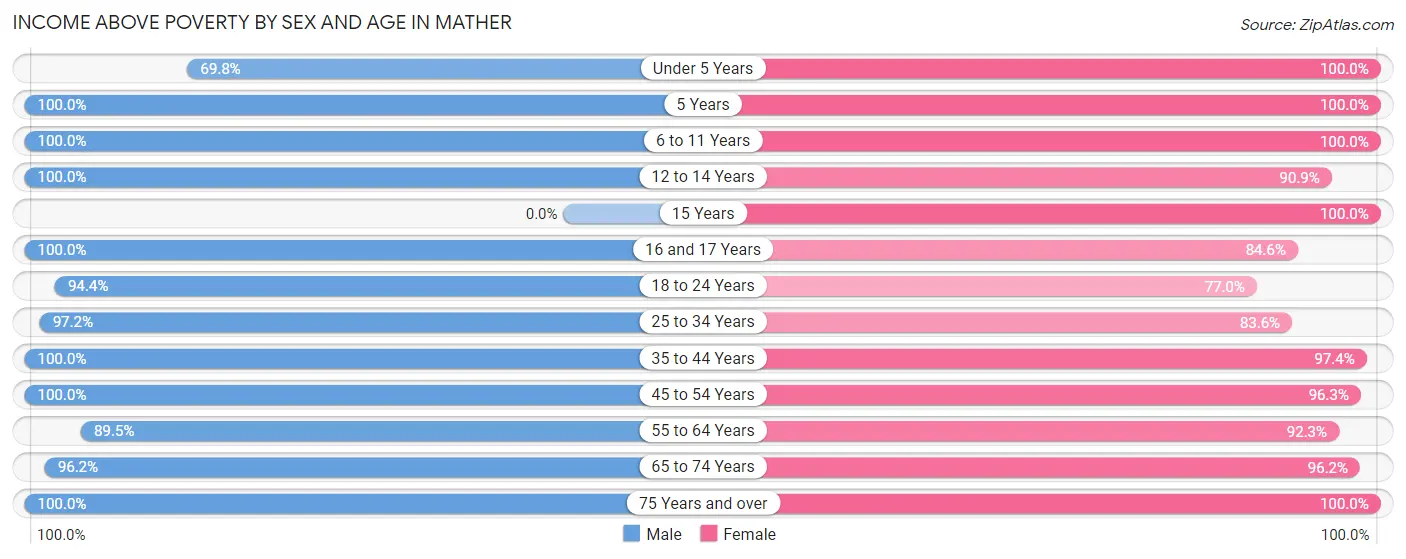
| Age Bracket | Male | Female |
| Under 5 Years | 30 (69.8%) | 290 (100.0%) |
| 5 Years | 38 (100.0%) | 28 (100.0%) |
| 6 to 11 Years | 243 (100.0%) | 327 (100.0%) |
| 12 to 14 Years | 127 (100.0%) | 100 (90.9%) |
| 15 Years | 0 (0.0%) | 51 (100.0%) |
| 16 and 17 Years | 98 (100.0%) | 55 (84.6%) |
| 18 to 24 Years | 167 (94.4%) | 161 (77.0%) |
| 25 to 34 Years | 345 (97.2%) | 320 (83.6%) |
| 35 to 44 Years | 330 (100.0%) | 337 (97.4%) |
| 45 to 54 Years | 269 (100.0%) | 314 (96.3%) |
| 55 to 64 Years | 231 (89.5%) | 143 (92.3%) |
| 65 to 74 Years | 153 (96.2%) | 200 (96.2%) |
| 75 Years and over | 48 (100.0%) | 69 (100.0%) |
| Total | 2,079 (96.9%) | 2,395 (93.3%) |
Income Below Poverty Among Married-Couple Families in Mather
The poverty statistics for married-couple families in Mather show that 1.2% or 12 of the total 1,033 families live below the poverty line. Families with no children have the highest poverty rate of 3.1%, comprising of 12 families. On the other hand, families with 1 or 2 children have the lowest poverty rate of 0.0%, which includes 0 families.
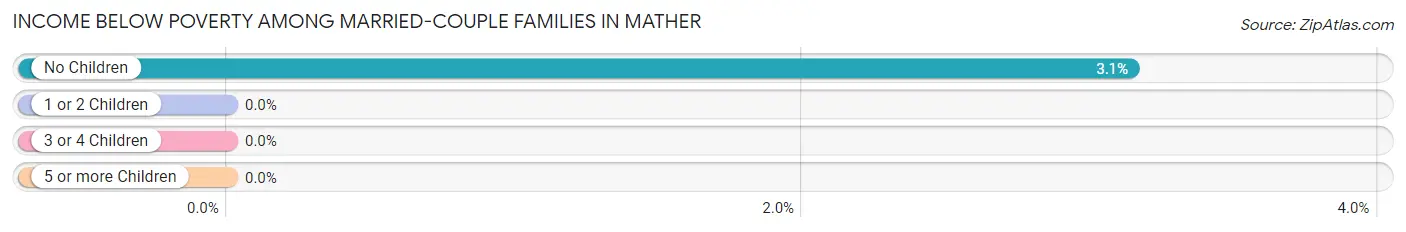
| Children | Above Poverty | Below Poverty |
| No Children | 370 (96.9%) | 12 (3.1%) |
| 1 or 2 Children | 535 (100.0%) | 0 (0.0%) |
| 3 or 4 Children | 84 (100.0%) | 0 (0.0%) |
| 5 or more Children | 32 (100.0%) | 0 (0.0%) |
| Total | 1,021 (98.8%) | 12 (1.2%) |
Income Below Poverty Among Single-Parent Households in Mather
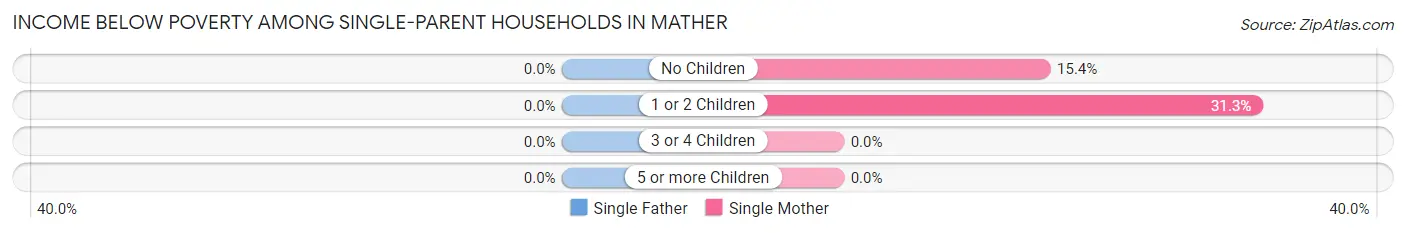
| Children | Single Father | Single Mother |
| No Children | 0 (0.0%) | 4 (15.4%) |
| 1 or 2 Children | 0 (0.0%) | 20 (31.2%) |
| 3 or 4 Children | 0 (0.0%) | 0 (0.0%) |
| 5 or more Children | 0 (0.0%) | 0 (0.0%) |
| Total | 0 (0.0%) | 24 (26.7%) |
Income Below Poverty Among Married-Couple vs Single-Parent Households in Mather
The poverty data for Mather shows that 12 of the married-couple family households (1.2%) and 24 of the single-parent households (11.9%) are living below the poverty level. Within the married-couple family households, those with no children have the highest poverty rate, with 12 households (3.1%) falling below the poverty line. Among the single-parent households, those with 1 or 2 children have the highest poverty rate, with 20 household (19.2%) living below poverty.
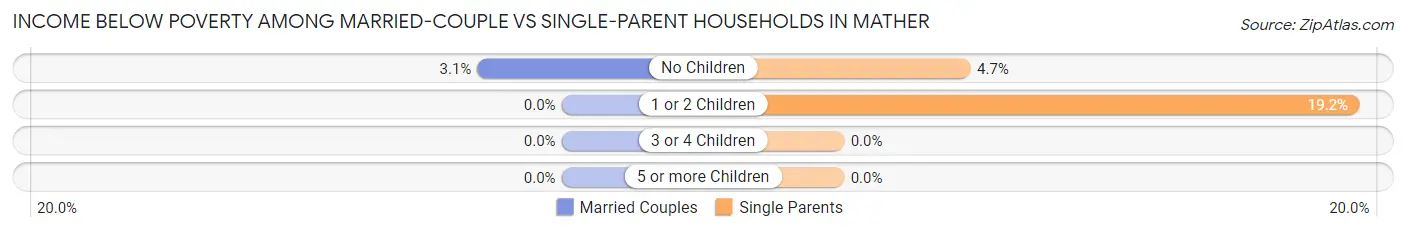
| Children | Married-Couple Families | Single-Parent Households |
| No Children | 12 (3.1%) | 4 (4.7%) |
| 1 or 2 Children | 0 (0.0%) | 20 (19.2%) |
| 3 or 4 Children | 0 (0.0%) | 0 (0.0%) |
| 5 or more Children | 0 (0.0%) | 0 (0.0%) |
| Total | 12 (1.2%) | 24 (11.9%) |
Race in Mather
The most populous races in Mather are White / Caucasian (2,816 | 59.8%), Hispanic or Latino (862 | 18.3%), and Two or more Races (679 | 14.4%).
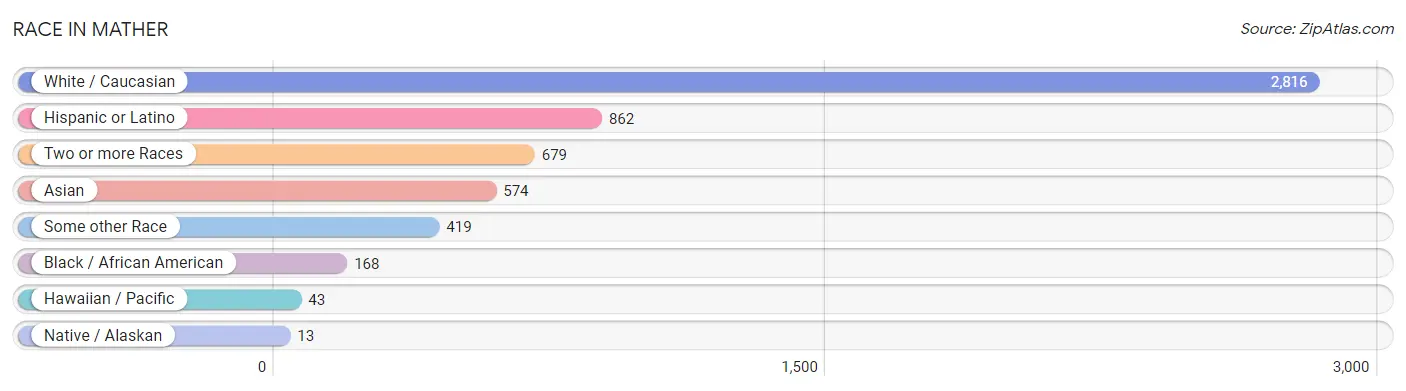
| Race | # Population | % Population |
| Asian | 574 | 12.2% |
| Black / African American | 168 | 3.6% |
| Hawaiian / Pacific | 43 | 0.9% |
| Hispanic or Latino | 862 | 18.3% |
| Native / Alaskan | 13 | 0.3% |
| White / Caucasian | 2,816 | 59.8% |
| Two or more Races | 679 | 14.4% |
| Some other Race | 419 | 8.9% |
| Total | 4,712 | 100.0% |
Ancestry in Mather
The most populous ancestries reported in Mather are German (959 | 20.3%), Mexican (721 | 15.3%), English (478 | 10.1%), Irish (282 | 6.0%), and Indian (Asian) (259 | 5.5%), together accounting for 57.3% of all Mather residents.
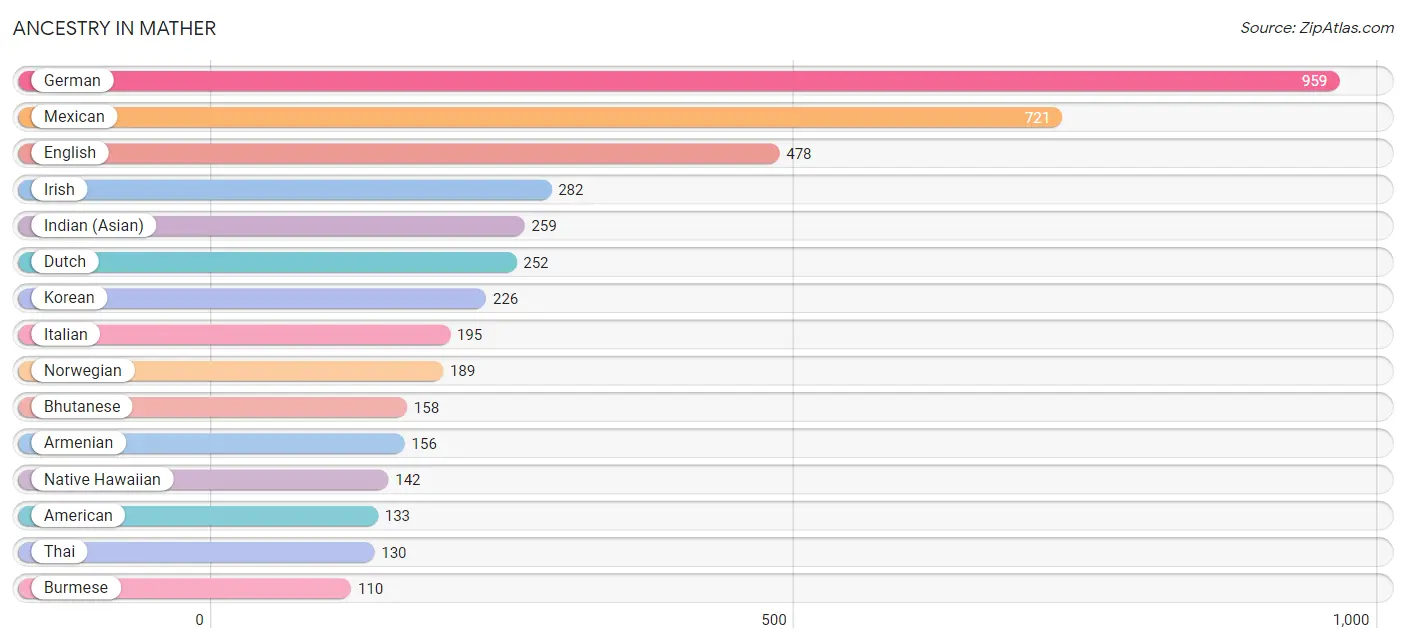
| Ancestry | # Population | % Population |
| American | 133 | 2.8% |
| Armenian | 156 | 3.3% |
| Austrian | 7 | 0.2% |
| Bangladeshi | 44 | 0.9% |
| Belgian | 21 | 0.4% |
| Bhutanese | 158 | 3.4% |
| British | 44 | 0.9% |
| Burmese | 110 | 2.3% |
| Central American | 31 | 0.7% |
| Chippewa | 3 | 0.1% |
| Croatian | 5 | 0.1% |
| Dutch | 252 | 5.3% |
| Eastern European | 8 | 0.2% |
| English | 478 | 10.1% |
| European | 22 | 0.5% |
| Filipino | 9 | 0.2% |
| Finnish | 8 | 0.2% |
| French | 92 | 1.9% |
| French Canadian | 42 | 0.9% |
| German | 959 | 20.3% |
| Hungarian | 11 | 0.2% |
| Indian (Asian) | 259 | 5.5% |
| Irish | 282 | 6.0% |
| Italian | 195 | 4.1% |
| Korean | 226 | 4.8% |
| Malaysian | 72 | 1.5% |
| Mexican | 721 | 15.3% |
| Native Hawaiian | 142 | 3.0% |
| Norwegian | 189 | 4.0% |
| Peruvian | 52 | 1.1% |
| Polish | 42 | 0.9% |
| Portuguese | 13 | 0.3% |
| Puerto Rican | 13 | 0.3% |
| Russian | 20 | 0.4% |
| Salvadoran | 31 | 0.7% |
| Samoan | 28 | 0.6% |
| Scandinavian | 65 | 1.4% |
| Scotch-Irish | 10 | 0.2% |
| Scottish | 99 | 2.1% |
| South American | 52 | 1.1% |
| Spanish | 45 | 1.0% |
| Sri Lankan | 31 | 0.7% |
| Swedish | 19 | 0.4% |
| Swiss | 14 | 0.3% |
| Thai | 130 | 2.8% |
| Tongan | 28 | 0.6% |
| Ukrainian | 70 | 1.5% |
| Welsh | 24 | 0.5% | View All 48 Rows |
Immigrants in Mather
The most numerous immigrant groups reported in Mather came from Asia (407 | 8.6%), Latin America (190 | 4.0%), Central America (181 | 3.8%), Mexico (150 | 3.2%), and China (137 | 2.9%), together accounting for 22.6% of all Mather residents.
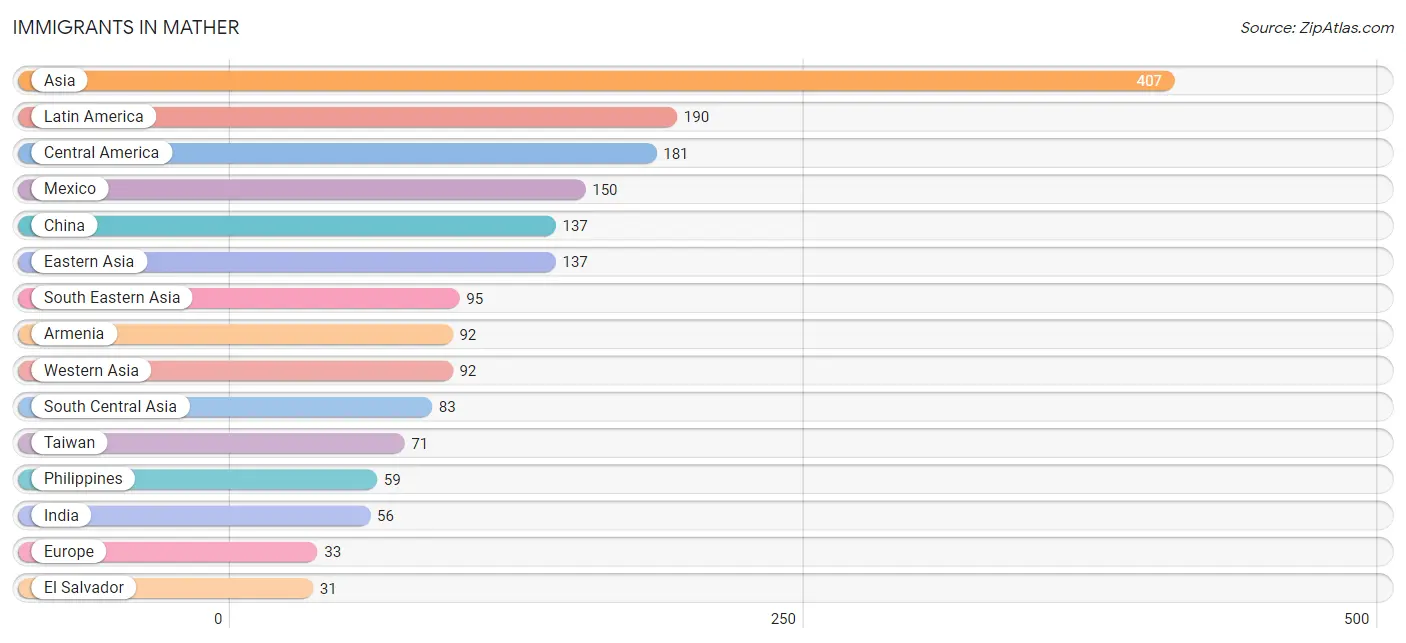
| Immigration Origin | # Population | % Population |
| Armenia | 92 | 1.9% |
| Asia | 407 | 8.6% |
| Canada | 6 | 0.1% |
| Central America | 181 | 3.8% |
| China | 137 | 2.9% |
| Eastern Asia | 137 | 2.9% |
| Eastern Europe | 22 | 0.5% |
| El Salvador | 31 | 0.7% |
| England | 11 | 0.2% |
| Europe | 33 | 0.7% |
| Fiji | 28 | 0.6% |
| India | 56 | 1.2% |
| Latin America | 190 | 4.0% |
| Latvia | 7 | 0.2% |
| Malaysia | 15 | 0.3% |
| Mexico | 150 | 3.2% |
| Northern Europe | 11 | 0.2% |
| Oceania | 28 | 0.6% |
| Pakistan | 27 | 0.6% |
| Peru | 9 | 0.2% |
| Philippines | 59 | 1.3% |
| South America | 9 | 0.2% |
| South Central Asia | 83 | 1.8% |
| South Eastern Asia | 95 | 2.0% |
| Taiwan | 71 | 1.5% |
| Ukraine | 15 | 0.3% |
| Vietnam | 21 | 0.4% |
| Western Asia | 92 | 1.9% | View All 28 Rows |
Sex and Age in Mather
Sex and Age in Mather
The most populous age groups in Mather are 30 to 34 Years (345 | 16.1%) for men and Under 5 Years (290 | 11.3%) for women.
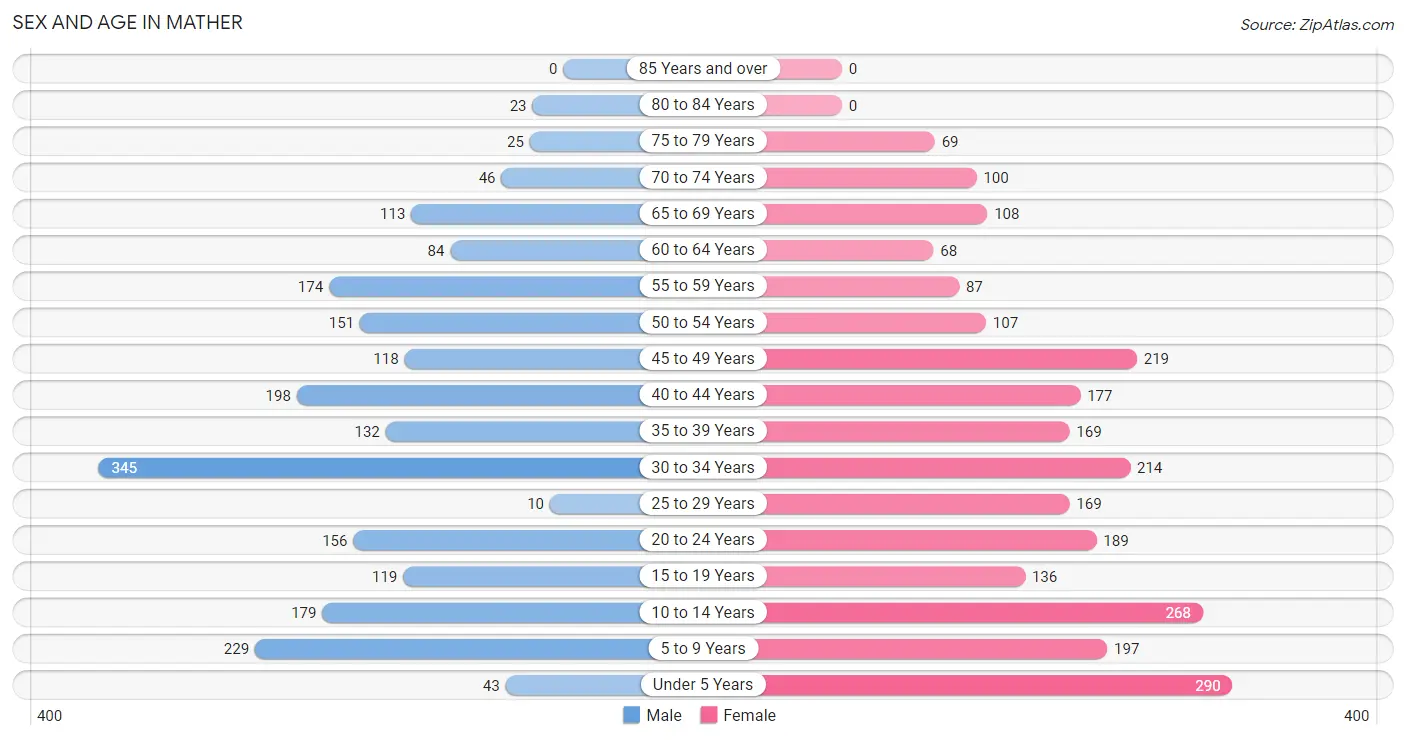
| Age Bracket | Male | Female |
| Under 5 Years | 43 (2.0%) | 290 (11.3%) |
| 5 to 9 Years | 229 (10.7%) | 197 (7.7%) |
| 10 to 14 Years | 179 (8.3%) | 268 (10.4%) |
| 15 to 19 Years | 119 (5.6%) | 136 (5.3%) |
| 20 to 24 Years | 156 (7.3%) | 189 (7.4%) |
| 25 to 29 Years | 10 (0.5%) | 169 (6.6%) |
| 30 to 34 Years | 345 (16.1%) | 214 (8.3%) |
| 35 to 39 Years | 132 (6.1%) | 169 (6.6%) |
| 40 to 44 Years | 198 (9.2%) | 177 (6.9%) |
| 45 to 49 Years | 118 (5.5%) | 219 (8.5%) |
| 50 to 54 Years | 151 (7.0%) | 107 (4.2%) |
| 55 to 59 Years | 174 (8.1%) | 87 (3.4%) |
| 60 to 64 Years | 84 (3.9%) | 68 (2.6%) |
| 65 to 69 Years | 113 (5.3%) | 108 (4.2%) |
| 70 to 74 Years | 46 (2.1%) | 100 (3.9%) |
| 75 to 79 Years | 25 (1.2%) | 69 (2.7%) |
| 80 to 84 Years | 23 (1.1%) | 0 (0.0%) |
| 85 Years and over | 0 (0.0%) | 0 (0.0%) |
| Total | 2,145 (100.0%) | 2,567 (100.0%) |
Families and Households in Mather
Median Family Size in Mather
The median family size in Mather is 3.42 persons per family, with married-couple families (1,033 | 83.7%) accounting for the largest median family size of 3.59 persons per family. On the other hand, single male/father families (111 | 9.0%) represent the smallest median family size with 2.40 persons per family.
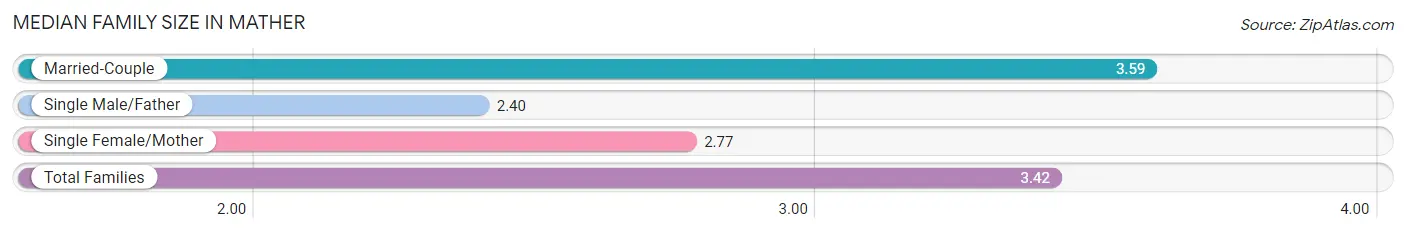
| Family Type | # Families | Family Size |
| Married-Couple | 1,033 (83.7%) | 3.59 |
| Single Male/Father | 111 (9.0%) | 2.40 |
| Single Female/Mother | 90 (7.3%) | 2.77 |
| Total Families | 1,234 (100.0%) | 3.42 |
Median Household Size in Mather
The median household size in Mather is 3.10 persons per household, with married-couple households (1,033 | 68.1%) accounting for the largest median household size of 3.59 persons per household. non-family households (283 | 18.7%) represent the smallest median household size with 1.47 persons per household.
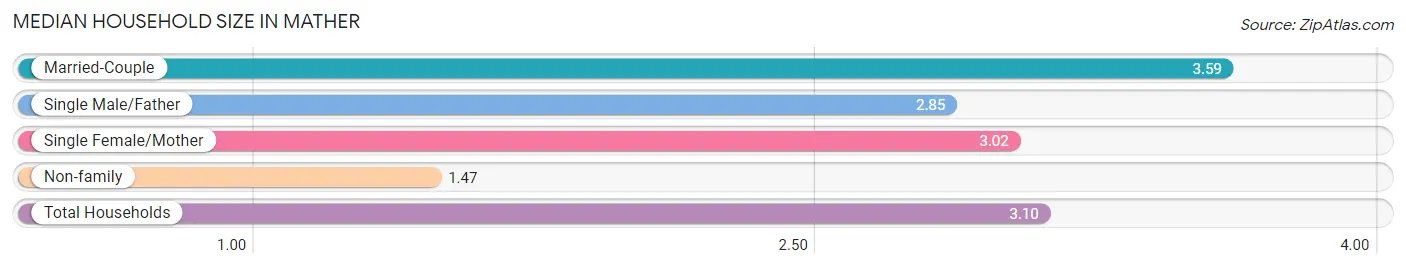
| Household Type | # Households | Household Size |
| Married-Couple | 1,033 (68.1%) | 3.59 |
| Single Male/Father | 111 (7.3%) | 2.85 |
| Single Female/Mother | 90 (5.9%) | 3.02 |
| Non-family | 283 (18.7%) | 1.47 |
| Total Households | 1,517 (100.0%) | 3.10 |
Household Size by Marriage Status in Mather
Out of a total of 1,517 households in Mather, 1,234 (81.3%) are family households, while 283 (18.7%) are nonfamily households. The most numerous type of family households are 4-person households, comprising 409, and the most common type of nonfamily households are 1-person households, comprising 152.
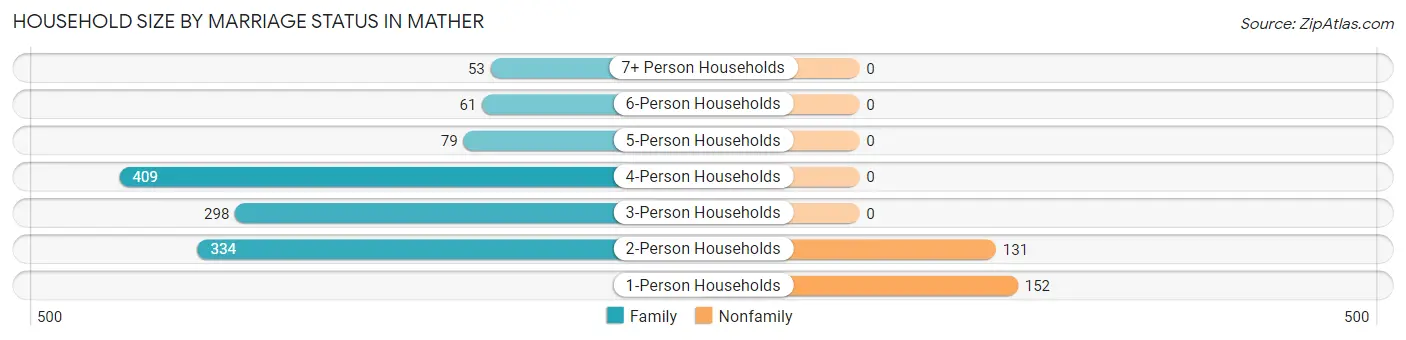
| Household Size | Family Households | Nonfamily Households |
| 1-Person Households | - | 152 (10.0%) |
| 2-Person Households | 334 (22.0%) | 131 (8.6%) |
| 3-Person Households | 298 (19.6%) | 0 (0.0%) |
| 4-Person Households | 409 (27.0%) | 0 (0.0%) |
| 5-Person Households | 79 (5.2%) | 0 (0.0%) |
| 6-Person Households | 61 (4.0%) | 0 (0.0%) |
| 7+ Person Households | 53 (3.5%) | 0 (0.0%) |
| Total | 1,234 (81.3%) | 283 (18.7%) |
Female Fertility in Mather
Fertility by Age in Mather
Average fertility rate in Mather is 31.0 births per 1,000 women. Women in the age bracket of 20 to 34 years have the highest fertility rate with 72.0 births per 1,000 women. Women in the age bracket of 20 to 34 years acount for 100.0% of all women with births.
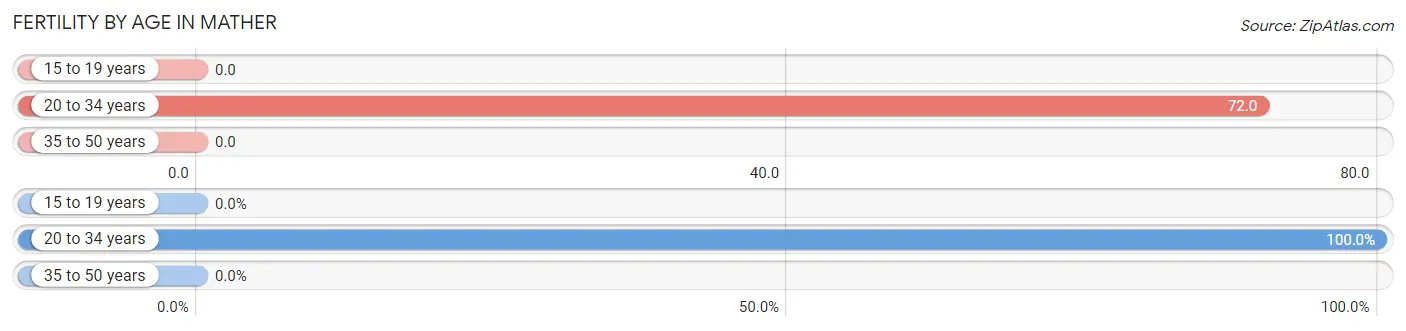
| Age Bracket | Women with Births | Births / 1,000 Women |
| 15 to 19 years | 0 (0.0%) | 0.0 |
| 20 to 34 years | 41 (100.0%) | 72.0 |
| 35 to 50 years | 0 (0.0%) | 0.0 |
| Total | 41 (100.0%) | 31.0 |
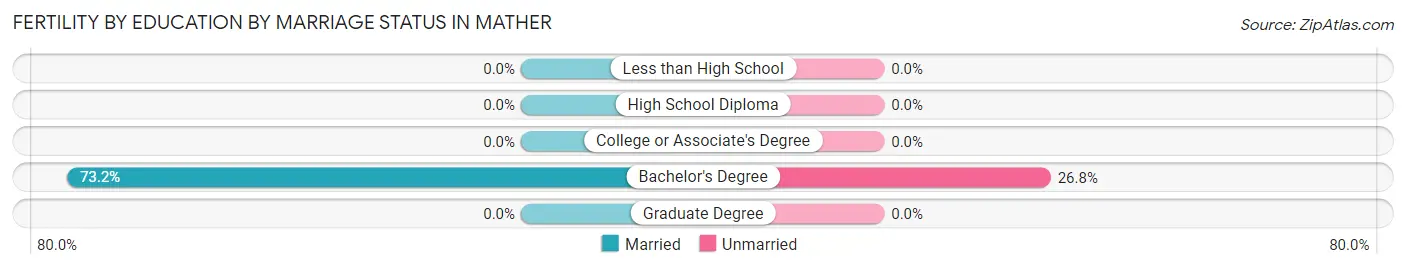
Fertility by Age by Marriage Status in Mather
73.2% of women with births (41) in Mather are married. The highest percentage of unmarried women with births falls into 20 to 34 years age bracket with 26.8% of them unmarried at the time of birth, while the lowest percentage of unmarried women with births belong to 20 to 34 years age bracket with 26.8% of them unmarried.
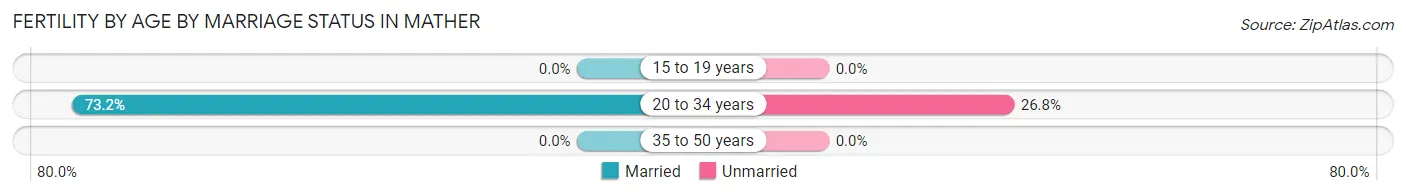
| Age Bracket | Married | Unmarried |
| 15 to 19 years | 0 (0.0%) | 0 (0.0%) |
| 20 to 34 years | 30 (73.2%) | 11 (26.8%) |
| 35 to 50 years | 0 (0.0%) | 0 (0.0%) |
| Total | 30 (73.2%) | 11 (26.8%) |
Fertility by Education in Mather
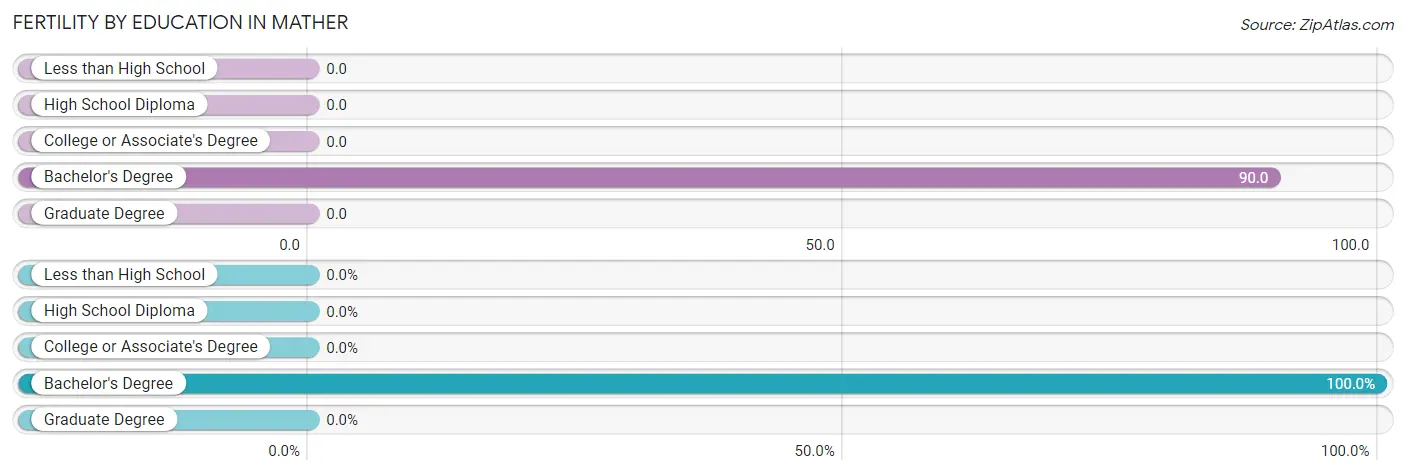
| Educational Attainment | Women with Births | Births / 1,000 Women |
| Less than High School | 0 (0.0%) | 0.0 |
| High School Diploma | 0 (0.0%) | 0.0 |
| College or Associate's Degree | 0 (0.0%) | 0.0 |
| Bachelor's Degree | 41 (100.0%) | 90.0 |
| Graduate Degree | 0 (0.0%) | 0.0 |
| Total | 41 (100.0%) | 31.0 |
Fertility by Education by Marriage Status in Mather
26.8% of women with births in Mather are unmarried. Women with the educational attainment of bachelor's degree are most likely to be married with 73.2% of them married at childbirth, while women with the educational attainment of bachelor's degree are least likely to be married with 26.8% of them unmarried at childbirth.
| Educational Attainment | Married | Unmarried |
| Less than High School | 0 (0.0%) | 0 (0.0%) |
| High School Diploma | 0 (0.0%) | 0 (0.0%) |
| College or Associate's Degree | 0 (0.0%) | 0 (0.0%) |
| Bachelor's Degree | 30 (73.2%) | 11 (26.8%) |
| Graduate Degree | 0 (0.0%) | 0 (0.0%) |
| Total | 30 (73.2%) | 11 (26.8%) |
Employment Characteristics in Mather
Employment by Class of Employer in Mather
Among the 2,365 employed individuals in Mather, private company employees (1,255 | 53.1%), state government employees (351 | 14.8%), and local government employees (261 | 11.0%) make up the most common classes of employment.
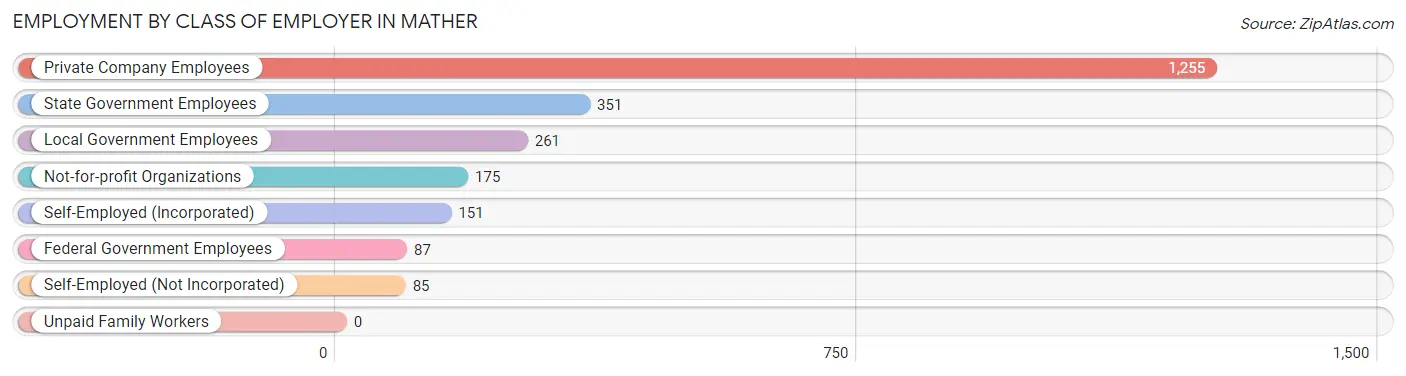
| Employer Class | # Employees | % Employees |
| Private Company Employees | 1,255 | 53.1% |
| Self-Employed (Incorporated) | 151 | 6.4% |
| Self-Employed (Not Incorporated) | 85 | 3.6% |
| Not-for-profit Organizations | 175 | 7.4% |
| Local Government Employees | 261 | 11.0% |
| State Government Employees | 351 | 14.8% |
| Federal Government Employees | 87 | 3.7% |
| Unpaid Family Workers | 0 | 0.0% |
| Total | 2,365 | 100.0% |
Employment Status by Age in Mather
According to the labor force statistics for Mather, out of the total population over 16 years of age (3,455), 70.1% or 2,422 individuals are in the labor force, with 1.3% or 31 of them unemployed. The age group with the highest labor force participation rate is 35 to 44 years, with 88.8% or 600 individuals in the labor force. Within the labor force, the 20 to 24 years age range has the highest percentage of unemployed individuals, with 3.7% or 10 of them being unemployed.
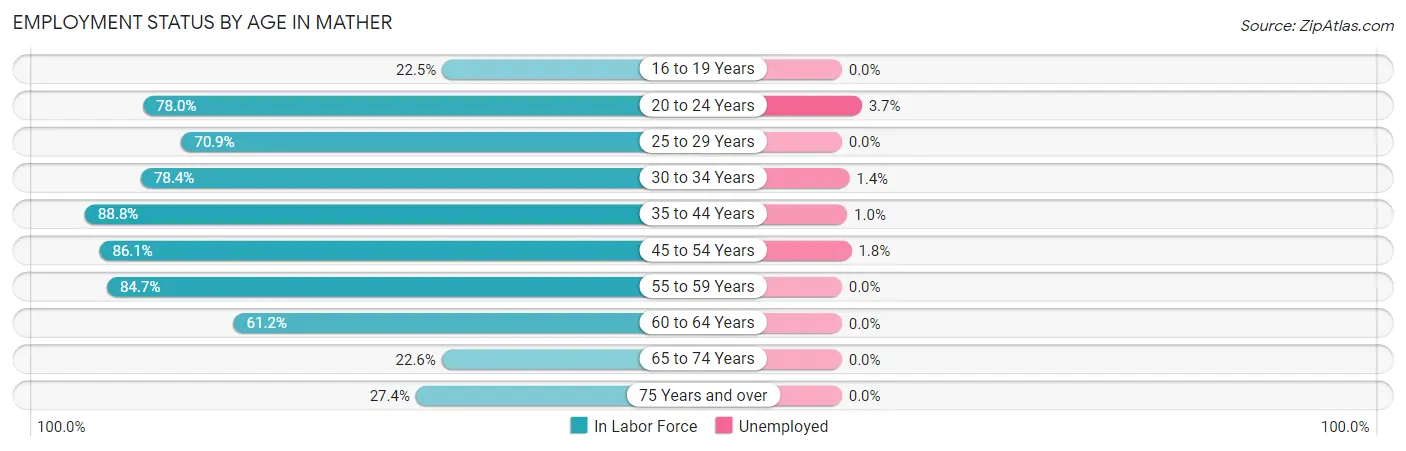
| Age Bracket | In Labor Force | Unemployed |
| 16 to 19 Years | 46 (22.5%) | 0 (0.0%) |
| 20 to 24 Years | 269 (78.0%) | 10 (3.7%) |
| 25 to 29 Years | 127 (70.9%) | 0 (0.0%) |
| 30 to 34 Years | 438 (78.4%) | 6 (1.4%) |
| 35 to 44 Years | 600 (88.8%) | 6 (1.0%) |
| 45 to 54 Years | 512 (86.1%) | 9 (1.8%) |
| 55 to 59 Years | 221 (84.7%) | 0 (0.0%) |
| 60 to 64 Years | 93 (61.2%) | 0 (0.0%) |
| 65 to 74 Years | 83 (22.6%) | 0 (0.0%) |
| 75 Years and over | 32 (27.4%) | 0 (0.0%) |
| Total | 2,422 (70.1%) | 31 (1.3%) |
Employment Status by Educational Attainment in Mather
According to labor force statistics for Mather, 82.2% of individuals (1,991) out of the total population between 25 and 64 years of age (2,422) are in the labor force, with 1.1% or 22 of them being unemployed. The group with the highest labor force participation rate are those with the educational attainment of bachelor's degree or higher, with 88.1% or 917 individuals in the labor force. Within the labor force, individuals with high school diploma education have the highest percentage of unemployment, with 2.0% or 6 of them being unemployed.
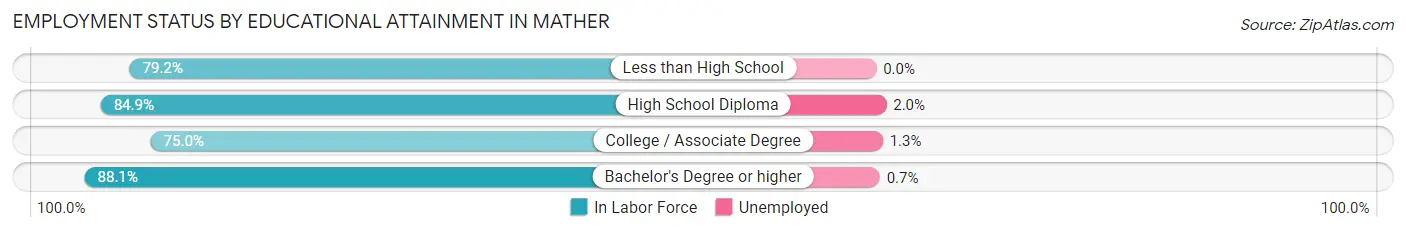
| Educational Attainment | In Labor Force | Unemployed |
| Less than High School | 57 (79.2%) | 0 (0.0%) |
| High School Diploma | 303 (84.9%) | 7 (2.0%) |
| College / Associate Degree | 714 (75.0%) | 12 (1.3%) |
| Bachelor's Degree or higher | 917 (88.1%) | 7 (0.7%) |
| Total | 1,991 (82.2%) | 27 (1.1%) |
Employment Occupations by Sex in Mather
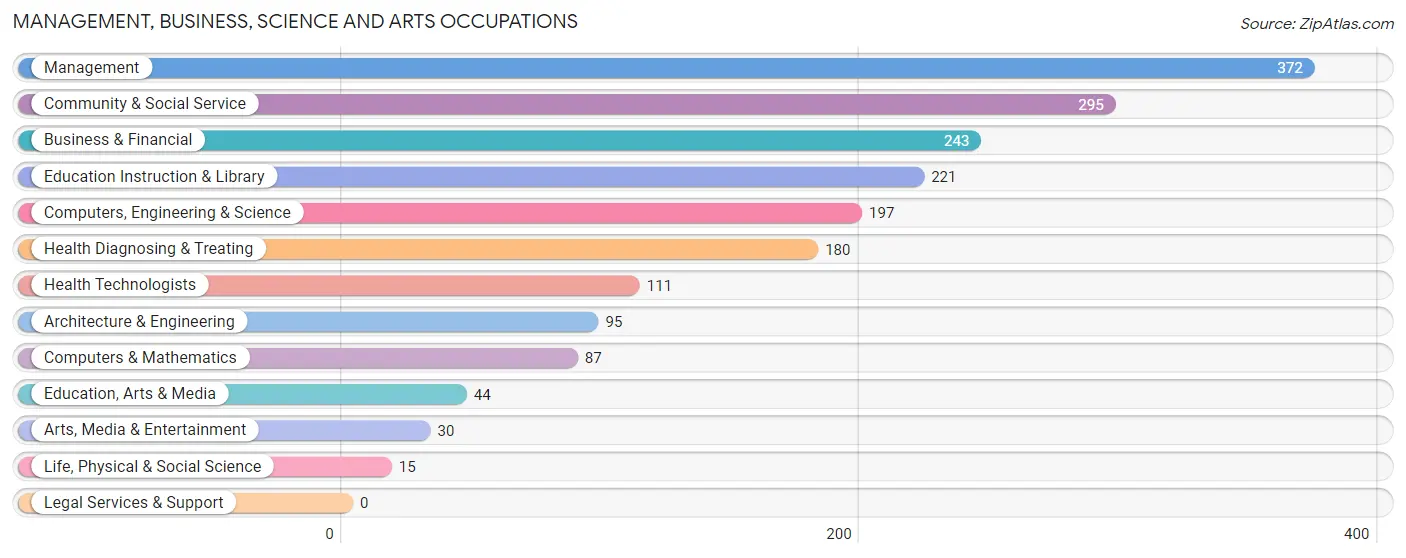
Management, Business, Science and Arts Occupations
The most common Management, Business, Science and Arts occupations in Mather are Management (372 | 15.6%), Community & Social Service (295 | 12.3%), Business & Financial (243 | 10.2%), Education Instruction & Library (221 | 9.2%), and Computers, Engineering & Science (197 | 8.2%).
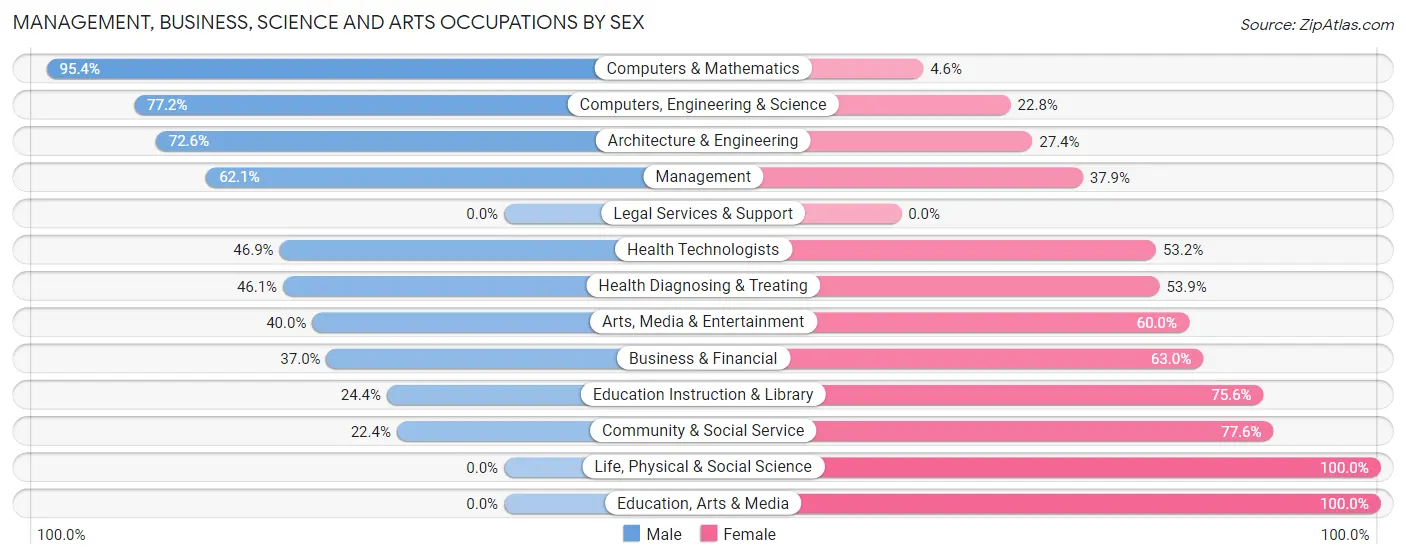
Management, Business, Science and Arts Occupations by Sex
Within the Management, Business, Science and Arts occupations in Mather, the most male-oriented occupations are Computers & Mathematics (95.4%), Computers, Engineering & Science (77.2%), and Architecture & Engineering (72.6%), while the most female-oriented occupations are Life, Physical & Social Science (100.0%), Education, Arts & Media (100.0%), and Community & Social Service (77.6%).
| Occupation | Male | Female |
| Management | 231 (62.1%) | 141 (37.9%) |
| Business & Financial | 90 (37.0%) | 153 (63.0%) |
| Computers, Engineering & Science | 152 (77.2%) | 45 (22.8%) |
| Computers & Mathematics | 83 (95.4%) | 4 (4.6%) |
| Architecture & Engineering | 69 (72.6%) | 26 (27.4%) |
| Life, Physical & Social Science | 0 (0.0%) | 15 (100.0%) |
| Community & Social Service | 66 (22.4%) | 229 (77.6%) |
| Education, Arts & Media | 0 (0.0%) | 44 (100.0%) |
| Legal Services & Support | 0 (0.0%) | 0 (0.0%) |
| Education Instruction & Library | 54 (24.4%) | 167 (75.6%) |
| Arts, Media & Entertainment | 12 (40.0%) | 18 (60.0%) |
| Health Diagnosing & Treating | 83 (46.1%) | 97 (53.9%) |
| Health Technologists | 52 (46.9%) | 59 (53.1%) |
| Total (Category) | 622 (48.3%) | 665 (51.7%) |
| Total (Overall) | 1,271 (53.2%) | 1,119 (46.8%) |
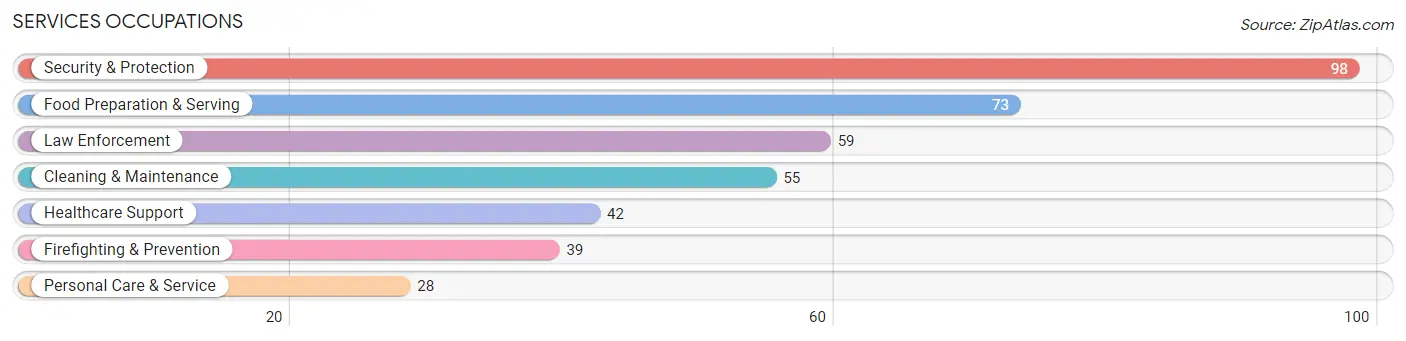
Services Occupations
The most common Services occupations in Mather are Security & Protection (98 | 4.1%), Food Preparation & Serving (73 | 3.0%), Law Enforcement (59 | 2.5%), Cleaning & Maintenance (55 | 2.3%), and Healthcare Support (42 | 1.8%).
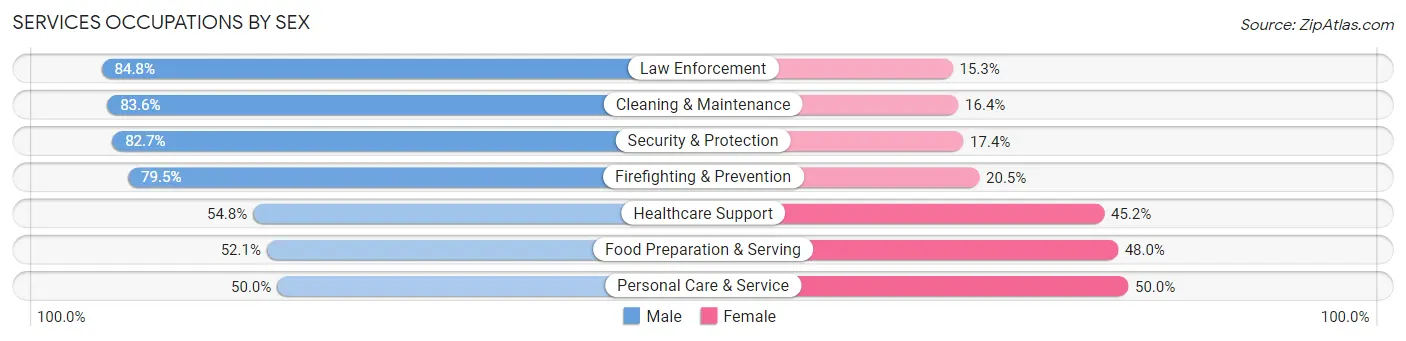
Services Occupations by Sex
Within the Services occupations in Mather, the most male-oriented occupations are Law Enforcement (84.8%), Cleaning & Maintenance (83.6%), and Security & Protection (82.7%), while the most female-oriented occupations are Personal Care & Service (50.0%), Food Preparation & Serving (47.9%), and Healthcare Support (45.2%).
| Occupation | Male | Female |
| Healthcare Support | 23 (54.8%) | 19 (45.2%) |
| Security & Protection | 81 (82.7%) | 17 (17.3%) |
| Firefighting & Prevention | 31 (79.5%) | 8 (20.5%) |
| Law Enforcement | 50 (84.8%) | 9 (15.2%) |
| Food Preparation & Serving | 38 (52.0%) | 35 (47.9%) |
| Cleaning & Maintenance | 46 (83.6%) | 9 (16.4%) |
| Personal Care & Service | 14 (50.0%) | 14 (50.0%) |
| Total (Category) | 202 (68.2%) | 94 (31.8%) |
| Total (Overall) | 1,271 (53.2%) | 1,119 (46.8%) |
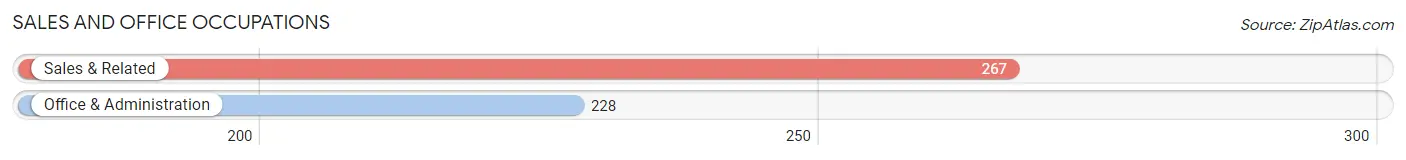
Sales and Office Occupations
The most common Sales and Office occupations in Mather are Sales & Related (267 | 11.2%), and Office & Administration (228 | 9.5%).
Sales and Office Occupations by Sex
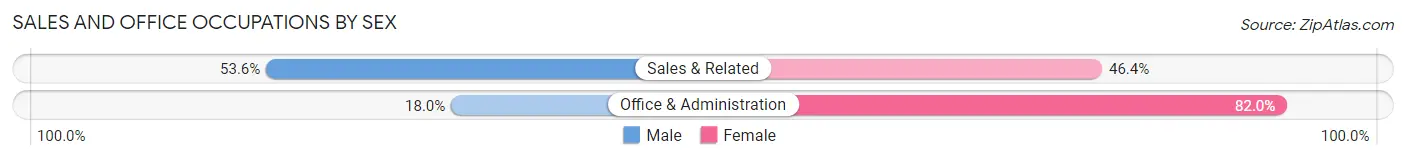
| Occupation | Male | Female |
| Sales & Related | 143 (53.6%) | 124 (46.4%) |
| Office & Administration | 41 (18.0%) | 187 (82.0%) |
| Total (Category) | 184 (37.2%) | 311 (62.8%) |
| Total (Overall) | 1,271 (53.2%) | 1,119 (46.8%) |
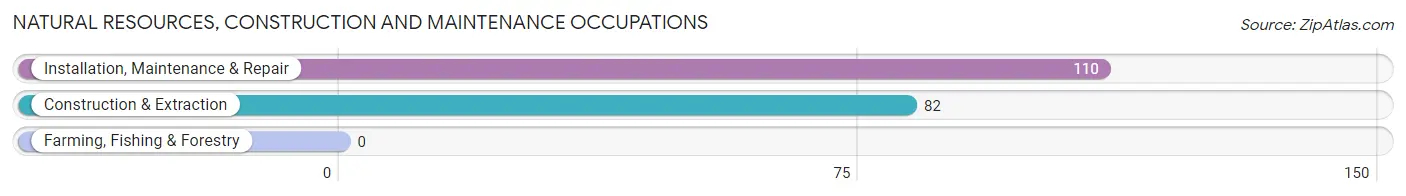
Natural Resources, Construction and Maintenance Occupations
The most common Natural Resources, Construction and Maintenance occupations in Mather are Installation, Maintenance & Repair (110 | 4.6%), and Construction & Extraction (82 | 3.4%).
Natural Resources, Construction and Maintenance Occupations by Sex
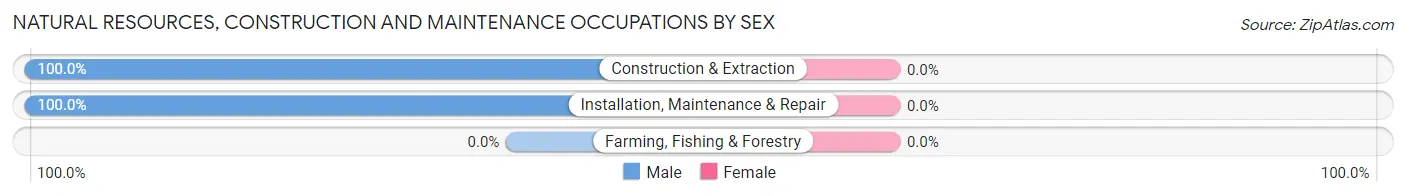
| Occupation | Male | Female |
| Farming, Fishing & Forestry | 0 (0.0%) | 0 (0.0%) |
| Construction & Extraction | 82 (100.0%) | 0 (0.0%) |
| Installation, Maintenance & Repair | 110 (100.0%) | 0 (0.0%) |
| Total (Category) | 192 (100.0%) | 0 (0.0%) |
| Total (Overall) | 1,271 (53.2%) | 1,119 (46.8%) |
Production, Transportation and Moving Occupations
The most common Production, Transportation and Moving occupations in Mather are Material Moving (96 | 4.0%), Production (17 | 0.7%), and Transportation (7 | 0.3%).
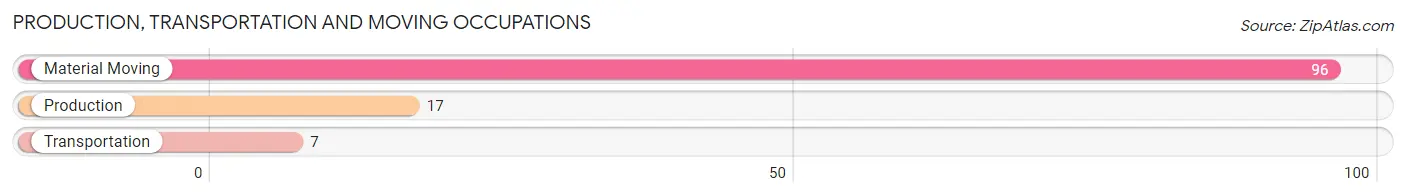
Production, Transportation and Moving Occupations by Sex
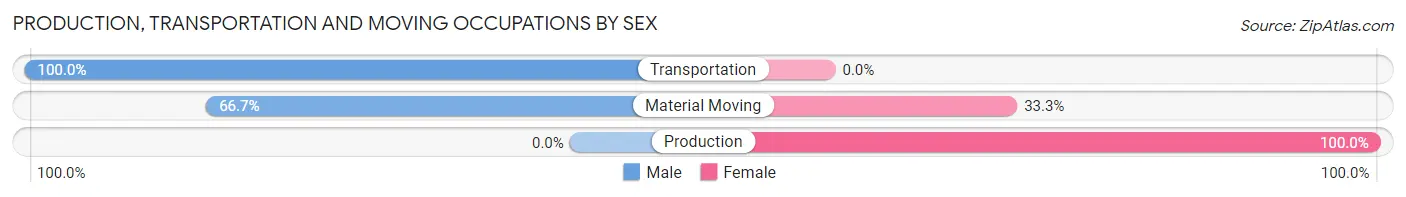
| Occupation | Male | Female |
| Production | 0 (0.0%) | 17 (100.0%) |
| Transportation | 7 (100.0%) | 0 (0.0%) |
| Material Moving | 64 (66.7%) | 32 (33.3%) |
| Total (Category) | 71 (59.2%) | 49 (40.8%) |
| Total (Overall) | 1,271 (53.2%) | 1,119 (46.8%) |
Employment Industries by Sex in Mather
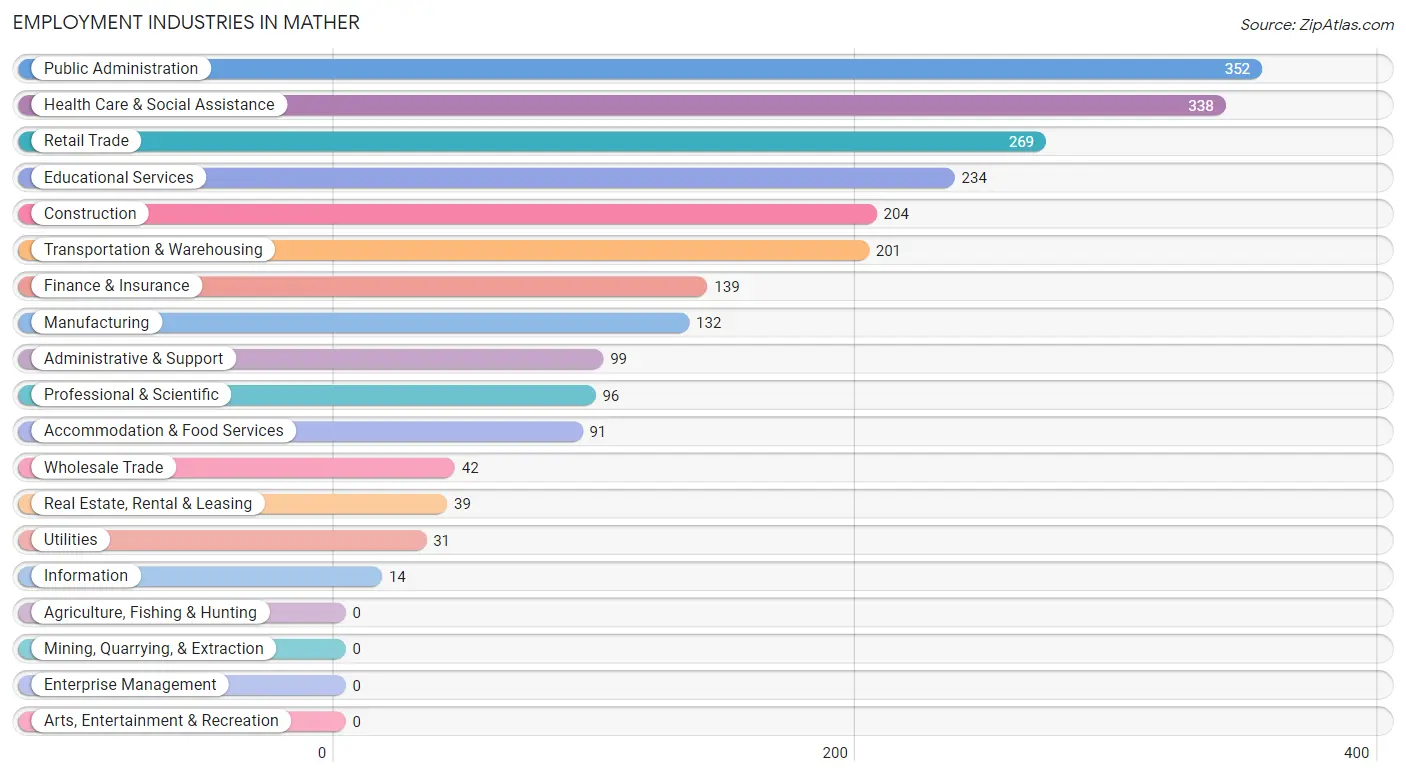
Employment Industries in Mather
The major employment industries in Mather include Public Administration (352 | 14.7%), Health Care & Social Assistance (338 | 14.1%), Retail Trade (269 | 11.3%), Educational Services (234 | 9.8%), and Construction (204 | 8.5%).
Employment Industries by Sex in Mather
The Mather industries that see more men than women are Construction (98.0%), Administrative & Support (87.9%), and Wholesale Trade (85.7%), whereas the industries that tend to have a higher number of women are Educational Services (91.4%), Health Care & Social Assistance (63.3%), and Accommodation & Food Services (58.2%).
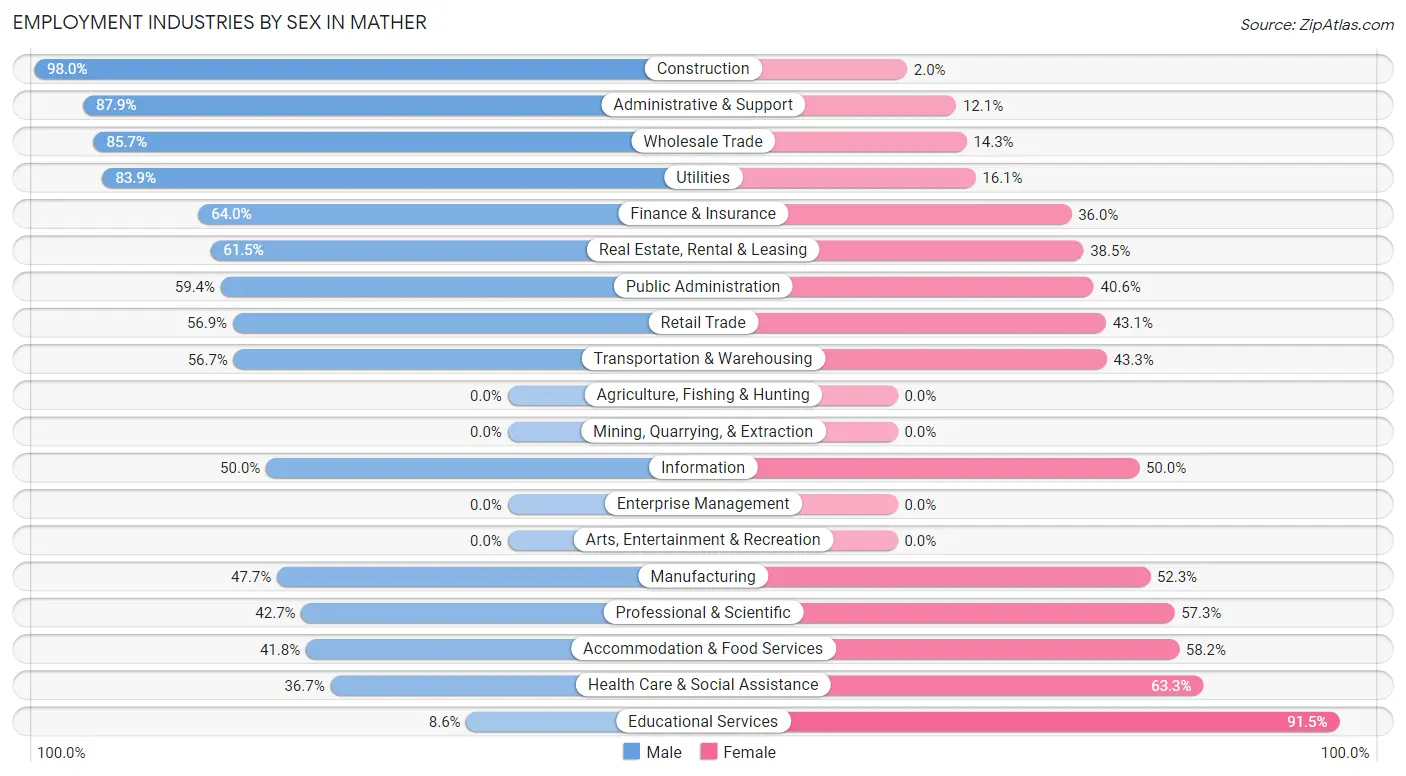
| Industry | Male | Female |
| Agriculture, Fishing & Hunting | 0 (0.0%) | 0 (0.0%) |
| Mining, Quarrying, & Extraction | 0 (0.0%) | 0 (0.0%) |
| Construction | 200 (98.0%) | 4 (2.0%) |
| Manufacturing | 63 (47.7%) | 69 (52.3%) |
| Wholesale Trade | 36 (85.7%) | 6 (14.3%) |
| Retail Trade | 153 (56.9%) | 116 (43.1%) |
| Transportation & Warehousing | 114 (56.7%) | 87 (43.3%) |
| Utilities | 26 (83.9%) | 5 (16.1%) |
| Information | 7 (50.0%) | 7 (50.0%) |
| Finance & Insurance | 89 (64.0%) | 50 (36.0%) |
| Real Estate, Rental & Leasing | 24 (61.5%) | 15 (38.5%) |
| Professional & Scientific | 41 (42.7%) | 55 (57.3%) |
| Enterprise Management | 0 (0.0%) | 0 (0.0%) |
| Administrative & Support | 87 (87.9%) | 12 (12.1%) |
| Educational Services | 20 (8.6%) | 214 (91.4%) |
| Health Care & Social Assistance | 124 (36.7%) | 214 (63.3%) |
| Arts, Entertainment & Recreation | 0 (0.0%) | 0 (0.0%) |
| Accommodation & Food Services | 38 (41.8%) | 53 (58.2%) |
| Public Administration | 209 (59.4%) | 143 (40.6%) |
| Total | 1,271 (53.2%) | 1,119 (46.8%) |
Education in Mather
School Enrollment in Mather
The most common levels of schooling among the 1,493 students in Mather are middle school (368 | 24.6%), high school (288 | 19.3%), and elementary school (287 | 19.2%).
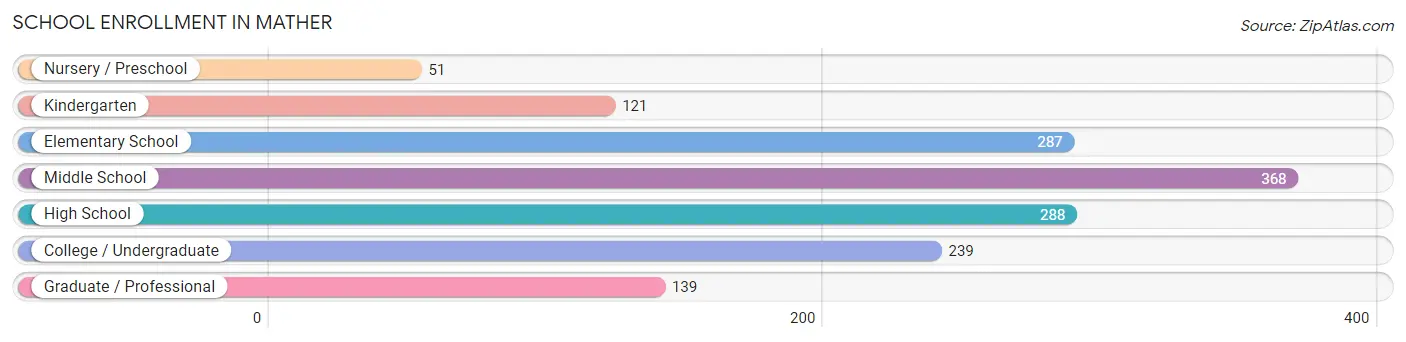
| School Level | # Students | % Students |
| Nursery / Preschool | 51 | 3.4% |
| Kindergarten | 121 | 8.1% |
| Elementary School | 287 | 19.2% |
| Middle School | 368 | 24.6% |
| High School | 288 | 19.3% |
| College / Undergraduate | 239 | 16.0% |
| Graduate / Professional | 139 | 9.3% |
| Total | 1,493 | 100.0% |
School Enrollment by Age by Funding Source in Mather
Out of a total of 1,493 students who are enrolled in schools in Mather, 266 (17.8%) attend a private institution, while the remaining 1,227 (82.2%) are enrolled in public schools. The age group of 3 to 4 year olds has the highest likelihood of being enrolled in private schools, with 32 (71.1% in the age bracket) enrolled. Conversely, the age group of 18 to 19 year olds has the lowest likelihood of being enrolled in a private school, with 41 (100.0% in the age bracket) attending a public institution.
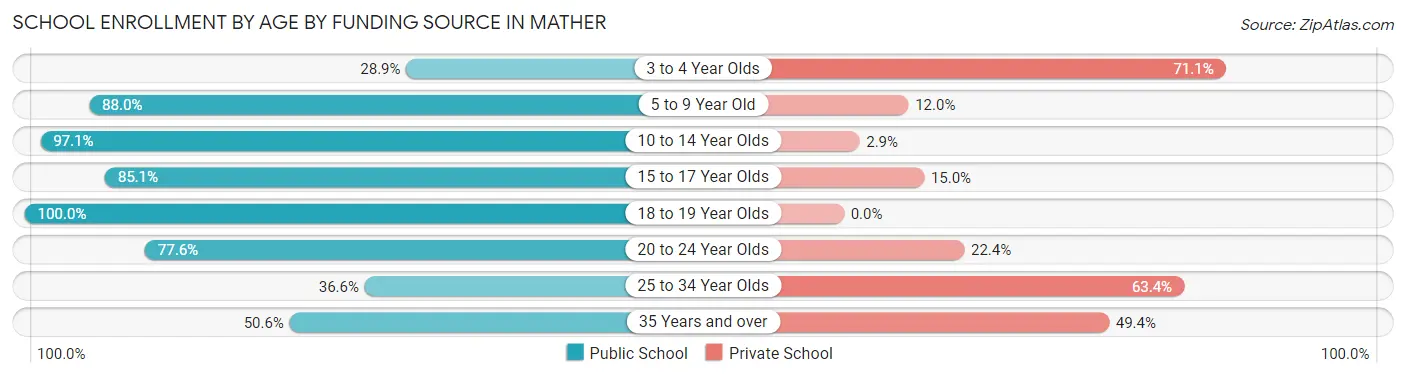
| Age Bracket | Public School | Private School |
| 3 to 4 Year Olds | 13 (28.9%) | 32 (71.1%) |
| 5 to 9 Year Old | 351 (88.0%) | 48 (12.0%) |
| 10 to 14 Year Olds | 434 (97.1%) | 13 (2.9%) |
| 15 to 17 Year Olds | 182 (85.1%) | 32 (14.9%) |
| 18 to 19 Year Olds | 41 (100.0%) | 0 (0.0%) |
| 20 to 24 Year Olds | 128 (77.6%) | 37 (22.4%) |
| 25 to 34 Year Olds | 37 (36.6%) | 64 (63.4%) |
| 35 Years and over | 41 (50.6%) | 40 (49.4%) |
| Total | 1,227 (82.2%) | 266 (17.8%) |
Educational Attainment by Field of Study in Mather
Business (322 | 24.6%), education (149 | 11.4%), liberal arts & history (149 | 11.4%), engineering (125 | 9.6%), and social sciences (106 | 8.1%) are the most common fields of study among 1,309 individuals in Mather who have obtained a bachelor's degree or higher.
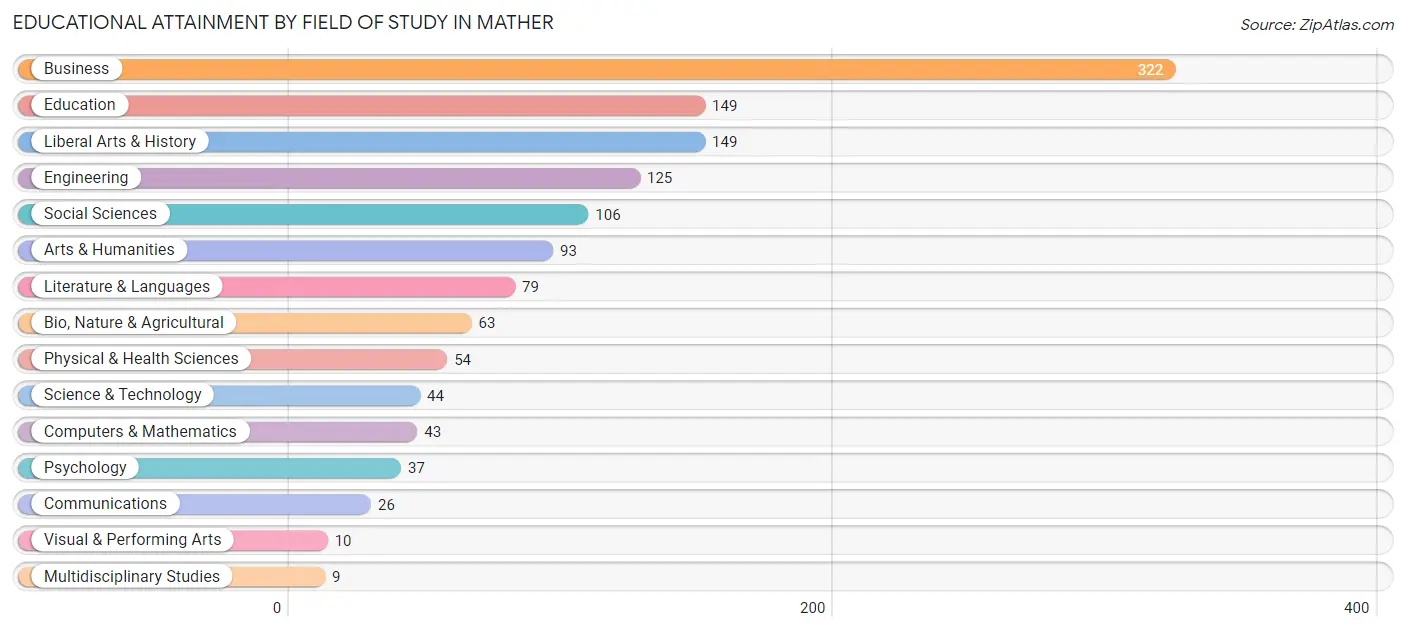
| Field of Study | # Graduates | % Graduates |
| Computers & Mathematics | 43 | 3.3% |
| Bio, Nature & Agricultural | 63 | 4.8% |
| Physical & Health Sciences | 54 | 4.1% |
| Psychology | 37 | 2.8% |
| Social Sciences | 106 | 8.1% |
| Engineering | 125 | 9.6% |
| Multidisciplinary Studies | 9 | 0.7% |
| Science & Technology | 44 | 3.4% |
| Business | 322 | 24.6% |
| Education | 149 | 11.4% |
| Literature & Languages | 79 | 6.0% |
| Liberal Arts & History | 149 | 11.4% |
| Visual & Performing Arts | 10 | 0.8% |
| Communications | 26 | 2.0% |
| Arts & Humanities | 93 | 7.1% |
| Total | 1,309 | 100.0% |
Transportation & Commute in Mather
Vehicle Availability by Sex in Mather
The most prevalent vehicle ownership categories in Mather are males with 2 vehicles (379, accounting for 30.4%) and females with 2 vehicles (379, making up 33.9%).
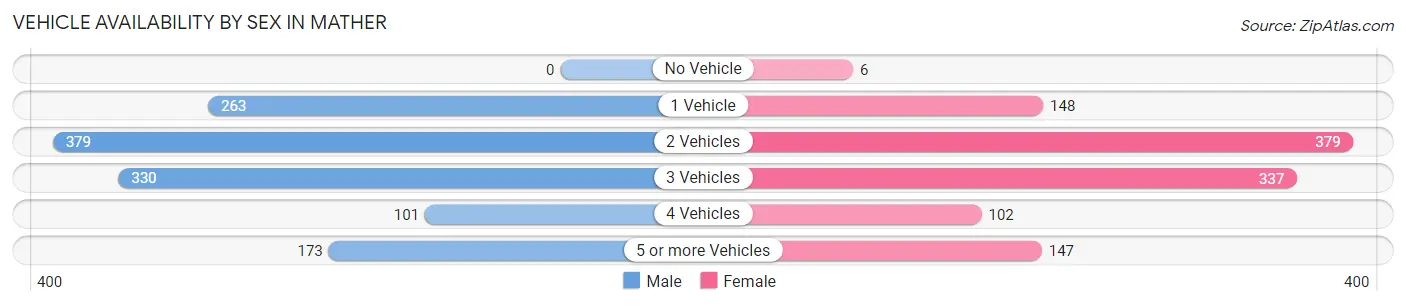
| Vehicles Available | Male | Female |
| No Vehicle | 0 (0.0%) | 6 (0.5%) |
| 1 Vehicle | 263 (21.1%) | 148 (13.2%) |
| 2 Vehicles | 379 (30.4%) | 379 (33.9%) |
| 3 Vehicles | 330 (26.5%) | 337 (30.1%) |
| 4 Vehicles | 101 (8.1%) | 102 (9.1%) |
| 5 or more Vehicles | 173 (13.9%) | 147 (13.1%) |
| Total | 1,246 (100.0%) | 1,119 (100.0%) |
Commute Time in Mather
The most frequently occuring commute durations in Mather are 30 to 34 minutes (385 commuters, 20.6%), 10 to 14 minutes (355 commuters, 19.0%), and 15 to 19 minutes (331 commuters, 17.7%).
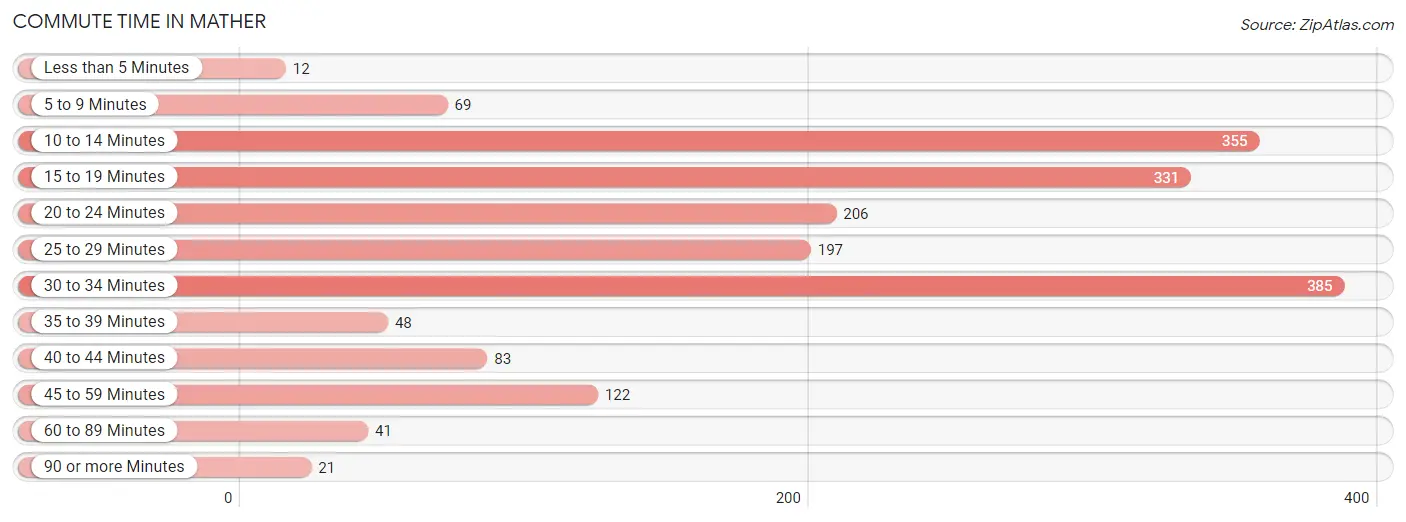
| Commute Time | # Commuters | % Commuters |
| Less than 5 Minutes | 12 | 0.6% |
| 5 to 9 Minutes | 69 | 3.7% |
| 10 to 14 Minutes | 355 | 19.0% |
| 15 to 19 Minutes | 331 | 17.7% |
| 20 to 24 Minutes | 206 | 11.0% |
| 25 to 29 Minutes | 197 | 10.5% |
| 30 to 34 Minutes | 385 | 20.6% |
| 35 to 39 Minutes | 48 | 2.6% |
| 40 to 44 Minutes | 83 | 4.4% |
| 45 to 59 Minutes | 122 | 6.5% |
| 60 to 89 Minutes | 41 | 2.2% |
| 90 or more Minutes | 21 | 1.1% |
Commute Time by Sex in Mather
The most common commute times in Mather are 10 to 14 minutes (244 commuters, 24.5%) for males and 30 to 34 minutes (249 commuters, 28.5%) for females.
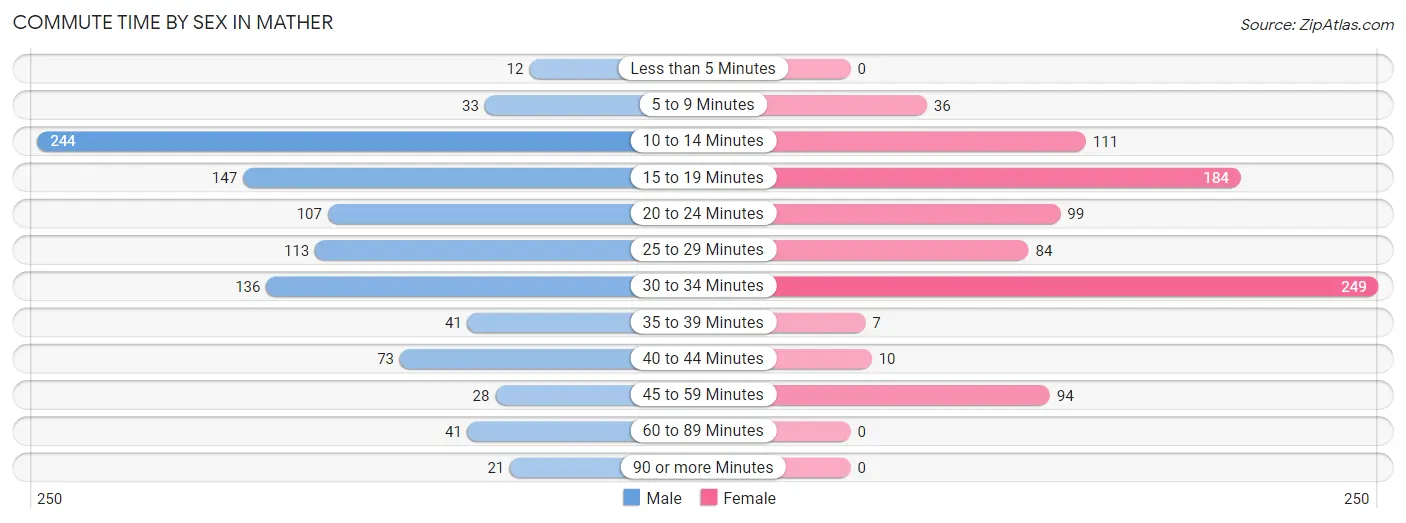
| Commute Time | Male | Female |
| Less than 5 Minutes | 12 (1.2%) | 0 (0.0%) |
| 5 to 9 Minutes | 33 (3.3%) | 36 (4.1%) |
| 10 to 14 Minutes | 244 (24.5%) | 111 (12.7%) |
| 15 to 19 Minutes | 147 (14.8%) | 184 (21.0%) |
| 20 to 24 Minutes | 107 (10.7%) | 99 (11.3%) |
| 25 to 29 Minutes | 113 (11.4%) | 84 (9.6%) |
| 30 to 34 Minutes | 136 (13.7%) | 249 (28.5%) |
| 35 to 39 Minutes | 41 (4.1%) | 7 (0.8%) |
| 40 to 44 Minutes | 73 (7.3%) | 10 (1.1%) |
| 45 to 59 Minutes | 28 (2.8%) | 94 (10.8%) |
| 60 to 89 Minutes | 41 (4.1%) | 0 (0.0%) |
| 90 or more Minutes | 21 (2.1%) | 0 (0.0%) |
Time of Departure to Work by Sex in Mather
The most frequent times of departure to work in Mather are 6:30 AM to 6:59 AM (175, 17.6%) for males and 7:30 AM to 7:59 AM (280, 32.0%) for females.
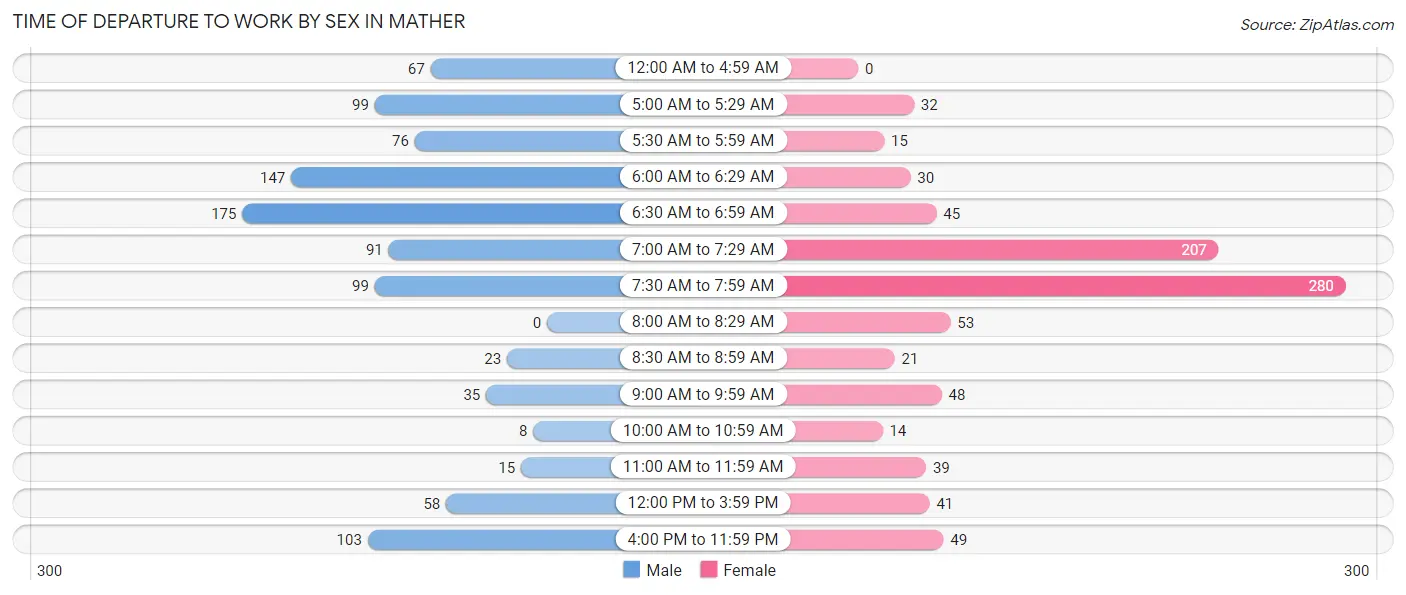
| Time of Departure | Male | Female |
| 12:00 AM to 4:59 AM | 67 (6.7%) | 0 (0.0%) |
| 5:00 AM to 5:29 AM | 99 (9.9%) | 32 (3.7%) |
| 5:30 AM to 5:59 AM | 76 (7.6%) | 15 (1.7%) |
| 6:00 AM to 6:29 AM | 147 (14.8%) | 30 (3.4%) |
| 6:30 AM to 6:59 AM | 175 (17.6%) | 45 (5.1%) |
| 7:00 AM to 7:29 AM | 91 (9.1%) | 207 (23.7%) |
| 7:30 AM to 7:59 AM | 99 (9.9%) | 280 (32.0%) |
| 8:00 AM to 8:29 AM | 0 (0.0%) | 53 (6.1%) |
| 8:30 AM to 8:59 AM | 23 (2.3%) | 21 (2.4%) |
| 9:00 AM to 9:59 AM | 35 (3.5%) | 48 (5.5%) |
| 10:00 AM to 10:59 AM | 8 (0.8%) | 14 (1.6%) |
| 11:00 AM to 11:59 AM | 15 (1.5%) | 39 (4.5%) |
| 12:00 PM to 3:59 PM | 58 (5.8%) | 41 (4.7%) |
| 4:00 PM to 11:59 PM | 103 (10.3%) | 49 (5.6%) |
| Total | 996 (100.0%) | 874 (100.0%) |
Housing Occupancy in Mather
Occupancy by Ownership in Mather
Of the total 1,517 dwellings in Mather, owner-occupied units account for 1,236 (81.5%), while renter-occupied units make up 281 (18.5%).
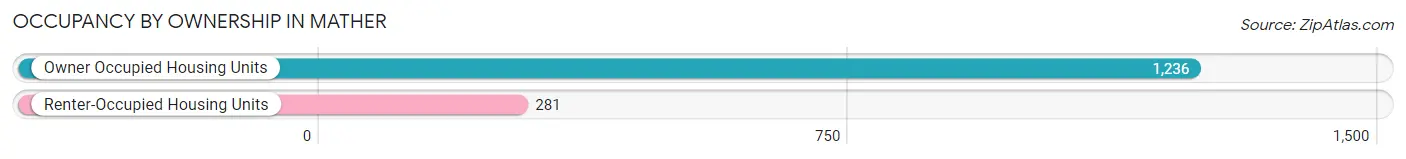
| Occupancy | # Housing Units | % Housing Units |
| Owner Occupied Housing Units | 1,236 | 81.5% |
| Renter-Occupied Housing Units | 281 | 18.5% |
| Total Occupied Housing Units | 1,517 | 100.0% |
Occupancy by Household Size in Mather
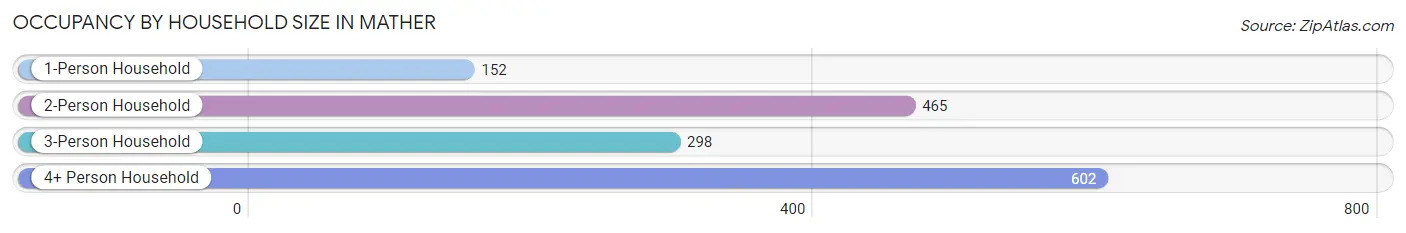
| Household Size | # Housing Units | % Housing Units |
| 1-Person Household | 152 | 10.0% |
| 2-Person Household | 465 | 30.6% |
| 3-Person Household | 298 | 19.6% |
| 4+ Person Household | 602 | 39.7% |
| Total Housing Units | 1,517 | 100.0% |
Occupancy by Ownership by Household Size in Mather
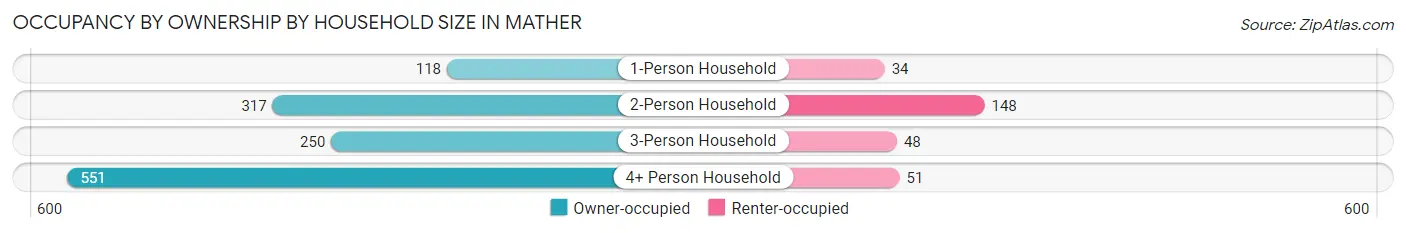
| Household Size | Owner-occupied | Renter-occupied |
| 1-Person Household | 118 (77.6%) | 34 (22.4%) |
| 2-Person Household | 317 (68.2%) | 148 (31.8%) |
| 3-Person Household | 250 (83.9%) | 48 (16.1%) |
| 4+ Person Household | 551 (91.5%) | 51 (8.5%) |
| Total Housing Units | 1,236 (81.5%) | 281 (18.5%) |
Occupancy by Educational Attainment in Mather
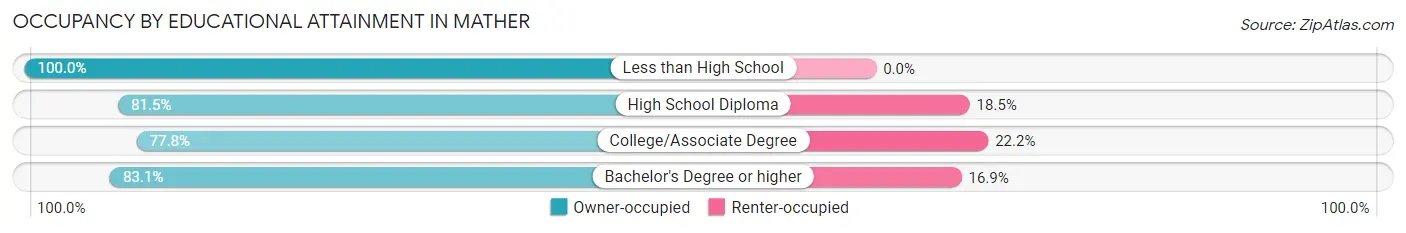
| Household Size | Owner-occupied | Renter-occupied |
| Less than High School | 48 (100.0%) | 0 (0.0%) |
| High School Diploma | 189 (81.5%) | 43 (18.5%) |
| College/Associate Degree | 420 (77.8%) | 120 (22.2%) |
| Bachelor's Degree or higher | 579 (83.1%) | 118 (16.9%) |
Occupancy by Age of Householder in Mather
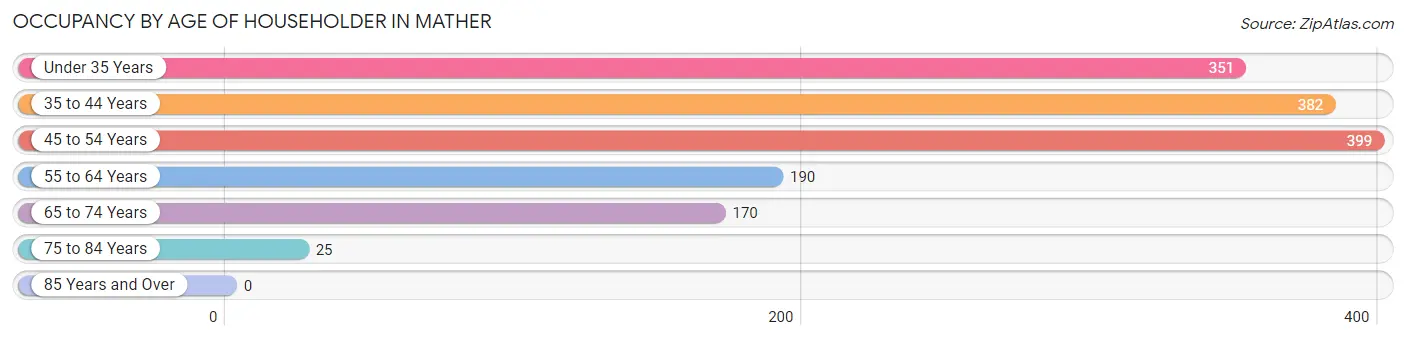
| Age Bracket | # Households | % Households |
| Under 35 Years | 351 | 23.1% |
| 35 to 44 Years | 382 | 25.2% |
| 45 to 54 Years | 399 | 26.3% |
| 55 to 64 Years | 190 | 12.5% |
| 65 to 74 Years | 170 | 11.2% |
| 75 to 84 Years | 25 | 1.7% |
| 85 Years and Over | 0 | 0.0% |
| Total | 1,517 | 100.0% |
Housing Finances in Mather
Median Income by Occupancy in Mather
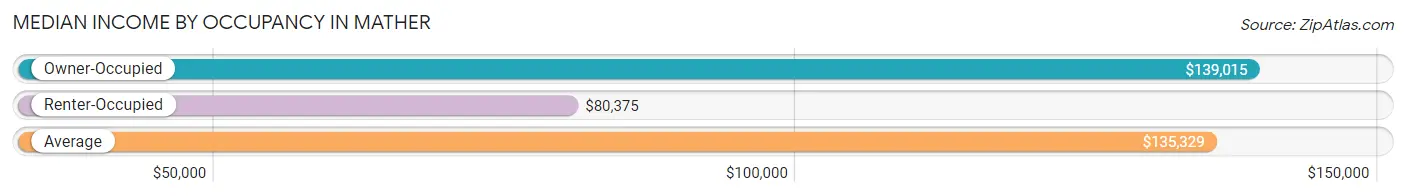
| Occupancy Type | # Households | Median Income |
| Owner-Occupied | 1,236 (81.5%) | $139,015 |
| Renter-Occupied | 281 (18.5%) | $80,375 |
| Average | 1,517 (100.0%) | $135,329 |
Occupancy by Householder Income Bracket in Mather
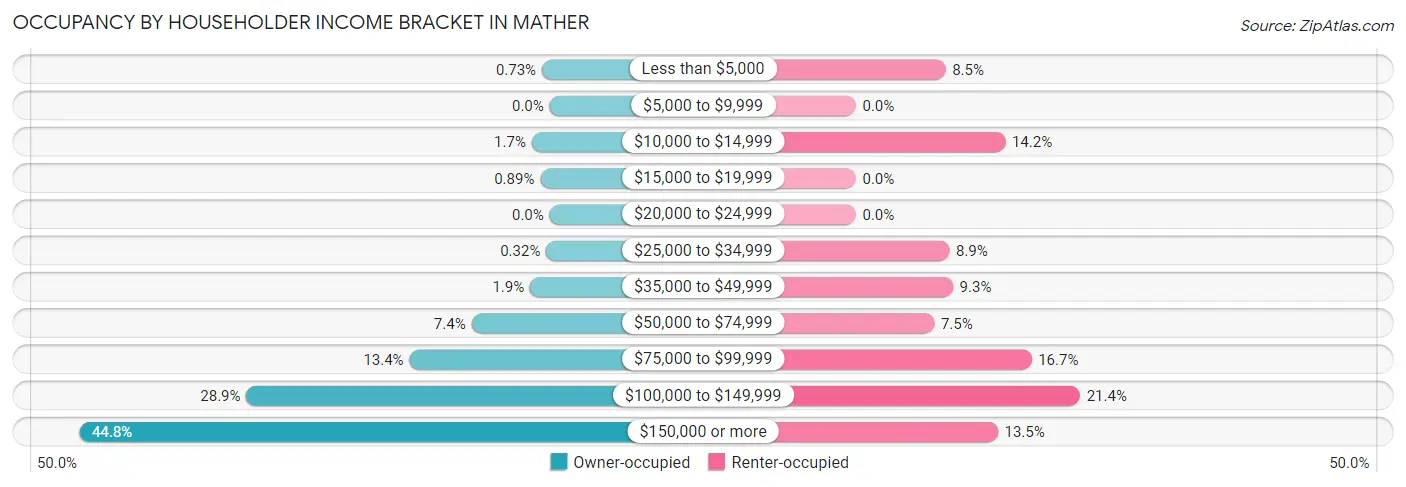
| Income Bracket | Owner-occupied | Renter-occupied |
| Less than $5,000 | 9 (0.7%) | 24 (8.5%) |
| $5,000 to $9,999 | 0 (0.0%) | 0 (0.0%) |
| $10,000 to $14,999 | 21 (1.7%) | 40 (14.2%) |
| $15,000 to $19,999 | 11 (0.9%) | 0 (0.0%) |
| $20,000 to $24,999 | 0 (0.0%) | 0 (0.0%) |
| $25,000 to $34,999 | 4 (0.3%) | 25 (8.9%) |
| $35,000 to $49,999 | 23 (1.9%) | 26 (9.2%) |
| $50,000 to $74,999 | 92 (7.4%) | 21 (7.5%) |
| $75,000 to $99,999 | 165 (13.4%) | 47 (16.7%) |
| $100,000 to $149,999 | 357 (28.9%) | 60 (21.3%) |
| $150,000 or more | 554 (44.8%) | 38 (13.5%) |
| Total | 1,236 (100.0%) | 281 (100.0%) |
Monthly Housing Cost Tiers in Mather
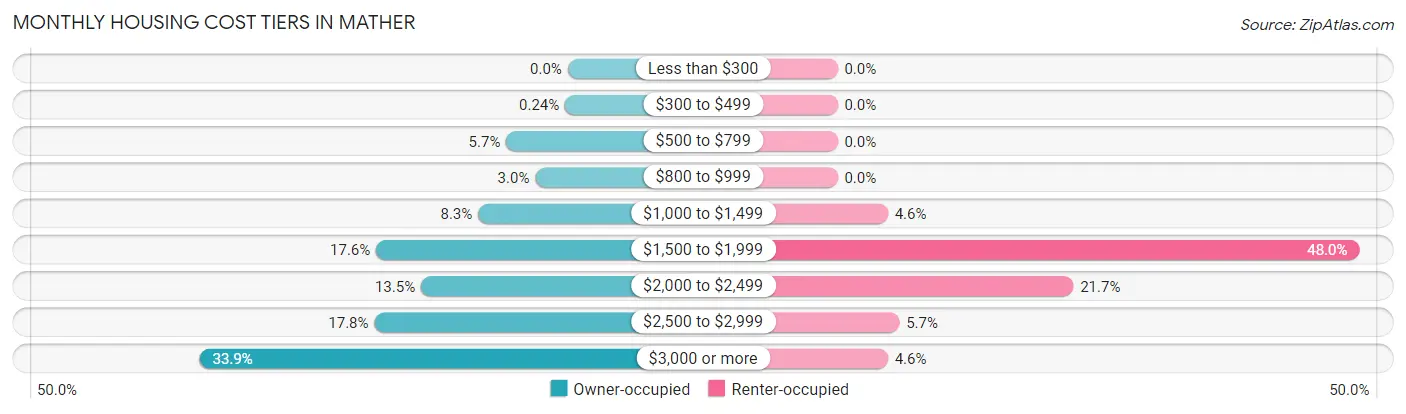
| Monthly Cost | Owner-occupied | Renter-occupied |
| Less than $300 | 0 (0.0%) | 0 (0.0%) |
| $300 to $499 | 3 (0.2%) | 0 (0.0%) |
| $500 to $799 | 70 (5.7%) | 0 (0.0%) |
| $800 to $999 | 37 (3.0%) | 0 (0.0%) |
| $1,000 to $1,499 | 102 (8.3%) | 13 (4.6%) |
| $1,500 to $1,999 | 218 (17.6%) | 135 (48.0%) |
| $2,000 to $2,499 | 167 (13.5%) | 61 (21.7%) |
| $2,500 to $2,999 | 220 (17.8%) | 16 (5.7%) |
| $3,000 or more | 419 (33.9%) | 13 (4.6%) |
| Total | 1,236 (100.0%) | 281 (100.0%) |
Physical Housing Characteristics in Mather
Housing Structures in Mather
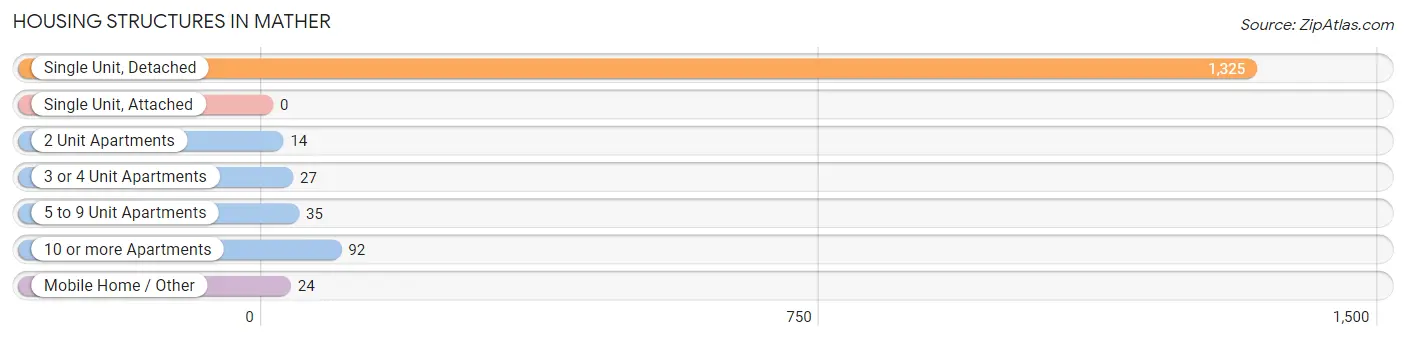
| Structure Type | # Housing Units | % Housing Units |
| Single Unit, Detached | 1,325 | 87.3% |
| Single Unit, Attached | 0 | 0.0% |
| 2 Unit Apartments | 14 | 0.9% |
| 3 or 4 Unit Apartments | 27 | 1.8% |
| 5 to 9 Unit Apartments | 35 | 2.3% |
| 10 or more Apartments | 92 | 6.1% |
| Mobile Home / Other | 24 | 1.6% |
| Total | 1,517 | 100.0% |
Housing Structures by Occupancy in Mather
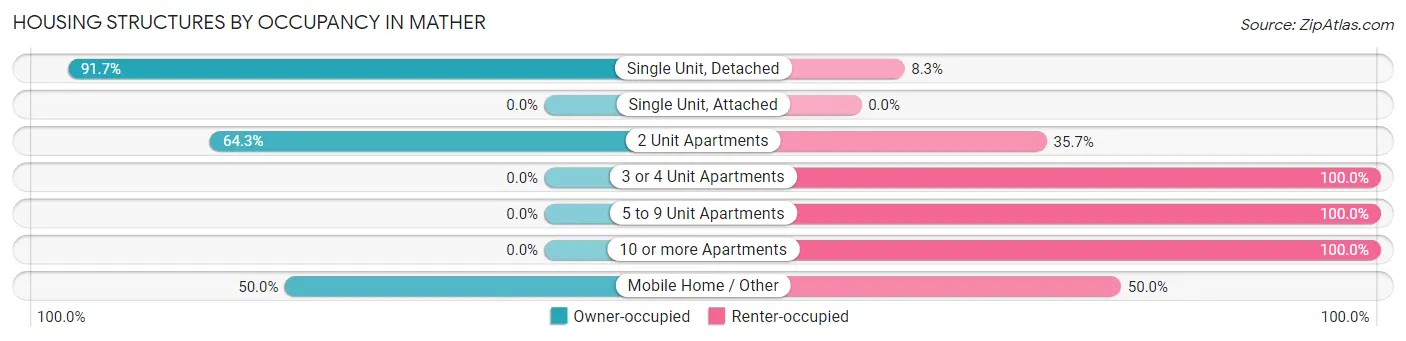
| Structure Type | Owner-occupied | Renter-occupied |
| Single Unit, Detached | 1,215 (91.7%) | 110 (8.3%) |
| Single Unit, Attached | 0 (0.0%) | 0 (0.0%) |
| 2 Unit Apartments | 9 (64.3%) | 5 (35.7%) |
| 3 or 4 Unit Apartments | 0 (0.0%) | 27 (100.0%) |
| 5 to 9 Unit Apartments | 0 (0.0%) | 35 (100.0%) |
| 10 or more Apartments | 0 (0.0%) | 92 (100.0%) |
| Mobile Home / Other | 12 (50.0%) | 12 (50.0%) |
| Total | 1,236 (81.5%) | 281 (18.5%) |
Housing Structures by Number of Rooms in Mather
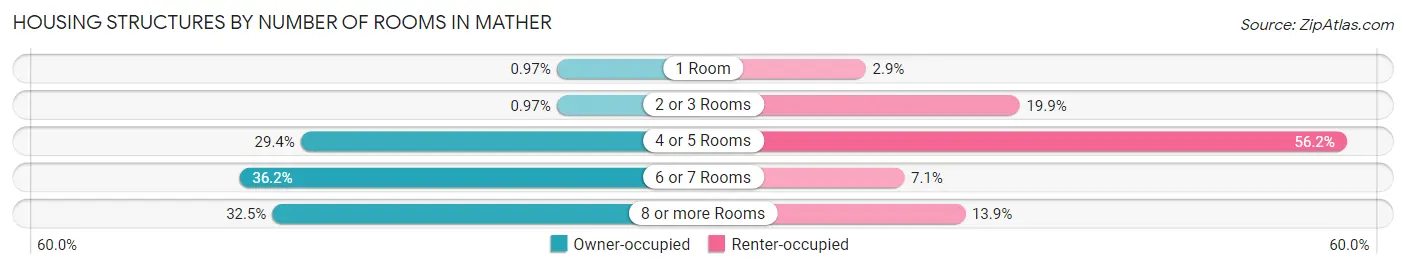
| Number of Rooms | Owner-occupied | Renter-occupied |
| 1 Room | 12 (1.0%) | 8 (2.9%) |
| 2 or 3 Rooms | 12 (1.0%) | 56 (19.9%) |
| 4 or 5 Rooms | 363 (29.4%) | 158 (56.2%) |
| 6 or 7 Rooms | 447 (36.2%) | 20 (7.1%) |
| 8 or more Rooms | 402 (32.5%) | 39 (13.9%) |
| Total | 1,236 (100.0%) | 281 (100.0%) |
Housing Structure by Heating Type in Mather
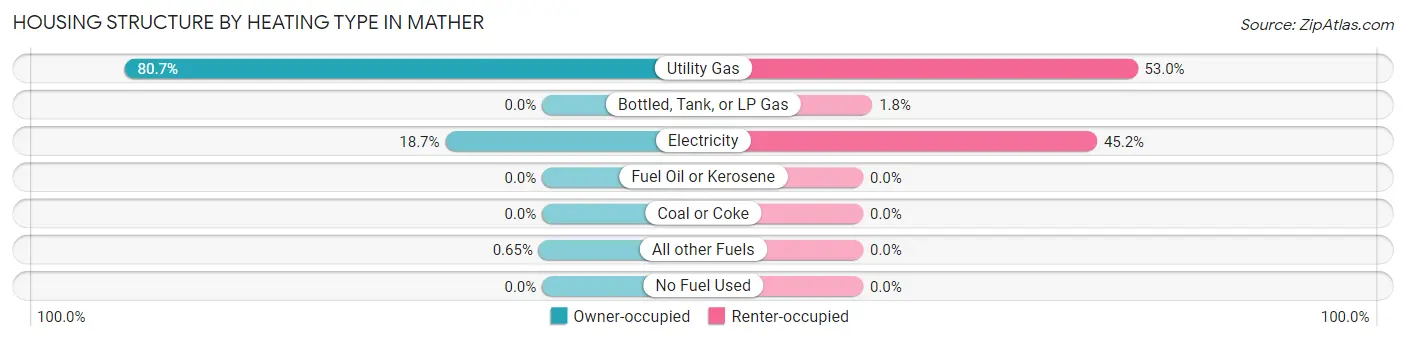
| Heating Type | Owner-occupied | Renter-occupied |
| Utility Gas | 997 (80.7%) | 149 (53.0%) |
| Bottled, Tank, or LP Gas | 0 (0.0%) | 5 (1.8%) |
| Electricity | 231 (18.7%) | 127 (45.2%) |
| Fuel Oil or Kerosene | 0 (0.0%) | 0 (0.0%) |
| Coal or Coke | 0 (0.0%) | 0 (0.0%) |
| All other Fuels | 8 (0.6%) | 0 (0.0%) |
| No Fuel Used | 0 (0.0%) | 0 (0.0%) |
| Total | 1,236 (100.0%) | 281 (100.0%) |
Household Vehicle Usage in Mather
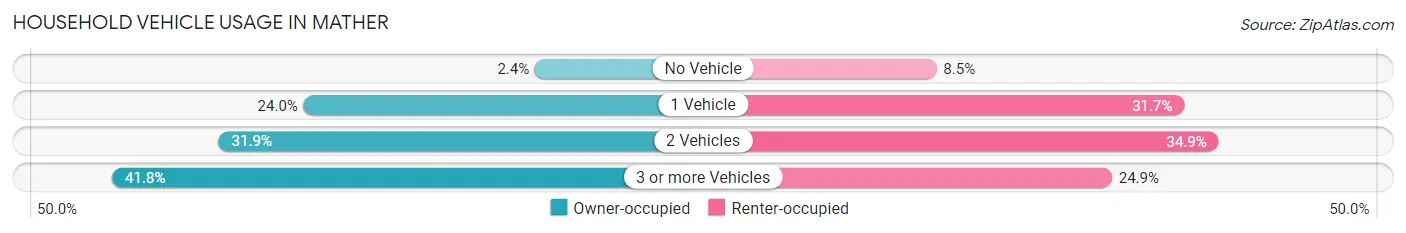
| Vehicles per Household | Owner-occupied | Renter-occupied |
| No Vehicle | 29 (2.4%) | 24 (8.5%) |
| 1 Vehicle | 296 (23.9%) | 89 (31.7%) |
| 2 Vehicles | 394 (31.9%) | 98 (34.9%) |
| 3 or more Vehicles | 517 (41.8%) | 70 (24.9%) |
| Total | 1,236 (100.0%) | 281 (100.0%) |
Real Estate & Mortgages in Mather
Real Estate and Mortgage Overview in Mather
| Characteristic | Without Mortgage | With Mortgage |
| Housing Units | 172 | 1,064 |
| Median Property Value | $576,500 | $522,200 |
| Median Household Income | - | - |
| Monthly Housing Costs | $923 | $419 |
| Real Estate Taxes | $4,809 | $0 |
Property Value by Mortgage Status in Mather
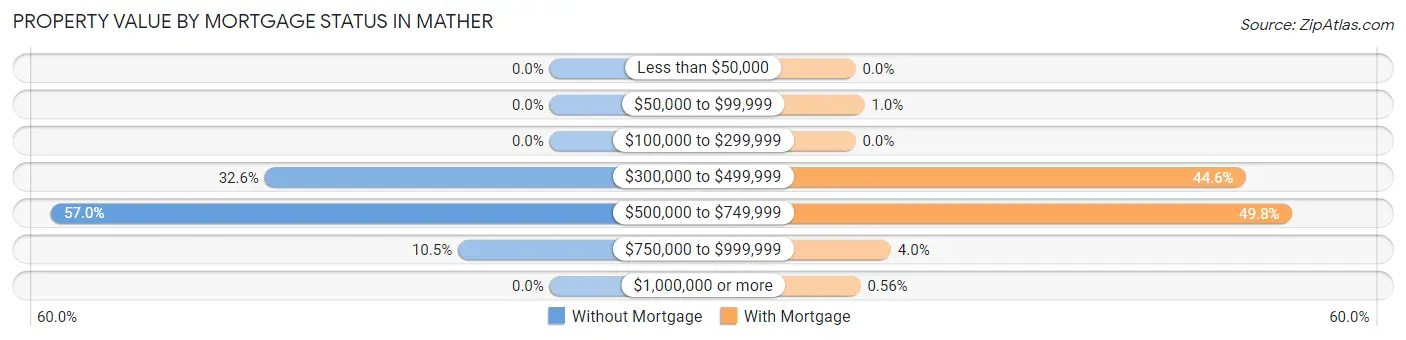
| Property Value | Without Mortgage | With Mortgage |
| Less than $50,000 | 0 (0.0%) | 0 (0.0%) |
| $50,000 to $99,999 | 0 (0.0%) | 11 (1.0%) |
| $100,000 to $299,999 | 0 (0.0%) | 0 (0.0%) |
| $300,000 to $499,999 | 56 (32.6%) | 474 (44.6%) |
| $500,000 to $749,999 | 98 (57.0%) | 530 (49.8%) |
| $750,000 to $999,999 | 18 (10.5%) | 43 (4.0%) |
| $1,000,000 or more | 0 (0.0%) | 6 (0.6%) |
| Total | 172 (100.0%) | 1,064 (100.0%) |
Household Income by Mortgage Status in Mather
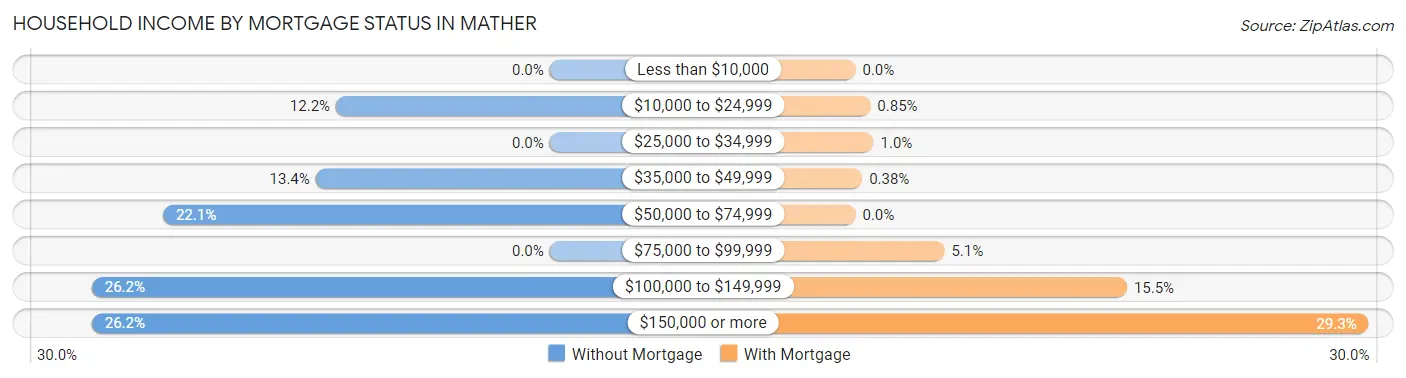
| Household Income | Without Mortgage | With Mortgage |
| Less than $10,000 | 0 (0.0%) | 0 (0.0%) |
| $10,000 to $24,999 | 21 (12.2%) | 9 (0.9%) |
| $25,000 to $34,999 | 0 (0.0%) | 11 (1.0%) |
| $35,000 to $49,999 | 23 (13.4%) | 4 (0.4%) |
| $50,000 to $74,999 | 38 (22.1%) | 0 (0.0%) |
| $75,000 to $99,999 | 0 (0.0%) | 54 (5.1%) |
| $100,000 to $149,999 | 45 (26.2%) | 165 (15.5%) |
| $150,000 or more | 45 (26.2%) | 312 (29.3%) |
| Total | 172 (100.0%) | 1,064 (100.0%) |
Property Value to Household Income Ratio in Mather
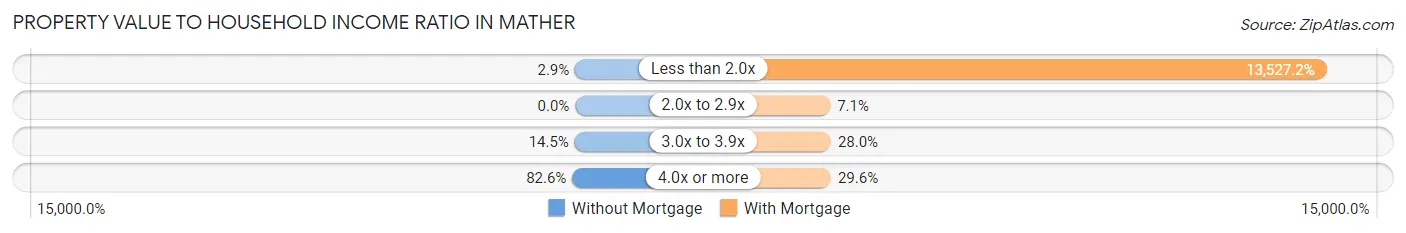
| Value-to-Income Ratio | Without Mortgage | With Mortgage |
| Less than 2.0x | 5 (2.9%) | 143,929 (13,527.2%) |
| 2.0x to 2.9x | 0 (0.0%) | 76 (7.1%) |
| 3.0x to 3.9x | 25 (14.5%) | 298 (28.0%) |
| 4.0x or more | 142 (82.6%) | 315 (29.6%) |
| Total | 172 (100.0%) | 1,064 (100.0%) |
Real Estate Taxes by Mortgage Status in Mather
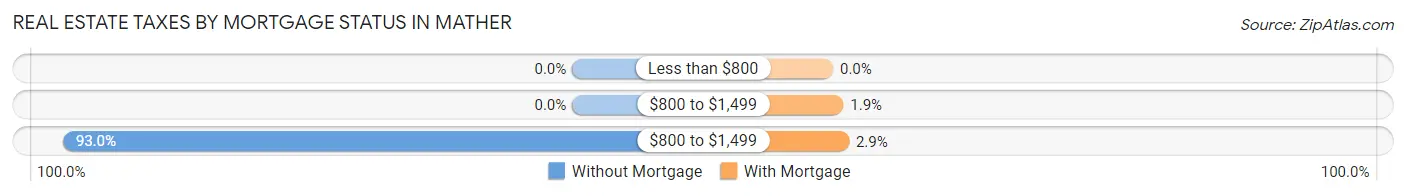
| Property Taxes | Without Mortgage | With Mortgage |
| Less than $800 | 0 (0.0%) | 0 (0.0%) |
| $800 to $1,499 | 0 (0.0%) | 20 (1.9%) |
| $800 to $1,499 | 160 (93.0%) | 31 (2.9%) |
| Total | 172 (100.0%) | 1,064 (100.0%) |
Health & Disability in Mather
Health Insurance Coverage by Age in Mather
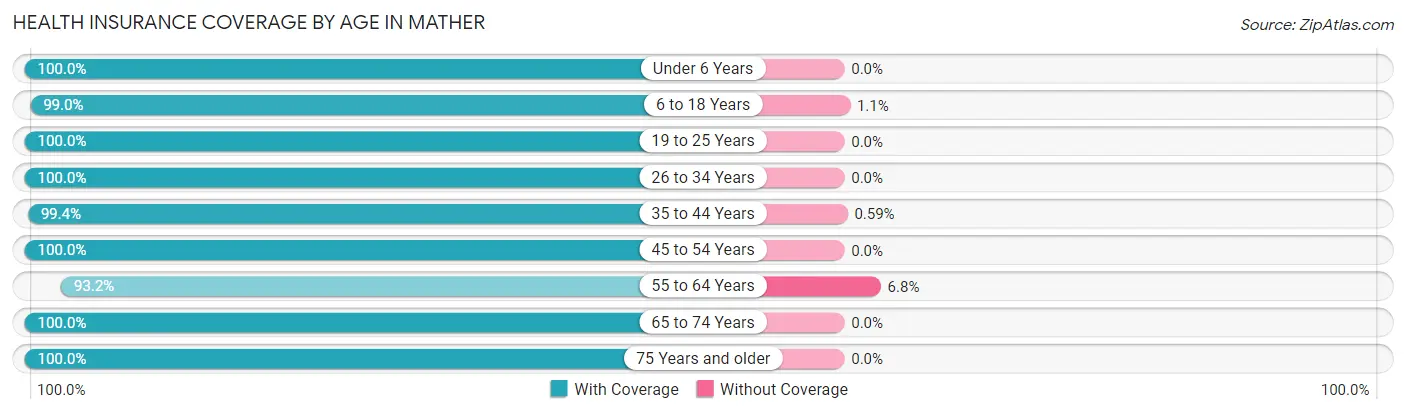
| Age Bracket | With Coverage | Without Coverage |
| Under 6 Years | 399 (100.0%) | 0 (0.0%) |
| 6 to 18 Years | 1,041 (99.0%) | 11 (1.1%) |
| 19 to 25 Years | 377 (100.0%) | 0 (0.0%) |
| 26 to 34 Years | 716 (100.0%) | 0 (0.0%) |
| 35 to 44 Years | 672 (99.4%) | 4 (0.6%) |
| 45 to 54 Years | 595 (100.0%) | 0 (0.0%) |
| 55 to 64 Years | 385 (93.2%) | 28 (6.8%) |
| 65 to 74 Years | 367 (100.0%) | 0 (0.0%) |
| 75 Years and older | 117 (100.0%) | 0 (0.0%) |
| Total | 4,669 (99.1%) | 43 (0.9%) |
Health Insurance Coverage by Citizenship Status in Mather
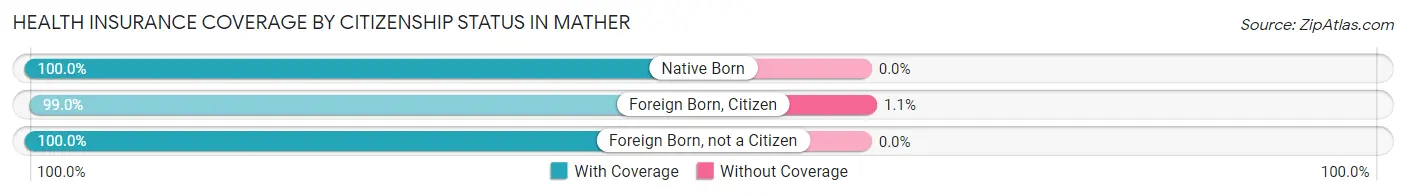
| Citizenship Status | With Coverage | Without Coverage |
| Native Born | 399 (100.0%) | 0 (0.0%) |
| Foreign Born, Citizen | 1,041 (99.0%) | 11 (1.1%) |
| Foreign Born, not a Citizen | 377 (100.0%) | 0 (0.0%) |
Health Insurance Coverage by Household Income in Mather
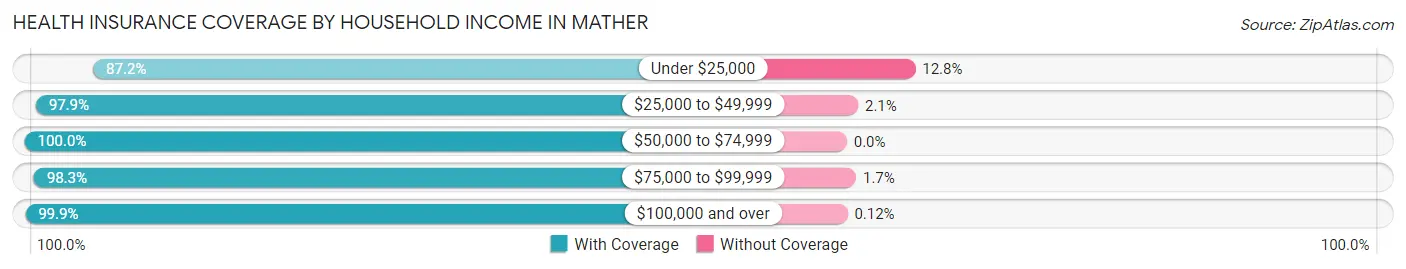
| Household Income | With Coverage | Without Coverage |
| Under $25,000 | 163 (87.2%) | 24 (12.8%) |
| $25,000 to $49,999 | 186 (97.9%) | 4 (2.1%) |
| $50,000 to $74,999 | 274 (100.0%) | 0 (0.0%) |
| $75,000 to $99,999 | 624 (98.3%) | 11 (1.7%) |
| $100,000 and over | 3,420 (99.9%) | 4 (0.1%) |
Public vs Private Health Insurance Coverage by Age in Mather
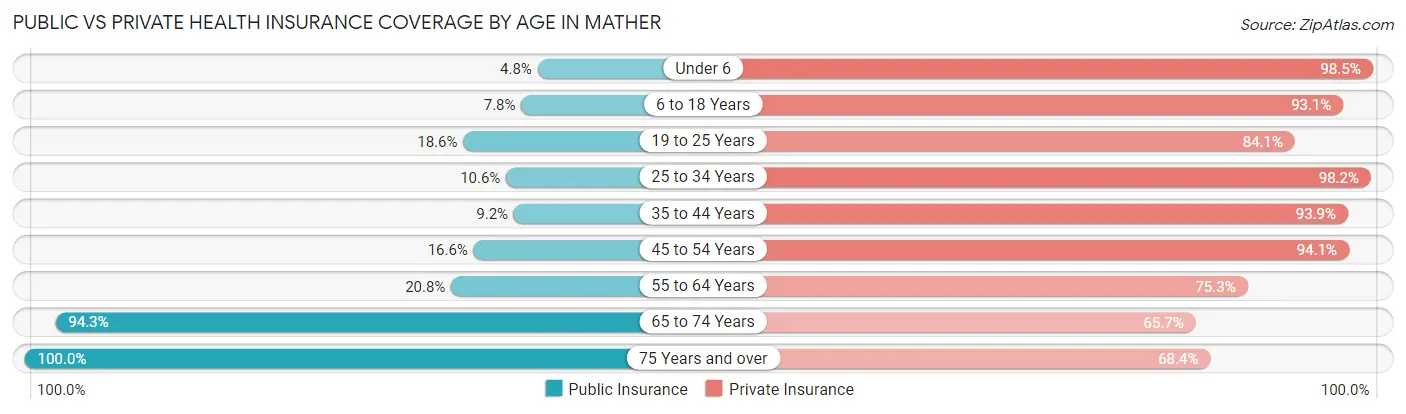
| Age Bracket | Public Insurance | Private Insurance |
| Under 6 | 19 (4.8%) | 393 (98.5%) |
| 6 to 18 Years | 82 (7.8%) | 979 (93.1%) |
| 19 to 25 Years | 70 (18.6%) | 317 (84.1%) |
| 25 to 34 Years | 76 (10.6%) | 703 (98.2%) |
| 35 to 44 Years | 62 (9.2%) | 635 (93.9%) |
| 45 to 54 Years | 99 (16.6%) | 560 (94.1%) |
| 55 to 64 Years | 86 (20.8%) | 311 (75.3%) |
| 65 to 74 Years | 346 (94.3%) | 241 (65.7%) |
| 75 Years and over | 117 (100.0%) | 80 (68.4%) |
| Total | 957 (20.3%) | 4,219 (89.5%) |
Disability Status by Sex by Age in Mather
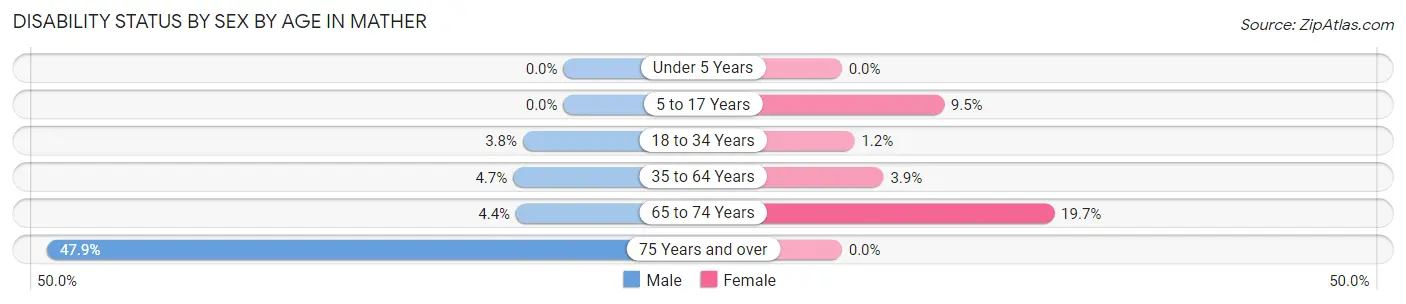
| Age Bracket | Male | Female |
| Under 5 Years | 0 (0.0%) | 0 (0.0%) |
| 5 to 17 Years | 0 (0.0%) | 55 (9.5%) |
| 18 to 34 Years | 20 (3.8%) | 7 (1.2%) |
| 35 to 64 Years | 40 (4.7%) | 32 (3.9%) |
| 65 to 74 Years | 7 (4.4%) | 41 (19.7%) |
| 75 Years and over | 23 (47.9%) | 0 (0.0%) |
Disability Class by Sex by Age in Mather
Disability Class: Hearing Difficulty
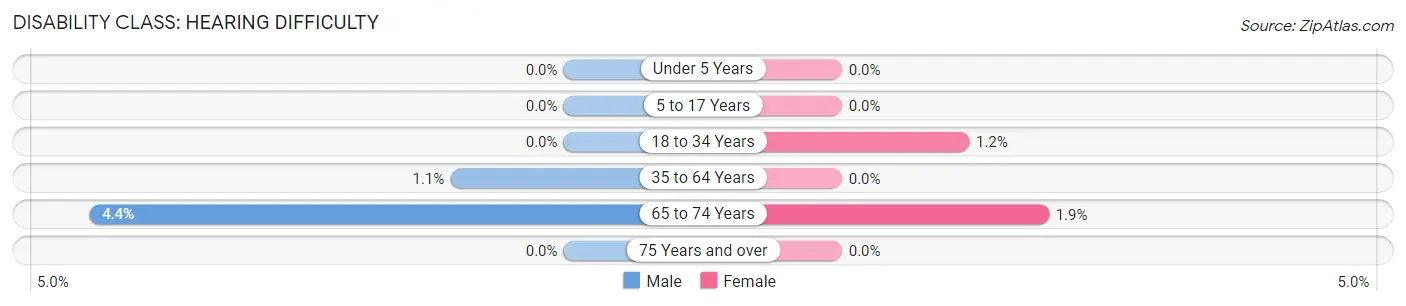
| Age Bracket | Male | Female |
| Under 5 Years | 0 (0.0%) | 0 (0.0%) |
| 5 to 17 Years | 0 (0.0%) | 0 (0.0%) |
| 18 to 34 Years | 0 (0.0%) | 7 (1.2%) |
| 35 to 64 Years | 9 (1.1%) | 0 (0.0%) |
| 65 to 74 Years | 7 (4.4%) | 4 (1.9%) |
| 75 Years and over | 0 (0.0%) | 0 (0.0%) |
Disability Class: Vision Difficulty
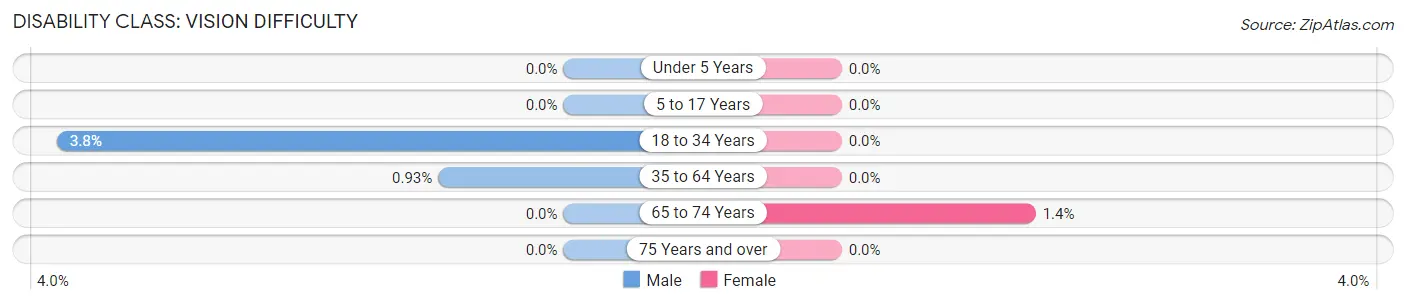
| Age Bracket | Male | Female |
| Under 5 Years | 0 (0.0%) | 0 (0.0%) |
| 5 to 17 Years | 0 (0.0%) | 0 (0.0%) |
| 18 to 34 Years | 20 (3.8%) | 0 (0.0%) |
| 35 to 64 Years | 8 (0.9%) | 0 (0.0%) |
| 65 to 74 Years | 0 (0.0%) | 3 (1.4%) |
| 75 Years and over | 0 (0.0%) | 0 (0.0%) |
Disability Class: Cognitive Difficulty
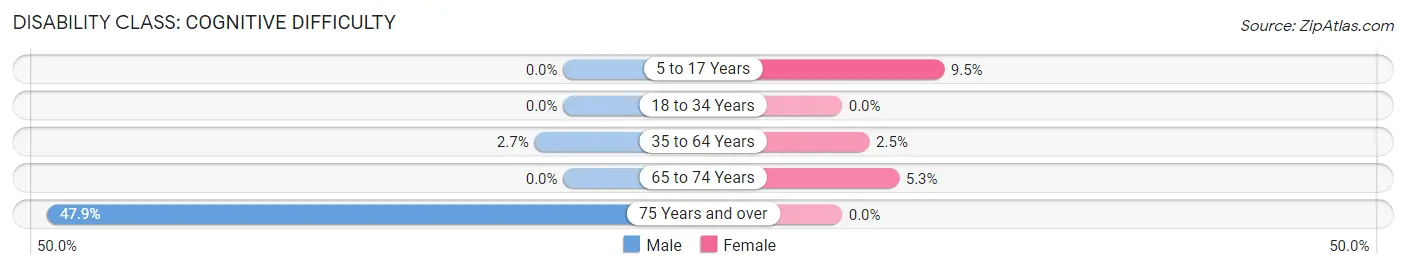
| Age Bracket | Male | Female |
| 5 to 17 Years | 0 (0.0%) | 55 (9.5%) |
| 18 to 34 Years | 0 (0.0%) | 0 (0.0%) |
| 35 to 64 Years | 23 (2.7%) | 21 (2.5%) |
| 65 to 74 Years | 0 (0.0%) | 11 (5.3%) |
| 75 Years and over | 23 (47.9%) | 0 (0.0%) |
Disability Class: Ambulatory Difficulty
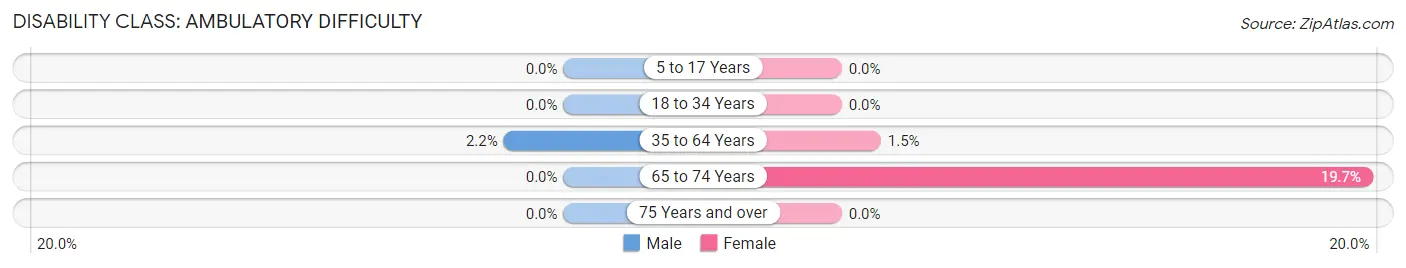
| Age Bracket | Male | Female |
| 5 to 17 Years | 0 (0.0%) | 0 (0.0%) |
| 18 to 34 Years | 0 (0.0%) | 0 (0.0%) |
| 35 to 64 Years | 19 (2.2%) | 12 (1.5%) |
| 65 to 74 Years | 0 (0.0%) | 41 (19.7%) |
| 75 Years and over | 0 (0.0%) | 0 (0.0%) |
Disability Class: Self-Care Difficulty
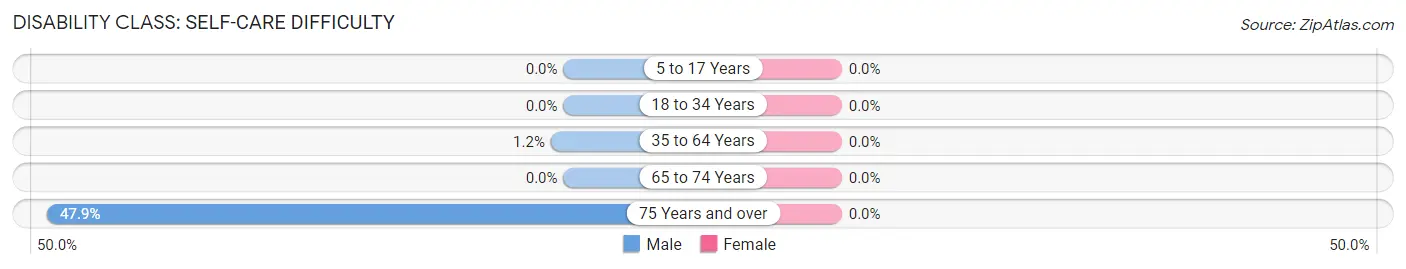
| Age Bracket | Male | Female |
| 5 to 17 Years | 0 (0.0%) | 0 (0.0%) |
| 18 to 34 Years | 0 (0.0%) | 0 (0.0%) |
| 35 to 64 Years | 10 (1.2%) | 0 (0.0%) |
| 65 to 74 Years | 0 (0.0%) | 0 (0.0%) |
| 75 Years and over | 23 (47.9%) | 0 (0.0%) |
Technology Access in Mather
Computing Device Access in Mather
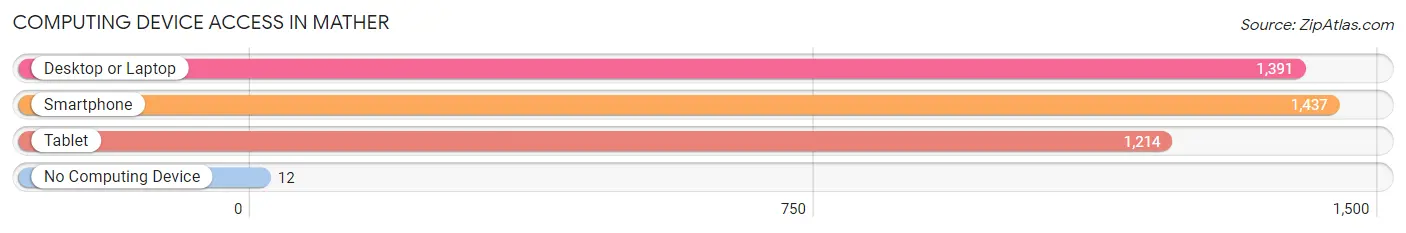
| Device Type | # Households | % Households |
| Desktop or Laptop | 1,391 | 91.7% |
| Smartphone | 1,437 | 94.7% |
| Tablet | 1,214 | 80.0% |
| No Computing Device | 12 | 0.8% |
| Total | 1,517 | 100.0% |
Internet Access in Mather
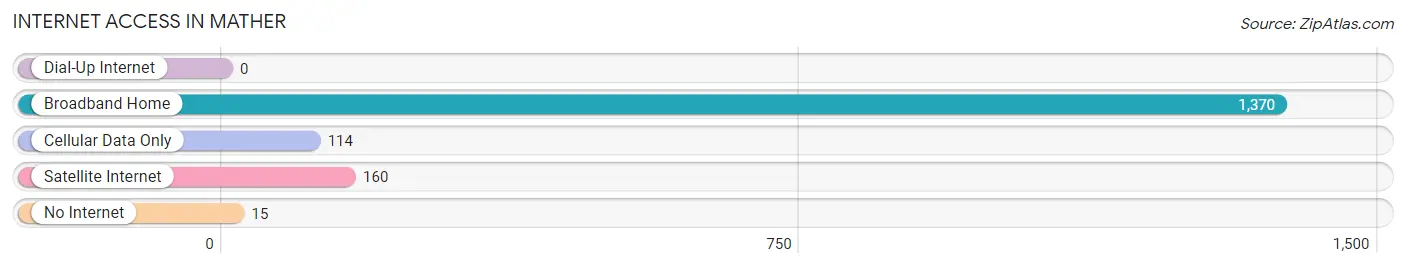
| Internet Type | # Households | % Households |
| Dial-Up Internet | 0 | 0.0% |
| Broadband Home | 1,370 | 90.3% |
| Cellular Data Only | 114 | 7.5% |
| Satellite Internet | 160 | 10.5% |
| No Internet | 15 | 1.0% |
| Total | 1,517 | 100.0% |
Mather Summary
Mather is a census-designated place located in Sacramento County, California. It is situated in the northern part of the county, approximately 20 miles northeast of the state capital, Sacramento. The population of Mather was 8,451 at the 2010 census.
History
Mather was originally inhabited by the Maidu Indians, who lived in the area for thousands of years before the arrival of Europeans. The first Europeans to settle in the area were Spanish missionaries, who established a mission in the area in 1808. The mission was abandoned in 1834, and the area was subsequently settled by ranchers and farmers.
In the early 1900s, the area was developed as a military base, and the Mather Air Force Base was established in 1942. The base was used as a training facility for pilots during World War II, and was later used as a base for the Strategic Air Command. The base was closed in 1993, and the land was subsequently developed into a residential community.
Geography
Mather is located at 38°37'25"N 121°17'45"W (38.623750, -121.295833). It is situated in the northern part of Sacramento County, approximately 20 miles northeast of the state capital, Sacramento. The area is mostly flat, with an elevation of approximately 200 feet above sea level.
The climate in Mather is classified as Mediterranean, with hot, dry summers and mild, wet winters. The average annual temperature is approximately 64°F, and the average annual precipitation is approximately 18 inches.
Economy
The economy of Mather is largely based on the service sector, with the majority of the population employed in retail, healthcare, and education. The Mather Air Force Base, which closed in 1993, is now home to a variety of businesses, including a shopping center, a golf course, and a hotel.
The Mather Business Park is also located in the area, and is home to a variety of businesses, including a medical center, a technology park, and a research and development center.
Demographics
As of the 2010 census, the population of Mather was 8,451. The racial makeup of the population was 65.3% White, 11.2% African American, 0.7% Native American, 8.2% Asian, 0.2% Pacific Islander, and 14.6% from other races. The median household income was $63,945, and the median family income was $71,945.
The population of Mather is largely educated, with approximately 90% of the population having at least a high school diploma, and approximately 40% having a bachelor's degree or higher. The unemployment rate in Mather is approximately 5.2%, which is lower than the national average.
Common Questions
What is Per Capita Income in Mather?
Per Capita income in Mather is $45,190.
What is the Median Family Income in Mather?
Median Family Income in Mather is $137,474.
What is the Median Household income in Mather?
Median Household Income in Mather is $135,329.
What is Income or Wage Gap in Mather?
Income or Wage Gap in Mather is 45.2%.
Women in Mather earn 54.8 cents for every dollar earned by a man.
What is Inequality or Gini Index in Mather?
Inequality or Gini Index in Mather is 0.34.
What is the Total Population of Mather?
Total Population of Mather is 4,712.
What is the Total Male Population of Mather?
Total Male Population of Mather is 2,145.
What is the Total Female Population of Mather?
Total Female Population of Mather is 2,567.
What is the Ratio of Males per 100 Females in Mather?
There are 83.56 Males per 100 Females in Mather.
What is the Ratio of Females per 100 Males in Mather?
There are 119.67 Females per 100 Males in Mather.
What is the Median Population Age in Mather?
Median Population Age in Mather is 33.4 Years.
What is the Average Family Size in Mather
Average Family Size in Mather is 3.4 People.
What is the Average Household Size in Mather
Average Household Size in Mather is 3.1 People.
How Large is the Labor Force in Mather?
There are 2,422 People in the Labor Forcein in Mather.
What is the Percentage of People in the Labor Force in Mather?
70.1% of People are in the Labor Force in Mather.
What is the Unemployment Rate in Mather?
Unemployment Rate in Mather is 1.3%.