Cities with the Lowest Poverty Level Among Seniors Over the Age of 65 in Indiana
RELATED REPORTS & OPTIONS
Lowest Poverty | Seniors 65+
Indiana
Compare Cities
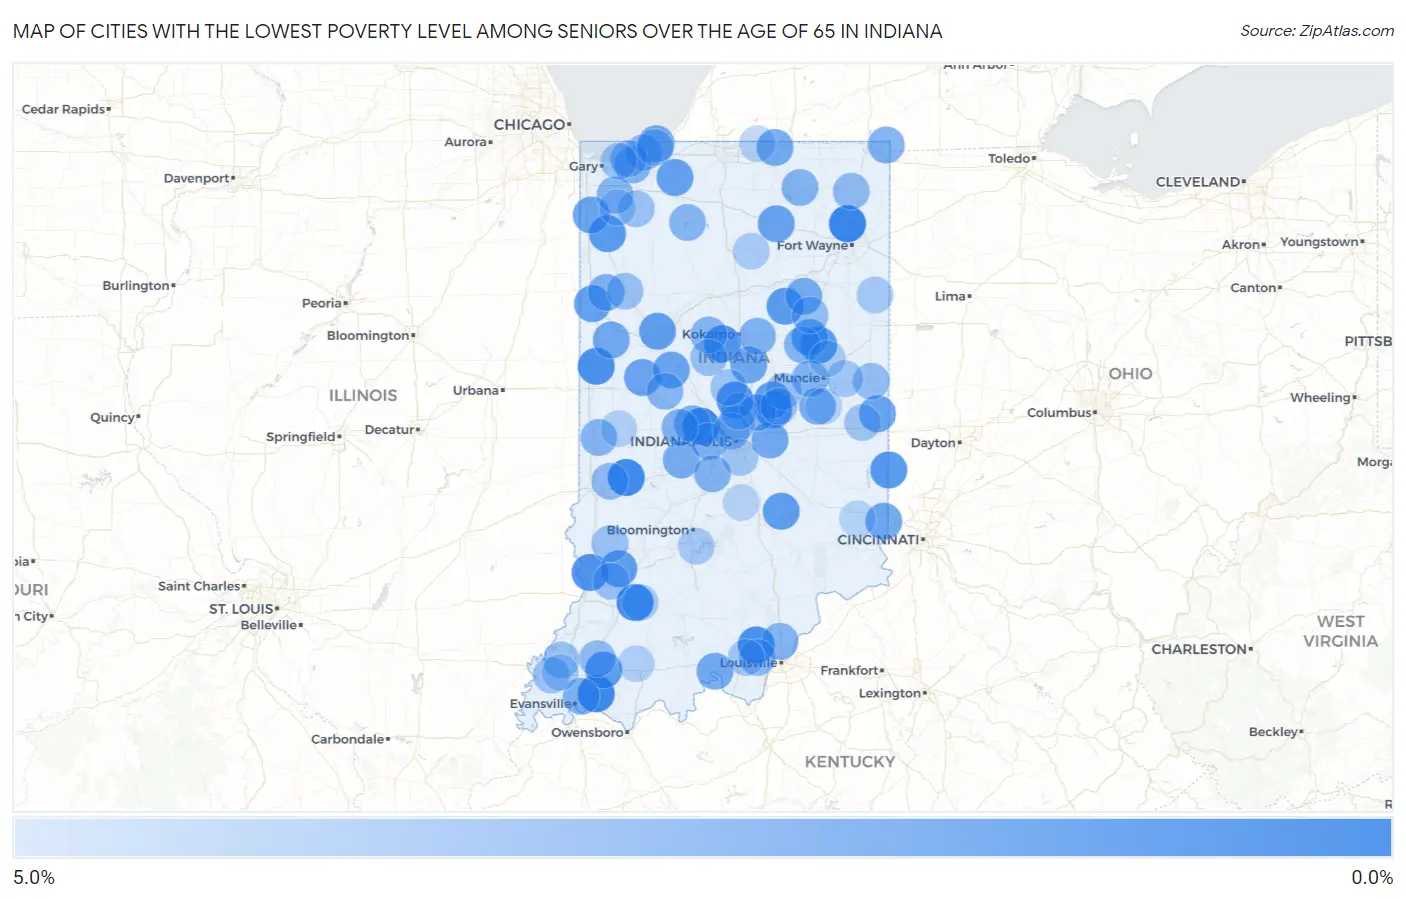
Map of Cities with the Lowest Poverty Level Among Seniors Over the Age of 65 in Indiana
5.0%
0.0%
Cities with the Lowest Poverty Level Among Seniors Over the Age of 65 in Indiana
| City | Senior Poverty | vs State | vs National | |
| 1. | Huntertown | 0.13% | 8.1%(-8.02)#1 | 10.0%(-9.82)#5 |
| 2. | Pittsboro | 0.22% | 8.1%(-7.93)#2 | 10.0%(-9.73)#20 |
| 3. | Chandler | 0.24% | 8.1%(-7.91)#3 | 10.0%(-9.71)#29 |
| 4. | Brazil | 0.43% | 8.1%(-7.72)#4 | 10.0%(-9.53)#65 |
| 5. | Montgomery | 0.47% | 8.1%(-7.68)#5 | 10.0%(-9.49)#78 |
| 6. | Greenville | 0.69% | 8.1%(-7.46)#6 | 10.0%(-9.26)#137 |
| 7. | West Lebanon | 0.70% | 8.1%(-7.45)#7 | 10.0%(-9.25)#140 |
| 8. | Westfield | 0.77% | 8.1%(-7.38)#8 | 10.0%(-9.18)#168 |
| 9. | Ingalls | 0.83% | 8.1%(-7.32)#9 | 10.0%(-9.12)#192 |
| 10. | Oaktown | 0.87% | 8.1%(-7.28)#10 | 10.0%(-9.08)#208 |
| 11. | Russiaville | 0.92% | 8.1%(-7.23)#11 | 10.0%(-9.03)#235 |
| 12. | West College Corner | 1.0% | 8.1%(-7.14)#12 | 10.0%(-8.94)#286 |
| 13. | Shamrock Lakes | 1.1% | 8.1%(-7.00)#13 | 10.0%(-8.80)#373 |
| 14. | Roselawn | 1.2% | 8.1%(-6.99)#14 | 10.0%(-8.79)#381 |
| 15. | La Fontaine | 1.2% | 8.1%(-6.99)#15 | 10.0%(-8.79)#384 |
| 16. | Lynnville | 1.3% | 8.1%(-6.88)#16 | 10.0%(-8.68)#465 |
| 17. | Hope | 1.3% | 8.1%(-6.87)#17 | 10.0%(-8.67)#473 |
| 18. | Lapel | 1.3% | 8.1%(-6.83)#18 | 10.0%(-8.63)#512 |
| 19. | Battle Ground | 1.3% | 8.1%(-6.80)#19 | 10.0%(-8.60)#540 |
| 20. | Sandborn | 1.4% | 8.1%(-6.76)#20 | 10.0%(-8.56)#568 |
| 21. | Kingsbury | 1.5% | 8.1%(-6.66)#21 | 10.0%(-8.46)#645 |
| 22. | Earl Park | 1.6% | 8.1%(-6.56)#22 | 10.0%(-8.36)#715 |
| 23. | Winona Lake | 1.6% | 8.1%(-6.54)#23 | 10.0%(-8.34)#737 |
| 24. | New Richmond | 1.6% | 8.1%(-6.51)#24 | 10.0%(-8.31)#760 |
| 25. | Clarks Hill | 1.7% | 8.1%(-6.46)#25 | 10.0%(-8.26)#804 |
| 26. | Fountain City | 1.7% | 8.1%(-6.44)#26 | 10.0%(-8.24)#828 |
| 27. | Lowell | 1.7% | 8.1%(-6.44)#27 | 10.0%(-8.24)#831 |
| 28. | Upland | 1.7% | 8.1%(-6.43)#28 | 10.0%(-8.23)#833 |
| 29. | Floyds Knobs | 1.8% | 8.1%(-6.38)#29 | 10.0%(-8.18)#881 |
| 30. | Bright | 1.8% | 8.1%(-6.32)#30 | 10.0%(-8.12)#926 |
| 31. | Tipton | 1.8% | 8.1%(-6.31)#31 | 10.0%(-8.11)#944 |
| 32. | Pine Village | 1.9% | 8.1%(-6.26)#32 | 10.0%(-8.06)#980 |
| 33. | Spring Lake | 1.9% | 8.1%(-6.25)#33 | 10.0%(-8.05)#994 |
| 34. | Leavenworth | 1.9% | 8.1%(-6.23)#34 | 10.0%(-8.03)#1,012 |
| 35. | Bristol | 2.0% | 8.1%(-6.18)#35 | 10.0%(-7.99)#1,066 |
| 36. | Long Beach | 2.0% | 8.1%(-6.18)#36 | 10.0%(-7.98)#1,072 |
| 37. | Mount Etna | 2.0% | 8.1%(-6.11)#37 | 10.0%(-7.91)#1,130 |
| 38. | Sulphur Springs | 2.1% | 8.1%(-6.09)#38 | 10.0%(-7.89)#1,153 |
| 39. | Stilesville | 2.1% | 8.1%(-6.07)#39 | 10.0%(-7.87)#1,179 |
| 40. | Clear Lake | 2.2% | 8.1%(-5.95)#40 | 10.0%(-7.75)#1,280 |
| 41. | Goodland | 2.2% | 8.1%(-5.94)#41 | 10.0%(-7.74)#1,287 |
| 42. | Lizton | 2.2% | 8.1%(-5.93)#42 | 10.0%(-7.73)#1,296 |
| 43. | Avon | 2.3% | 8.1%(-5.88)#43 | 10.0%(-7.68)#1,347 |
| 44. | Melody Hill | 2.3% | 8.1%(-5.86)#44 | 10.0%(-7.66)#1,373 |
| 45. | Greentown | 2.3% | 8.1%(-5.83)#45 | 10.0%(-7.63)#1,392 |
| 46. | Chesterton | 2.3% | 8.1%(-5.83)#46 | 10.0%(-7.63)#1,395 |
| 47. | North Salem | 2.3% | 8.1%(-5.82)#47 | 10.0%(-7.63)#1,401 |
| 48. | Brooklyn | 2.4% | 8.1%(-5.78)#48 | 10.0%(-7.58)#1,452 |
| 49. | Ligonier | 2.4% | 8.1%(-5.74)#49 | 10.0%(-7.55)#1,497 |
| 50. | Fowlerton | 2.5% | 8.1%(-5.65)#50 | 10.0%(-7.45)#1,592 |
| 51. | Yorktown | 2.5% | 8.1%(-5.64)#51 | 10.0%(-7.44)#1,606 |
| 52. | Sellersburg | 2.5% | 8.1%(-5.63)#52 | 10.0%(-7.43)#1,612 |
| 53. | Burlington | 2.5% | 8.1%(-5.63)#53 | 10.0%(-7.43)#1,619 |
| 54. | Bass Lake | 2.5% | 8.1%(-5.62)#54 | 10.0%(-7.42)#1,629 |
| 55. | Meridian Hills | 2.5% | 8.1%(-5.61)#55 | 10.0%(-7.42)#1,634 |
| 56. | Montezuma | 2.5% | 8.1%(-5.61)#56 | 10.0%(-7.41)#1,639 |
| 57. | Lakes Of The Four Seasons | 2.6% | 8.1%(-5.55)#57 | 10.0%(-7.35)#1,698 |
| 58. | Fishers | 2.6% | 8.1%(-5.55)#58 | 10.0%(-7.35)#1,705 |
| 59. | Darlington | 2.6% | 8.1%(-5.55)#59 | 10.0%(-7.35)#1,710 |
| 60. | Foxcliff Estates | 2.6% | 8.1%(-5.52)#60 | 10.0%(-7.33)#1,729 |
| 61. | Seelyville | 2.8% | 8.1%(-5.37)#61 | 10.0%(-7.17)#1,905 |
| 62. | Beverly Shores | 2.8% | 8.1%(-5.37)#62 | 10.0%(-7.17)#1,906 |
| 63. | Corunna | 2.8% | 8.1%(-5.37)#63 | 10.0%(-7.17)#1,917 |
| 64. | Dune Acres | 2.8% | 8.1%(-5.35)#64 | 10.0%(-7.15)#1,935 |
| 65. | Georgetown | 2.8% | 8.1%(-5.32)#65 | 10.0%(-7.12)#1,960 |
| 66. | Somerville | 2.9% | 8.1%(-5.29)#66 | 10.0%(-7.09)#2,006 |
| 67. | Winchester | 3.0% | 8.1%(-5.18)#67 | 10.0%(-6.98)#2,150 |
| 68. | Van Buren | 3.0% | 8.1%(-5.12)#68 | 10.0%(-6.92)#2,207 |
| 69. | Wynnedale | 3.0% | 8.1%(-5.12)#69 | 10.0%(-6.92)#2,218 |
| 70. | Michigantown | 3.1% | 8.1%(-5.07)#70 | 10.0%(-6.87)#2,272 |
| 71. | Pottawattamie Park | 3.1% | 8.1%(-5.07)#71 | 10.0%(-6.87)#2,276 |
| 72. | Kouts | 3.1% | 8.1%(-5.06)#72 | 10.0%(-6.86)#2,288 |
| 73. | Remington | 3.1% | 8.1%(-5.05)#73 | 10.0%(-6.86)#2,297 |
| 74. | Owensville | 3.1% | 8.1%(-5.02)#74 | 10.0%(-6.83)#2,330 |
| 75. | Dugger | 3.1% | 8.1%(-5.02)#75 | 10.0%(-6.83)#2,334 |
| 76. | Edwardsport | 3.1% | 8.1%(-5.02)#76 | 10.0%(-6.83)#2,339 |
| 77. | Edgewood | 3.2% | 8.1%(-4.97)#77 | 10.0%(-6.77)#2,409 |
| 78. | Poseyville | 3.2% | 8.1%(-4.94)#78 | 10.0%(-6.74)#2,447 |
| 79. | Carmel | 3.2% | 8.1%(-4.92)#79 | 10.0%(-6.72)#2,483 |
| 80. | Sheridan | 3.3% | 8.1%(-4.89)#80 | 10.0%(-6.69)#2,515 |
| 81. | Ogden Dunes | 3.3% | 8.1%(-4.88)#81 | 10.0%(-6.68)#2,533 |
| 82. | Greens Fork | 3.3% | 8.1%(-4.82)#82 | 10.0%(-6.62)#2,624 |
| 83. | Parker City | 3.4% | 8.1%(-4.76)#83 | 10.0%(-6.56)#2,698 |
| 84. | Pendleton | 3.4% | 8.1%(-4.74)#84 | 10.0%(-6.54)#2,727 |
| 85. | Southport | 3.4% | 8.1%(-4.71)#85 | 10.0%(-6.51)#2,767 |
| 86. | Crandall | 3.4% | 8.1%(-4.70)#86 | 10.0%(-6.50)#2,796 |
| 87. | Smithville Sanders | 3.5% | 8.1%(-4.65)#87 | 10.0%(-6.45)#2,848 |
| 88. | Monroe | 3.5% | 8.1%(-4.64)#88 | 10.0%(-6.44)#2,863 |
| 89. | Cannelburg | 3.5% | 8.1%(-4.64)#89 | 10.0%(-6.44)#2,868 |
| 90. | Akron | 3.6% | 8.1%(-4.53)#90 | 10.0%(-6.33)#3,040 |
| 91. | Eaton | 3.7% | 8.1%(-4.46)#91 | 10.0%(-6.26)#3,117 |
| 92. | Cynthiana | 3.7% | 8.1%(-4.45)#92 | 10.0%(-6.25)#3,138 |
| 93. | Hebron | 3.7% | 8.1%(-4.41)#93 | 10.0%(-6.21)#3,193 |
| 94. | Holland | 3.8% | 8.1%(-4.34)#94 | 10.0%(-6.14)#3,272 |
| 95. | Marshall | 3.8% | 8.1%(-4.30)#95 | 10.0%(-6.11)#3,335 |
| 96. | Canton | 3.8% | 8.1%(-4.30)#96 | 10.0%(-6.11)#3,341 |
| 97. | Simonton Lake | 3.9% | 8.1%(-4.23)#97 | 10.0%(-6.03)#3,419 |
| 98. | Sunman | 4.0% | 8.1%(-4.18)#98 | 10.0%(-5.98)#3,491 |
| 99. | Mount Summit | 4.0% | 8.1%(-4.15)#99 | 10.0%(-5.95)#3,544 |
| 100. | Prince S Lakes | 4.0% | 8.1%(-4.13)#100 | 10.0%(-5.93)#3,585 |
Common Questions
What are the Top 10 Cities with the Lowest Poverty Level Among Seniors Over the Age of 65 in Indiana?
Top 10 Cities with the Lowest Poverty Level Among Seniors Over the Age of 65 in Indiana are:
#1
0.13%
#2
0.22%
#3
0.24%
#4
0.43%
#5
0.47%
#6
0.69%
#7
0.70%
#8
0.77%
#9
0.83%
#10
0.87%
What city has the Lowest Poverty Level Among Seniors Over the Age of 65 in Indiana?
Huntertown has the Lowest Poverty Level Among Seniors Over the Age of 65 in Indiana with 0.13%.
What is the Poverty Level Among Seniors Over the Age of 65 in the State of Indiana?
Poverty Level Among Seniors Over the Age of 65 in Indiana is 8.1%.
What is the Poverty Level Among Seniors Over the Age of 65 in the United States?
Poverty Level Among Seniors Over the Age of 65 in the United States is 10.0%.