Broadmoor, CA Map & Demographics
Broadmoor Map
Broadmoor Overview
$53,654
PER CAPITA INCOME
$156,326
AVG FAMILY INCOME
$155,137
AVG HOUSEHOLD INCOME
16.9%
WAGE / INCOME GAP [ % ]
83.1¢/ $1
WAGE / INCOME GAP [ $ ]
0.36
INEQUALITY / GINI INDEX
4,419
TOTAL POPULATION
2,322
MALE POPULATION
2,097
FEMALE POPULATION
110.73
MALES / 100 FEMALES
90.31
FEMALES / 100 MALES
41.2
MEDIAN AGE
3.6
AVG FAMILY SIZE
3.2
AVG HOUSEHOLD SIZE
2,549
LABOR FORCE [ PEOPLE ]
72.6%
PERCENT IN LABOR FORCE
4.9%
UNEMPLOYMENT RATE
Income in Broadmoor
Income Overview in Broadmoor
Per Capita Income in Broadmoor is $53,654, while median incomes of families and households are $156,326 and $155,137 respectively.
| Characteristic | Number | Measure |
| Per Capita Income | 4,419 | $53,654 |
| Median Family Income | 1,062 | $156,326 |
| Mean Family Income | 1,062 | $177,273 |
| Median Household Income | 1,349 | $155,137 |
| Mean Household Income | 1,349 | $165,825 |
| Income Deficit | 1,062 | $0 |
| Wage / Income Gap (%) | 4,419 | 16.85% |
| Wage / Income Gap ($) | 4,419 | 83.15¢ per $1 |
| Gini / Inequality Index | 4,419 | 0.36 |
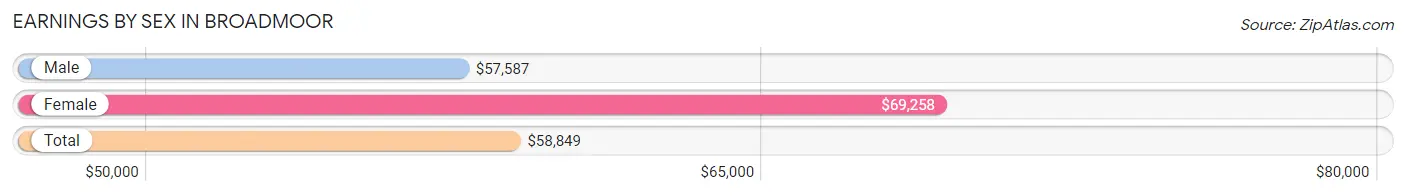
Earnings by Sex in Broadmoor
Average Earnings in Broadmoor are $58,849, $57,587 for men and $69,258 for women, a difference of 16.9%.
| Sex | Number | Average Earnings |
| Male | 1,498 (58.0%) | $57,587 |
| Female | 1,085 (42.0%) | $69,258 |
| Total | 2,583 (100.0%) | $58,849 |
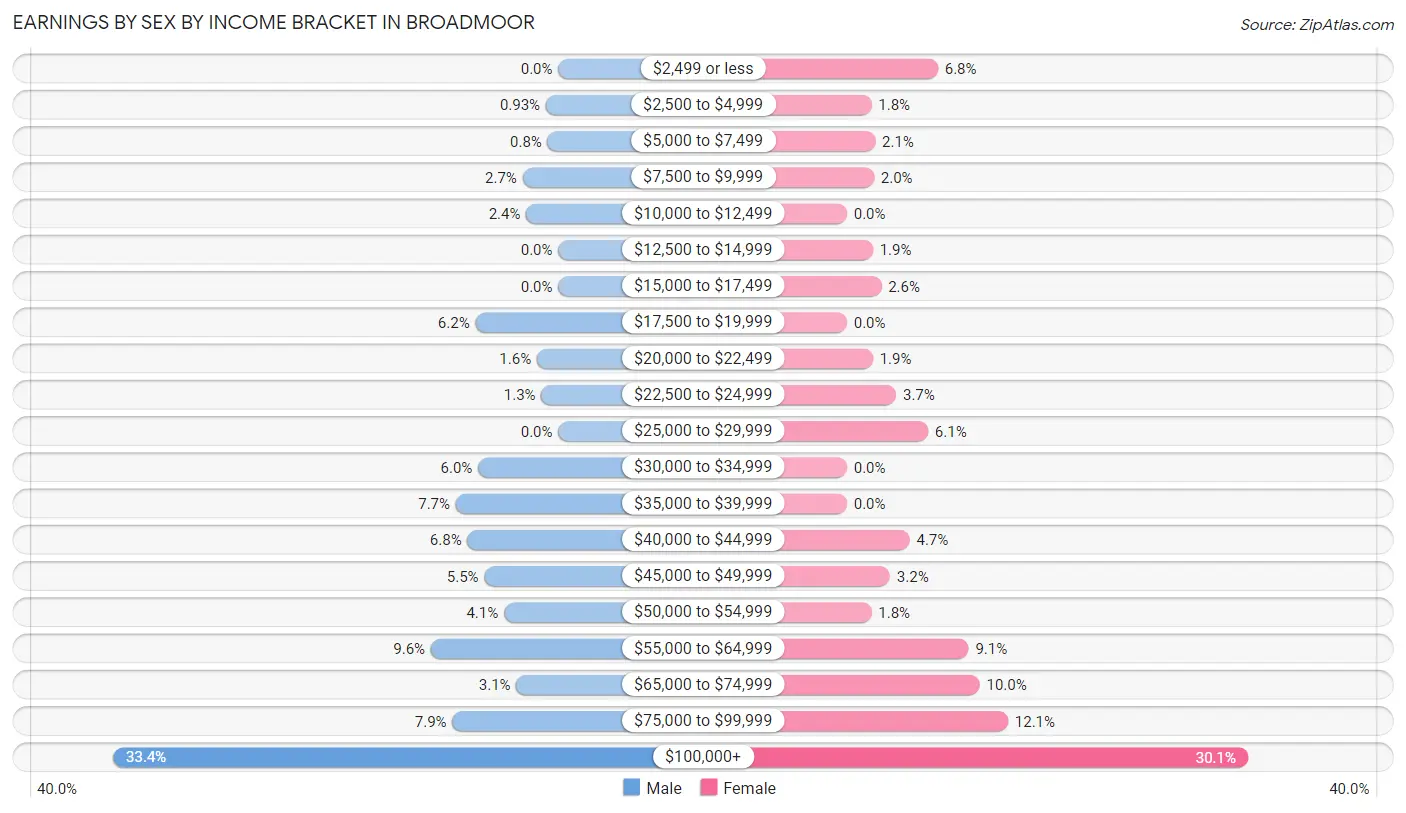
Earnings by Sex by Income Bracket in Broadmoor
The most common earnings brackets in Broadmoor are $100,000+ for men (500 | 33.4%) and $100,000+ for women (326 | 30.0%).
| Income | Male | Female |
| $2,499 or less | 0 (0.0%) | 74 (6.8%) |
| $2,500 to $4,999 | 14 (0.9%) | 20 (1.8%) |
| $5,000 to $7,499 | 12 (0.8%) | 23 (2.1%) |
| $7,500 to $9,999 | 40 (2.7%) | 22 (2.0%) |
| $10,000 to $12,499 | 36 (2.4%) | 0 (0.0%) |
| $12,500 to $14,999 | 0 (0.0%) | 21 (1.9%) |
| $15,000 to $17,499 | 0 (0.0%) | 28 (2.6%) |
| $17,500 to $19,999 | 93 (6.2%) | 0 (0.0%) |
| $20,000 to $22,499 | 24 (1.6%) | 21 (1.9%) |
| $22,500 to $24,999 | 19 (1.3%) | 40 (3.7%) |
| $25,000 to $29,999 | 0 (0.0%) | 66 (6.1%) |
| $30,000 to $34,999 | 90 (6.0%) | 0 (0.0%) |
| $35,000 to $39,999 | 115 (7.7%) | 0 (0.0%) |
| $40,000 to $44,999 | 102 (6.8%) | 51 (4.7%) |
| $45,000 to $49,999 | 83 (5.5%) | 35 (3.2%) |
| $50,000 to $54,999 | 61 (4.1%) | 20 (1.8%) |
| $55,000 to $64,999 | 143 (9.6%) | 99 (9.1%) |
| $65,000 to $74,999 | 47 (3.1%) | 108 (10.0%) |
| $75,000 to $99,999 | 119 (7.9%) | 131 (12.1%) |
| $100,000+ | 500 (33.4%) | 326 (30.0%) |
| Total | 1,498 (100.0%) | 1,085 (100.0%) |
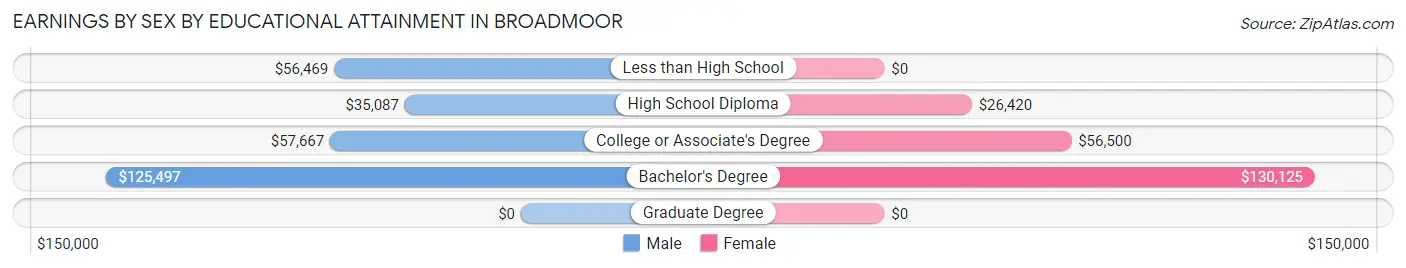
Earnings by Sex by Educational Attainment in Broadmoor
Average earnings in Broadmoor are $58,713 for men and $69,258 for women, a difference of 15.2%. Men with an educational attainment of bachelor's degree enjoy the highest average annual earnings of $125,497, while those with high school diploma education earn the least with $35,087. Women with an educational attainment of bachelor's degree earn the most with the average annual earnings of $130,125, while those with high school diploma education have the smallest earnings of $26,420.
| Educational Attainment | Male Income | Female Income |
| Less than High School | $56,469 | $0 |
| High School Diploma | $35,087 | $26,420 |
| College or Associate's Degree | $57,667 | $56,500 |
| Bachelor's Degree | $125,497 | $130,125 |
| Graduate Degree | - | - |
| Total | $58,713 | $69,258 |
Family Income in Broadmoor
Family Income Brackets in Broadmoor
According to the Broadmoor family income data, there are 377 families falling into the $200,000+ income range, which is the most common income bracket and makes up 35.5% of all families.
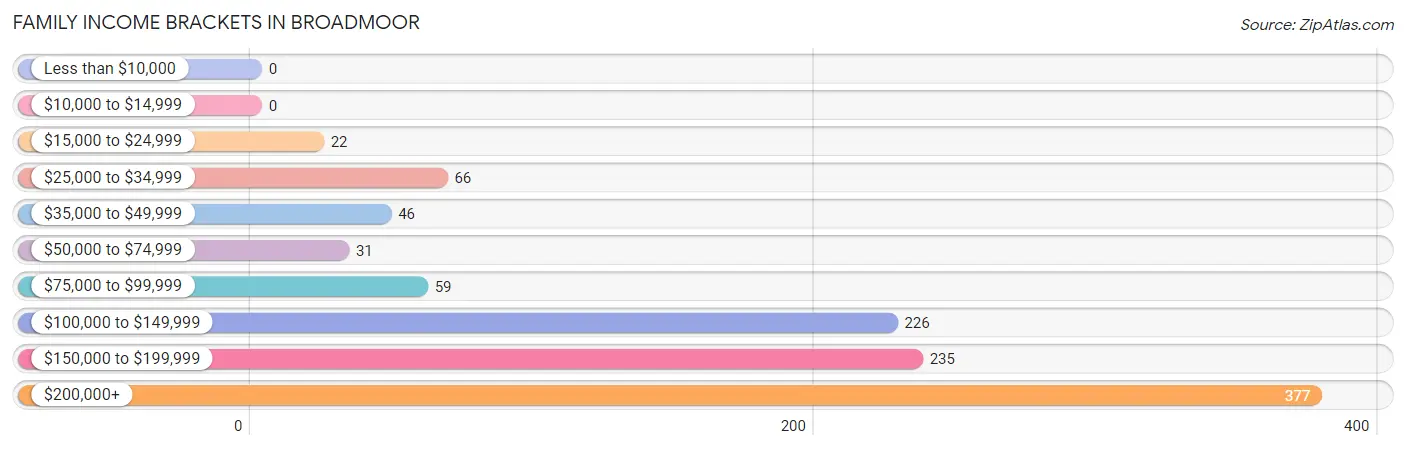
| Income Bracket | # Families | % Families |
| Less than $10,000 | 0 | 0.0% |
| $10,000 to $14,999 | 0 | 0.0% |
| $15,000 to $24,999 | 22 | 2.1% |
| $25,000 to $34,999 | 66 | 6.2% |
| $35,000 to $49,999 | 46 | 4.3% |
| $50,000 to $74,999 | 31 | 2.9% |
| $75,000 to $99,999 | 59 | 5.6% |
| $100,000 to $149,999 | 226 | 21.3% |
| $150,000 to $199,999 | 235 | 22.1% |
| $200,000+ | 377 | 35.5% |
Family Income by Famaliy Size in Broadmoor
5-person families (100 | 9.4%) account for the highest median family income in Broadmoor with $250,001 per family, while 3-person families (421 | 39.6%) have the highest median income of $66,419 per family member.
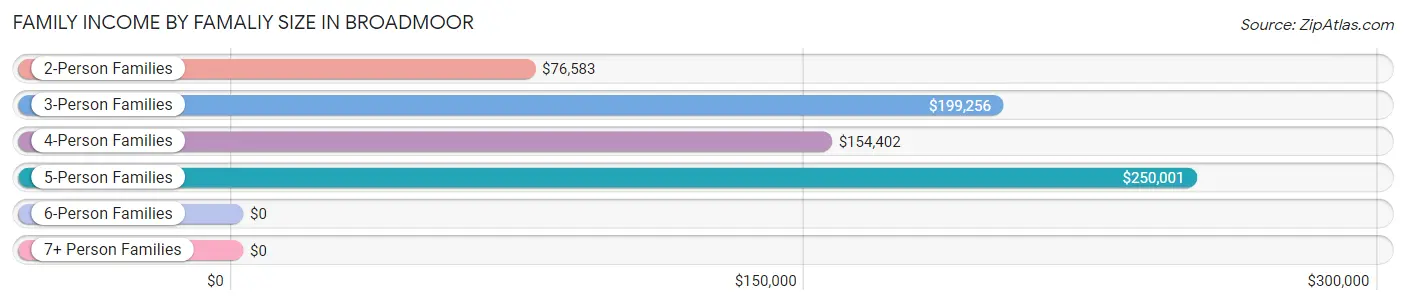
| Income Bracket | # Families | Median Income |
| 2-Person Families | 229 (21.6%) | $76,583 |
| 3-Person Families | 421 (39.6%) | $199,256 |
| 4-Person Families | 286 (26.9%) | $154,402 |
| 5-Person Families | 100 (9.4%) | $250,001 |
| 6-Person Families | 18 (1.7%) | $0 |
| 7+ Person Families | 8 (0.7%) | $0 |
| Total | 1,062 (100.0%) | $156,326 |
Family Income by Number of Earners in Broadmoor
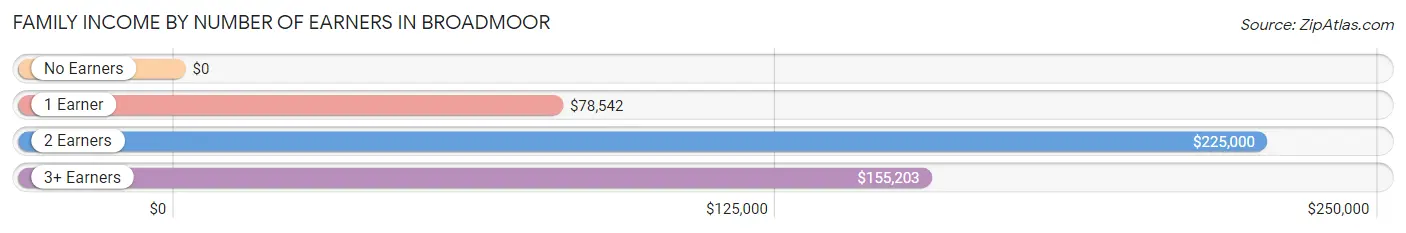
| Number of Earners | # Families | Median Income |
| No Earners | 39 (3.7%) | $0 |
| 1 Earner | 290 (27.3%) | $78,542 |
| 2 Earners | 504 (47.5%) | $225,000 |
| 3+ Earners | 229 (21.6%) | $155,203 |
| Total | 1,062 (100.0%) | $156,326 |
Household Income in Broadmoor
Household Income Brackets in Broadmoor
With 438 households falling in the category, the $200,000+ income range is the most frequent in Broadmoor, accounting for 32.5% of all households.
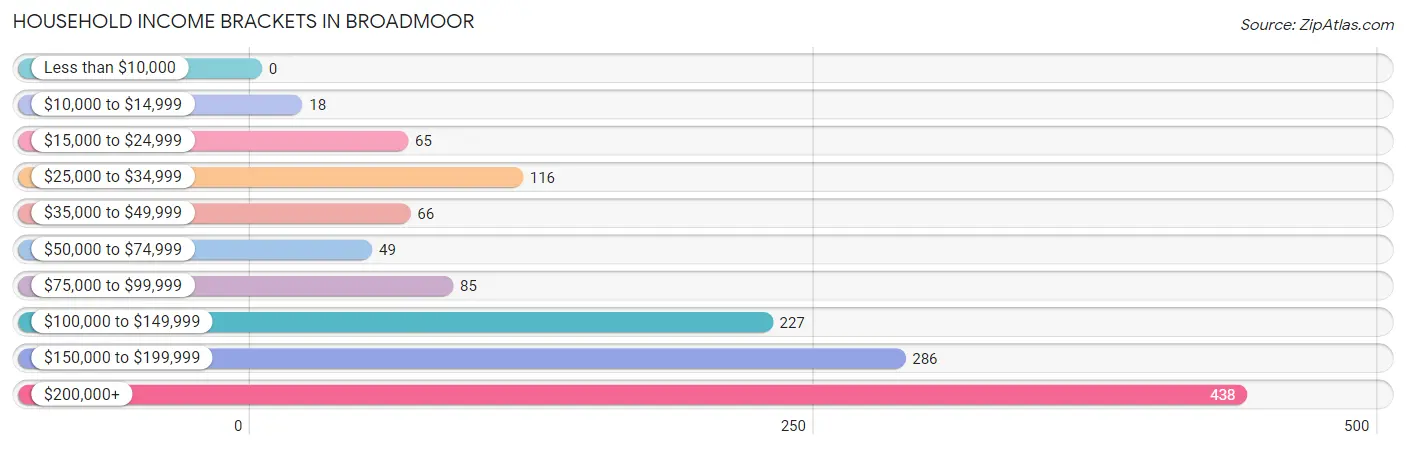
| Income Bracket | # Households | % Households |
| Less than $10,000 | 0 | 0.0% |
| $10,000 to $14,999 | 18 | 1.3% |
| $15,000 to $24,999 | 65 | 4.8% |
| $25,000 to $34,999 | 116 | 8.6% |
| $35,000 to $49,999 | 66 | 4.9% |
| $50,000 to $74,999 | 49 | 3.6% |
| $75,000 to $99,999 | 85 | 6.3% |
| $100,000 to $149,999 | 227 | 16.8% |
| $150,000 to $199,999 | 286 | 21.2% |
| $200,000+ | 438 | 32.5% |
Household Income by Householder Age in Broadmoor
The median household income in Broadmoor is $155,137, with the highest median household income of $188,750 found in the 25 to 44 years age bracket for the primary householder. A total of 522 households (38.7%) fall into this category.
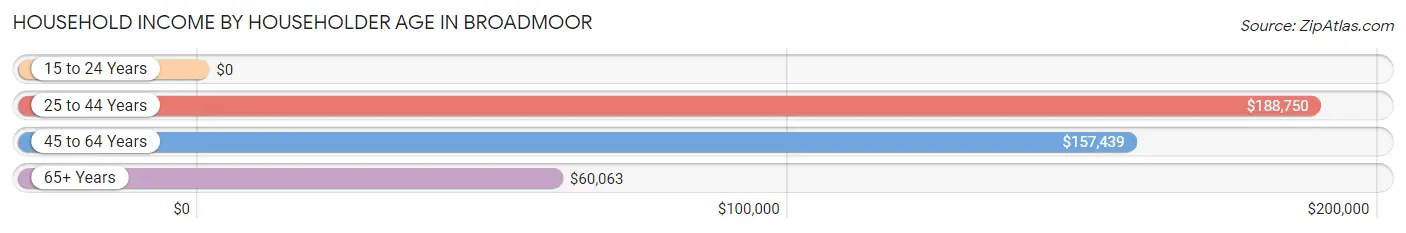
| Income Bracket | # Households | Median Income |
| 15 to 24 Years | 0 (0.0%) | $0 |
| 25 to 44 Years | 522 (38.7%) | $188,750 |
| 45 to 64 Years | 452 (33.5%) | $157,439 |
| 65+ Years | 375 (27.8%) | $60,063 |
| Total | 1,349 (100.0%) | $155,137 |
Poverty in Broadmoor
Income Below Poverty by Sex and Age in Broadmoor
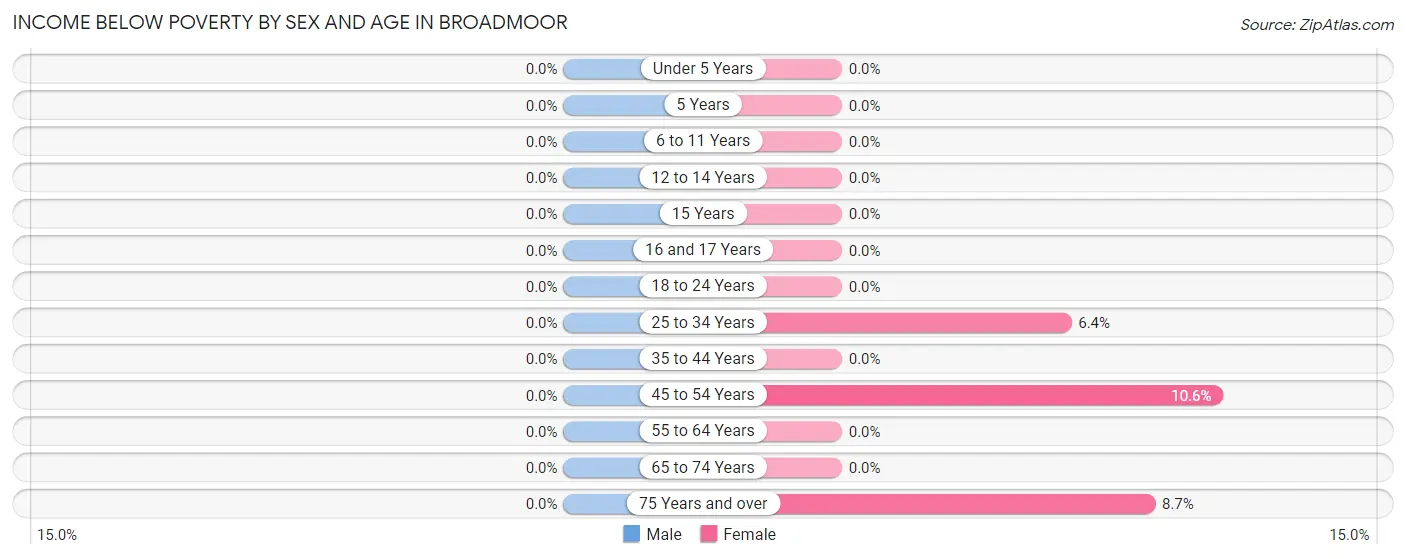
| Age Bracket | Male | Female |
| Under 5 Years | 0 (0.0%) | 0 (0.0%) |
| 5 Years | 0 (0.0%) | 0 (0.0%) |
| 6 to 11 Years | 0 (0.0%) | 0 (0.0%) |
| 12 to 14 Years | 0 (0.0%) | 0 (0.0%) |
| 15 Years | 0 (0.0%) | 0 (0.0%) |
| 16 and 17 Years | 0 (0.0%) | 0 (0.0%) |
| 18 to 24 Years | 0 (0.0%) | 0 (0.0%) |
| 25 to 34 Years | 0 (0.0%) | 17 (6.4%) |
| 35 to 44 Years | 0 (0.0%) | 0 (0.0%) |
| 45 to 54 Years | 0 (0.0%) | 31 (10.6%) |
| 55 to 64 Years | 0 (0.0%) | 0 (0.0%) |
| 65 to 74 Years | 0 (0.0%) | 0 (0.0%) |
| 75 Years and over | 0 (0.0%) | 17 (8.7%) |
| Total | 0 (0.0%) | 65 (3.1%) |
Income Above Poverty by Sex and Age in Broadmoor
According to the poverty statistics in Broadmoor, males aged under 5 years and females aged under 5 years are the age groups that are most secure financially, with 100.0% of males and 100.0% of females in these age groups living above the poverty line.
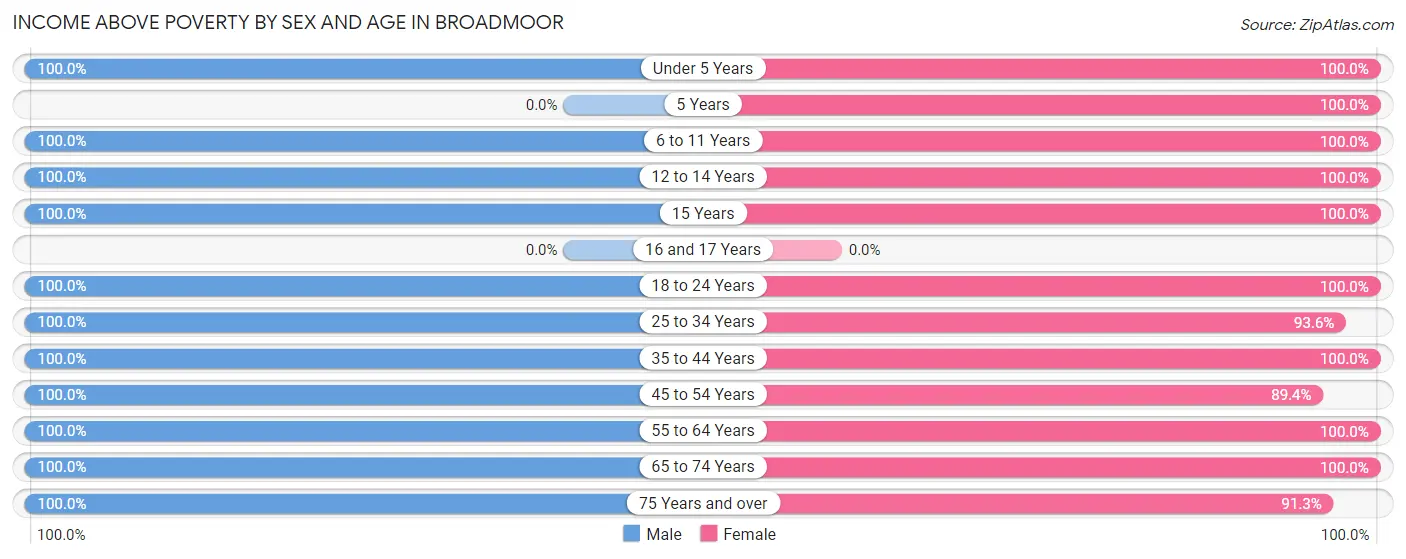
| Age Bracket | Male | Female |
| Under 5 Years | 78 (100.0%) | 166 (100.0%) |
| 5 Years | 0 (0.0%) | 50 (100.0%) |
| 6 to 11 Years | 232 (100.0%) | 129 (100.0%) |
| 12 to 14 Years | 66 (100.0%) | 55 (100.0%) |
| 15 Years | 26 (100.0%) | 106 (100.0%) |
| 16 and 17 Years | 0 (0.0%) | 0 (0.0%) |
| 18 to 24 Years | 206 (100.0%) | 12 (100.0%) |
| 25 to 34 Years | 486 (100.0%) | 249 (93.6%) |
| 35 to 44 Years | 351 (100.0%) | 262 (100.0%) |
| 45 to 54 Years | 213 (100.0%) | 261 (89.4%) |
| 55 to 64 Years | 321 (100.0%) | 349 (100.0%) |
| 65 to 74 Years | 179 (100.0%) | 194 (100.0%) |
| 75 Years and over | 153 (100.0%) | 178 (91.3%) |
| Total | 2,311 (100.0%) | 2,011 (96.9%) |
Income Below Poverty Among Married-Couple Families in Broadmoor
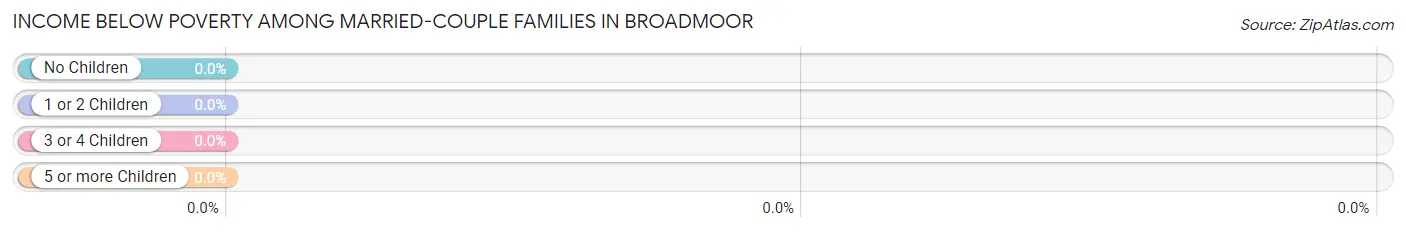
| Children | Above Poverty | Below Poverty |
| No Children | 396 (100.0%) | 0 (0.0%) |
| 1 or 2 Children | 368 (100.0%) | 0 (0.0%) |
| 3 or 4 Children | 21 (100.0%) | 0 (0.0%) |
| 5 or more Children | 0 (0.0%) | 0 (0.0%) |
| Total | 785 (100.0%) | 0 (0.0%) |
Income Below Poverty Among Single-Parent Households in Broadmoor
| Children | Single Father | Single Mother |
| No Children | 0 (0.0%) | 0 (0.0%) |
| 1 or 2 Children | 0 (0.0%) | 0 (0.0%) |
| 3 or 4 Children | 0 (0.0%) | 0 (0.0%) |
| 5 or more Children | 0 (0.0%) | 0 (0.0%) |
| Total | 0 (0.0%) | 0 (0.0%) |
Income Below Poverty Among Married-Couple vs Single-Parent Households in Broadmoor
| Children | Married-Couple Families | Single-Parent Households |
| No Children | 0 (0.0%) | 0 (0.0%) |
| 1 or 2 Children | 0 (0.0%) | 0 (0.0%) |
| 3 or 4 Children | 0 (0.0%) | 0 (0.0%) |
| 5 or more Children | 0 (0.0%) | 0 (0.0%) |
| Total | 0 (0.0%) | 0 (0.0%) |
Race in Broadmoor
The most populous races in Broadmoor are Asian (2,335 | 52.8%), White / Caucasian (1,272 | 28.8%), and Hispanic or Latino (979 | 22.2%).
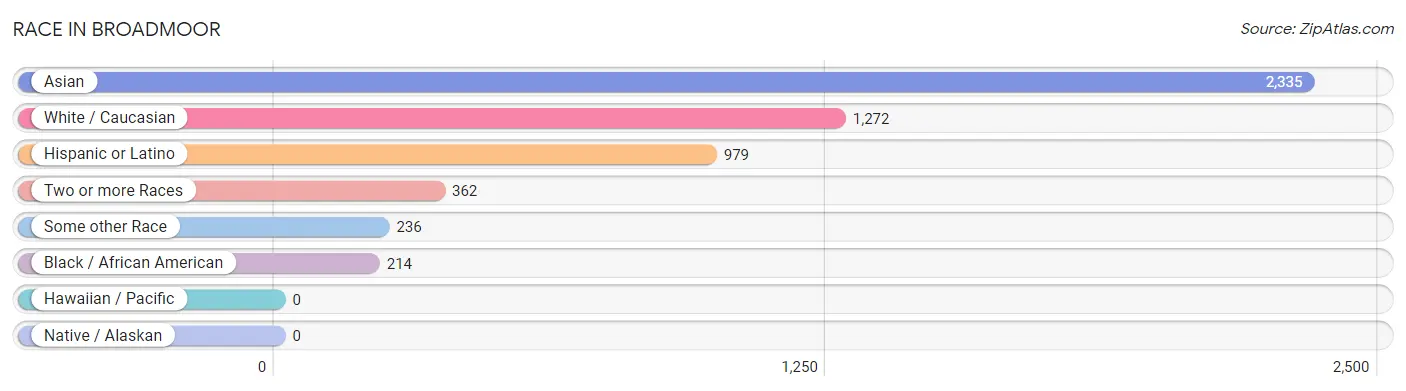
| Race | # Population | % Population |
| Asian | 2,335 | 52.8% |
| Black / African American | 214 | 4.8% |
| Hawaiian / Pacific | 0 | 0.0% |
| Hispanic or Latino | 979 | 22.2% |
| Native / Alaskan | 0 | 0.0% |
| White / Caucasian | 1,272 | 28.8% |
| Two or more Races | 362 | 8.2% |
| Some other Race | 236 | 5.3% |
| Total | 4,419 | 100.0% |
Ancestry in Broadmoor
The most populous ancestries reported in Broadmoor are Korean (1,182 | 26.8%), Indian (Asian) (1,071 | 24.2%), Mexican (318 | 7.2%), Central American (305 | 6.9%), and Panamanian (265 | 6.0%), together accounting for 71.1% of all Broadmoor residents.
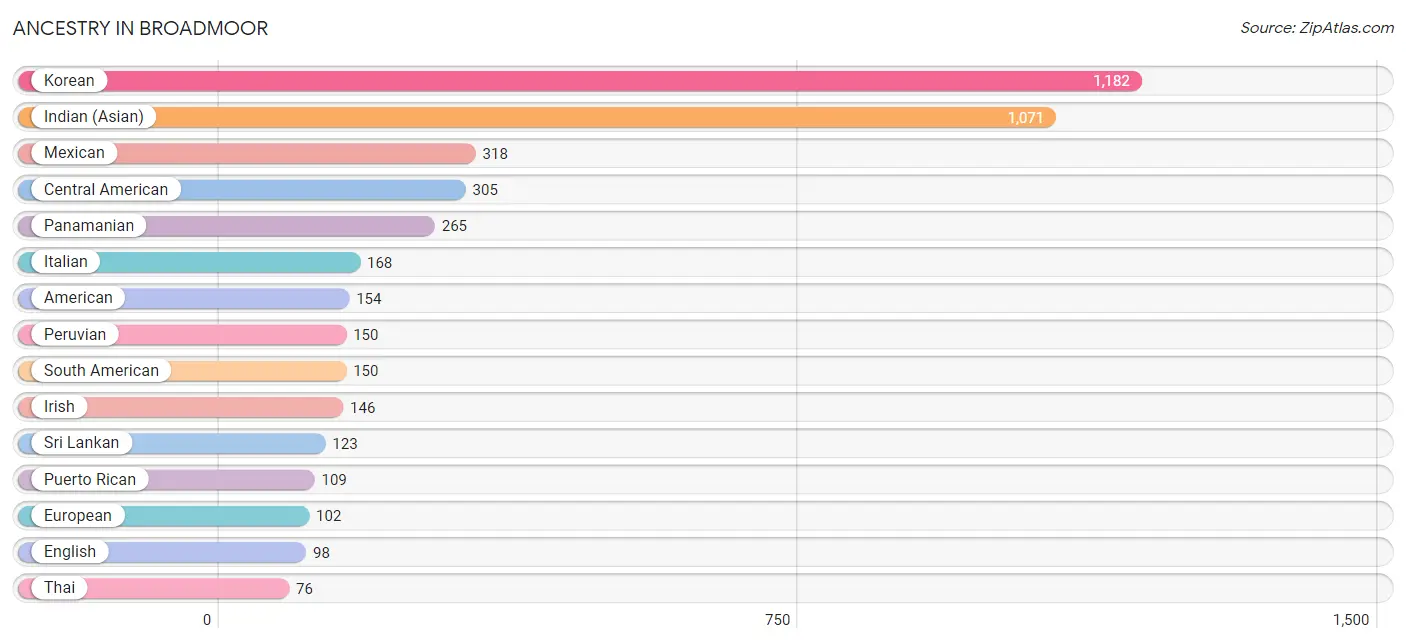
| Ancestry | # Population | % Population |
| American | 154 | 3.5% |
| Bhutanese | 16 | 0.4% |
| Burmese | 68 | 1.5% |
| Central American | 305 | 6.9% |
| Cuban | 35 | 0.8% |
| Danish | 15 | 0.3% |
| Dominican | 44 | 1.0% |
| English | 98 | 2.2% |
| European | 102 | 2.3% |
| French | 31 | 0.7% |
| German | 27 | 0.6% |
| Indian (Asian) | 1,071 | 24.2% |
| Iranian | 50 | 1.1% |
| Irish | 146 | 3.3% |
| Italian | 168 | 3.8% |
| Korean | 1,182 | 26.8% |
| Mexican | 318 | 7.2% |
| Nicaraguan | 40 | 0.9% |
| Panamanian | 265 | 6.0% |
| Peruvian | 150 | 3.4% |
| Polish | 30 | 0.7% |
| Puerto Rican | 109 | 2.5% |
| Scotch-Irish | 14 | 0.3% |
| Scottish | 12 | 0.3% |
| South American | 150 | 3.4% |
| Sri Lankan | 123 | 2.8% |
| Thai | 76 | 1.7% | View All 27 Rows |
Immigrants in Broadmoor
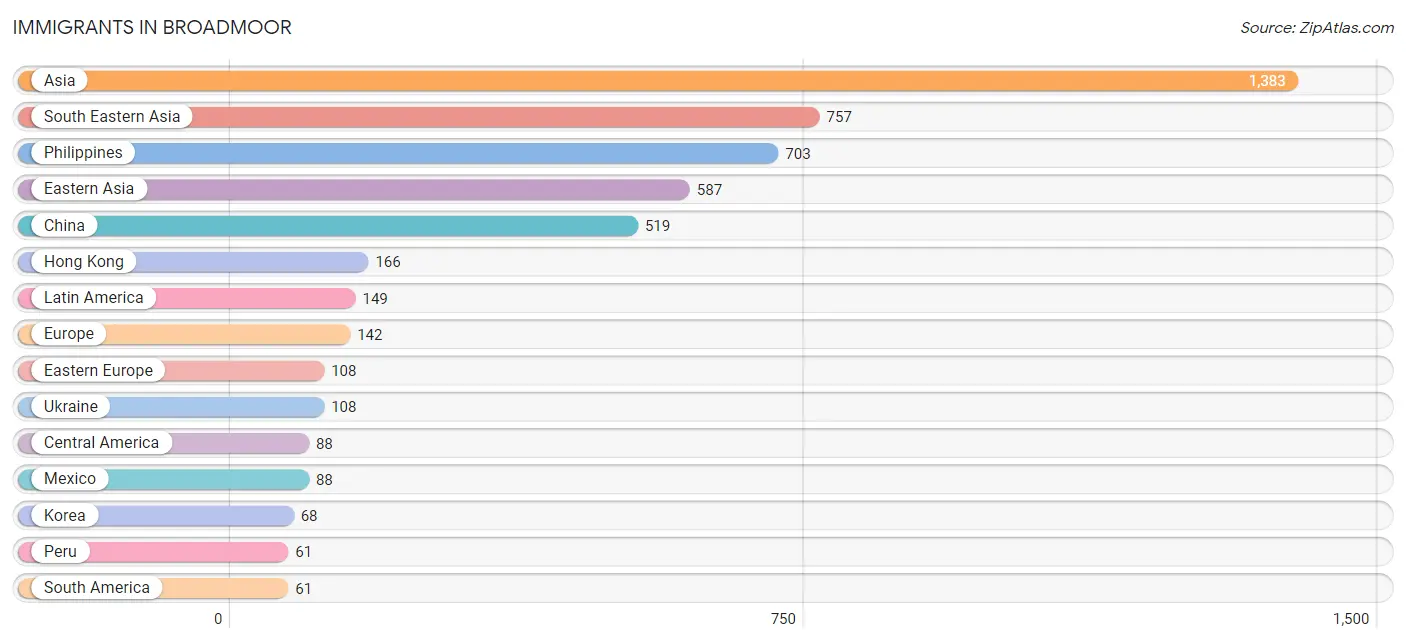
The most numerous immigrant groups reported in Broadmoor came from Asia (1,383 | 31.3%), South Eastern Asia (757 | 17.1%), Philippines (703 | 15.9%), Eastern Asia (587 | 13.3%), and China (519 | 11.7%), together accounting for 89.4% of all Broadmoor residents.
| Immigration Origin | # Population | % Population |
| Africa | 15 | 0.3% |
| Asia | 1,383 | 31.3% |
| Central America | 88 | 2.0% |
| China | 519 | 11.7% |
| Eastern Asia | 587 | 13.3% |
| Eastern Europe | 108 | 2.4% |
| Egypt | 15 | 0.3% |
| Europe | 142 | 3.2% |
| Hong Kong | 166 | 3.8% |
| India | 39 | 0.9% |
| Italy | 14 | 0.3% |
| Korea | 68 | 1.5% |
| Latin America | 149 | 3.4% |
| Mexico | 88 | 2.0% |
| Northern Africa | 15 | 0.3% |
| Northern Europe | 20 | 0.4% |
| Peru | 61 | 1.4% |
| Philippines | 703 | 15.9% |
| South America | 61 | 1.4% |
| South Central Asia | 39 | 0.9% |
| South Eastern Asia | 757 | 17.1% |
| Southern Europe | 14 | 0.3% |
| Ukraine | 108 | 2.4% |
| Vietnam | 34 | 0.8% | View All 24 Rows |
Sex and Age in Broadmoor
Sex and Age in Broadmoor
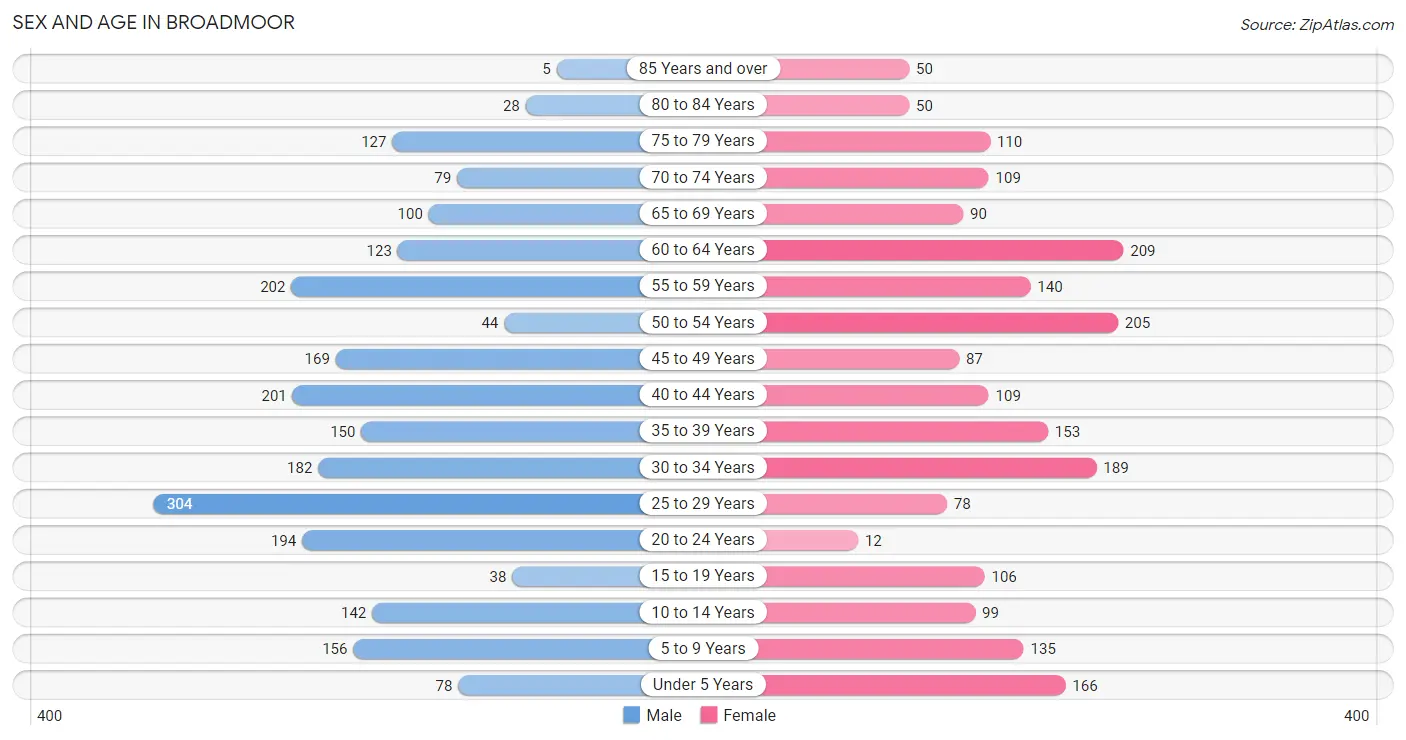
The most populous age groups in Broadmoor are 25 to 29 Years (304 | 13.1%) for men and 60 to 64 Years (209 | 10.0%) for women.
| Age Bracket | Male | Female |
| Under 5 Years | 78 (3.4%) | 166 (7.9%) |
| 5 to 9 Years | 156 (6.7%) | 135 (6.4%) |
| 10 to 14 Years | 142 (6.1%) | 99 (4.7%) |
| 15 to 19 Years | 38 (1.6%) | 106 (5.1%) |
| 20 to 24 Years | 194 (8.4%) | 12 (0.6%) |
| 25 to 29 Years | 304 (13.1%) | 78 (3.7%) |
| 30 to 34 Years | 182 (7.8%) | 189 (9.0%) |
| 35 to 39 Years | 150 (6.5%) | 153 (7.3%) |
| 40 to 44 Years | 201 (8.7%) | 109 (5.2%) |
| 45 to 49 Years | 169 (7.3%) | 87 (4.2%) |
| 50 to 54 Years | 44 (1.9%) | 205 (9.8%) |
| 55 to 59 Years | 202 (8.7%) | 140 (6.7%) |
| 60 to 64 Years | 123 (5.3%) | 209 (10.0%) |
| 65 to 69 Years | 100 (4.3%) | 90 (4.3%) |
| 70 to 74 Years | 79 (3.4%) | 109 (5.2%) |
| 75 to 79 Years | 127 (5.5%) | 110 (5.2%) |
| 80 to 84 Years | 28 (1.2%) | 50 (2.4%) |
| 85 Years and over | 5 (0.2%) | 50 (2.4%) |
| Total | 2,322 (100.0%) | 2,097 (100.0%) |
Families and Households in Broadmoor
Median Family Size in Broadmoor
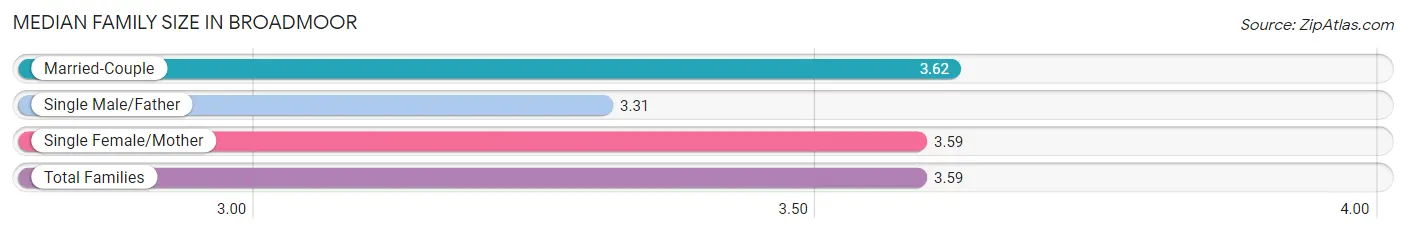
The median family size in Broadmoor is 3.59 persons per family, with married-couple families (785 | 73.9%) accounting for the largest median family size of 3.62 persons per family. On the other hand, single male/father families (90 | 8.5%) represent the smallest median family size with 3.31 persons per family.
| Family Type | # Families | Family Size |
| Married-Couple | 785 (73.9%) | 3.62 |
| Single Male/Father | 90 (8.5%) | 3.31 |
| Single Female/Mother | 187 (17.6%) | 3.59 |
| Total Families | 1,062 (100.0%) | 3.59 |
Median Household Size in Broadmoor
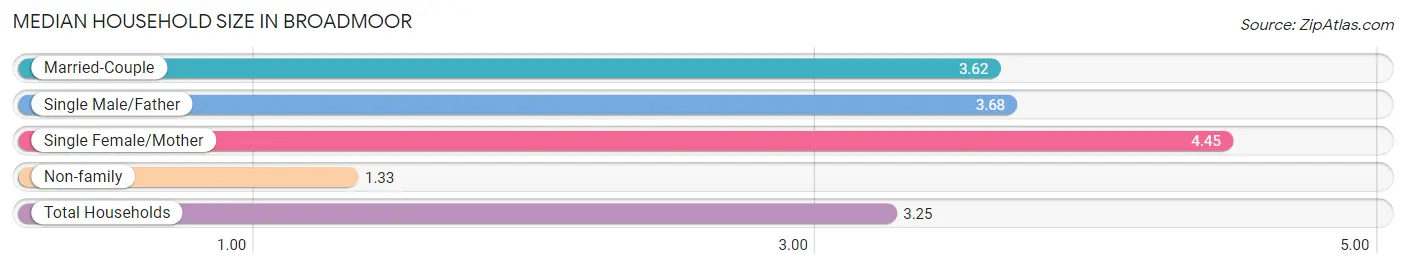
The median household size in Broadmoor is 3.25 persons per household, with single female/mother households (187 | 13.9%) accounting for the largest median household size of 4.45 persons per household. non-family households (287 | 21.3%) represent the smallest median household size with 1.33 persons per household.
| Household Type | # Households | Household Size |
| Married-Couple | 785 (58.2%) | 3.62 |
| Single Male/Father | 90 (6.7%) | 3.68 |
| Single Female/Mother | 187 (13.9%) | 4.45 |
| Non-family | 287 (21.3%) | 1.33 |
| Total Households | 1,349 (100.0%) | 3.25 |
Household Size by Marriage Status in Broadmoor
Out of a total of 1,349 households in Broadmoor, 1,062 (78.7%) are family households, while 287 (21.3%) are nonfamily households. The most numerous type of family households are 3-person households, comprising 363, and the most common type of nonfamily households are 1-person households, comprising 213.
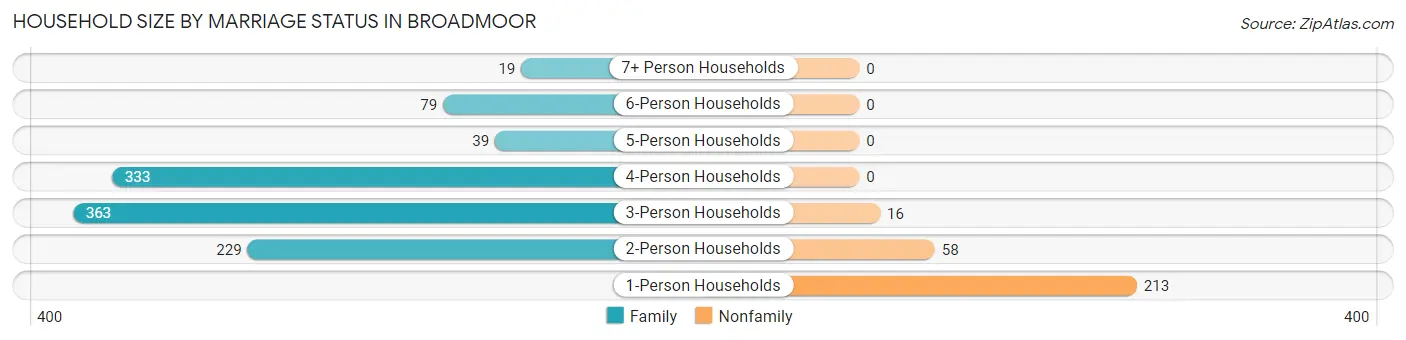
| Household Size | Family Households | Nonfamily Households |
| 1-Person Households | - | 213 (15.8%) |
| 2-Person Households | 229 (17.0%) | 58 (4.3%) |
| 3-Person Households | 363 (26.9%) | 16 (1.2%) |
| 4-Person Households | 333 (24.7%) | 0 (0.0%) |
| 5-Person Households | 39 (2.9%) | 0 (0.0%) |
| 6-Person Households | 79 (5.9%) | 0 (0.0%) |
| 7+ Person Households | 19 (1.4%) | 0 (0.0%) |
| Total | 1,062 (78.7%) | 287 (21.3%) |
Female Fertility in Broadmoor
Fertility by Age in Broadmoor
Average fertility rate in Broadmoor is 83.0 births per 1,000 women. Women in the age bracket of 35 to 50 years have the highest fertility rate with 175.0 births per 1,000 women. Women in the age bracket of 35 to 50 years acount for 100.0% of all women with births.
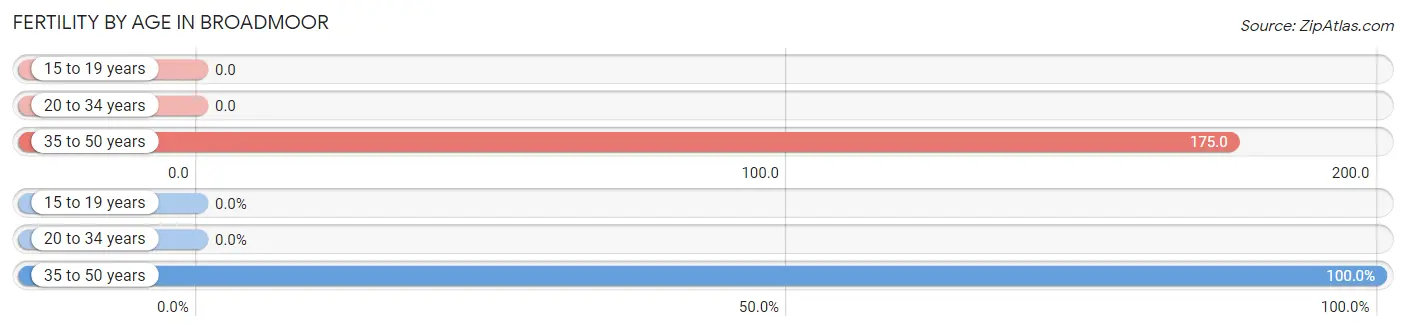
| Age Bracket | Women with Births | Births / 1,000 Women |
| 15 to 19 years | 0 (0.0%) | 0.0 |
| 20 to 34 years | 0 (0.0%) | 0.0 |
| 35 to 50 years | 61 (100.0%) | 175.0 |
| Total | 61 (100.0%) | 83.0 |
Fertility by Age by Marriage Status in Broadmoor
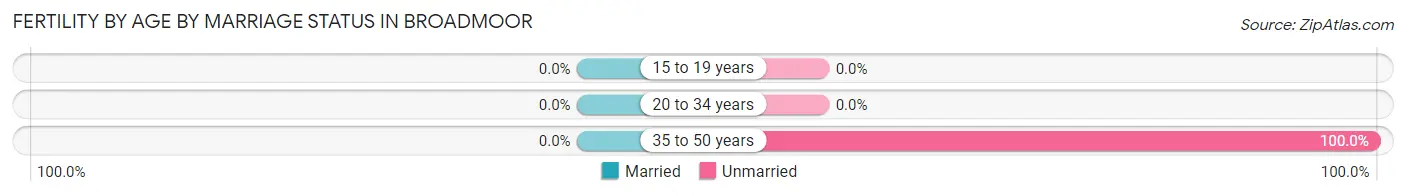
| Age Bracket | Married | Unmarried |
| 15 to 19 years | 0 (0.0%) | 0 (0.0%) |
| 20 to 34 years | 0 (0.0%) | 0 (0.0%) |
| 35 to 50 years | 0 (0.0%) | 61 (100.0%) |
| Total | 0 (0.0%) | 61 (100.0%) |
Fertility by Education in Broadmoor
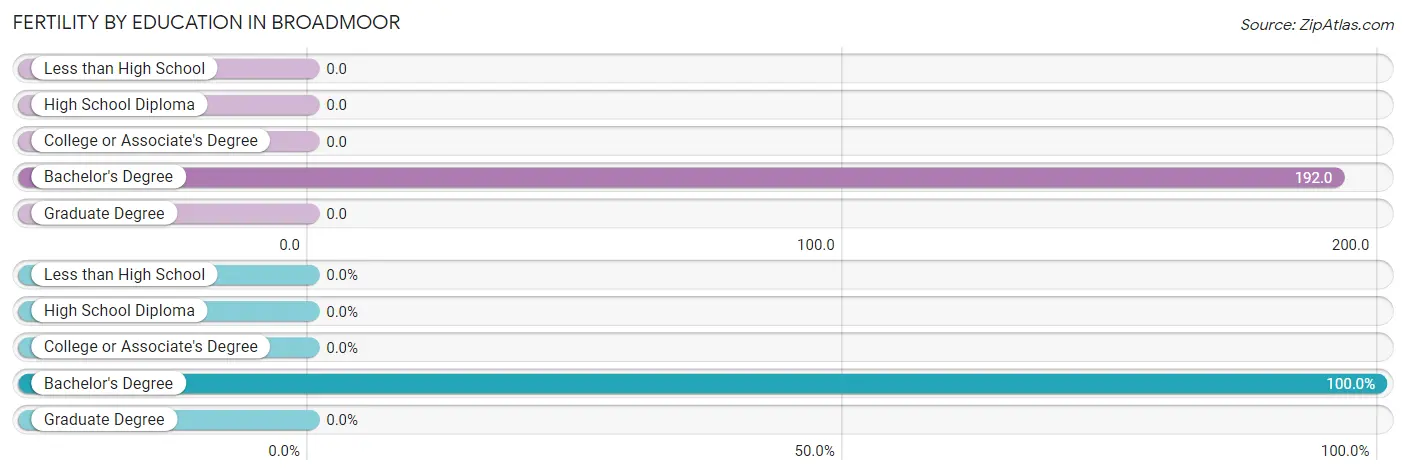
| Educational Attainment | Women with Births | Births / 1,000 Women |
| Less than High School | 0 (0.0%) | 0.0 |
| High School Diploma | 0 (0.0%) | 0.0 |
| College or Associate's Degree | 0 (0.0%) | 0.0 |
| Bachelor's Degree | 61 (100.0%) | 192.0 |
| Graduate Degree | 0 (0.0%) | 0.0 |
| Total | 61 (100.0%) | 83.0 |
Fertility by Education by Marriage Status in Broadmoor
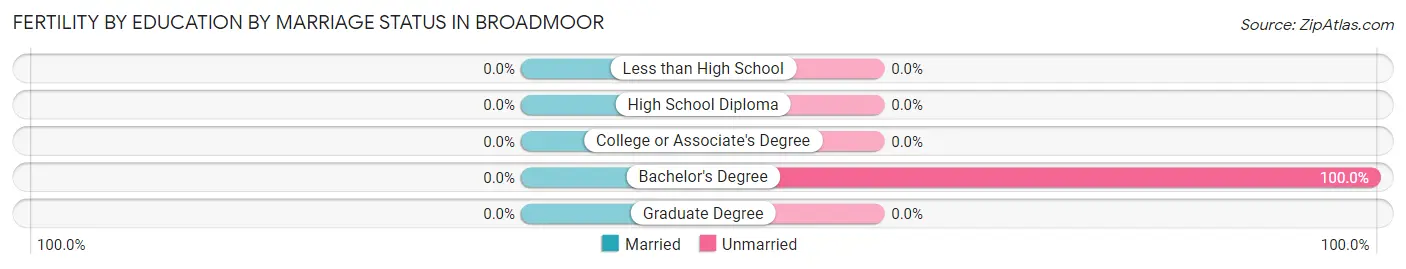
| Educational Attainment | Married | Unmarried |
| Less than High School | 0 (0.0%) | 0 (0.0%) |
| High School Diploma | 0 (0.0%) | 0 (0.0%) |
| College or Associate's Degree | 0 (0.0%) | 0 (0.0%) |
| Bachelor's Degree | 0 (0.0%) | 61 (100.0%) |
| Graduate Degree | 0 (0.0%) | 0 (0.0%) |
| Total | 0 (0.0%) | 61 (100.0%) |
Employment Characteristics in Broadmoor
Employment by Class of Employer in Broadmoor
Among the 2,424 employed individuals in Broadmoor, private company employees (1,624 | 67.0%), local government employees (277 | 11.4%), and state government employees (230 | 9.5%) make up the most common classes of employment.
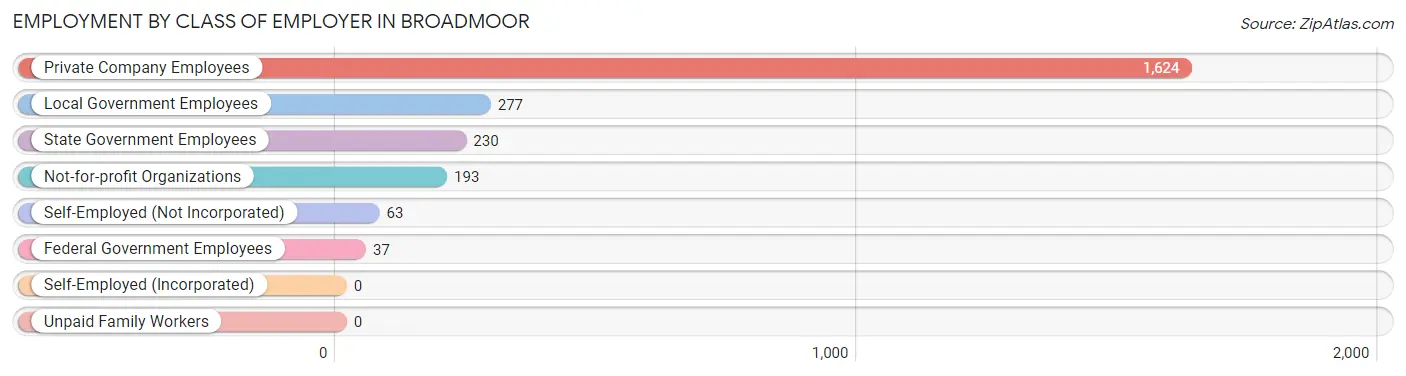
| Employer Class | # Employees | % Employees |
| Private Company Employees | 1,624 | 67.0% |
| Self-Employed (Incorporated) | 0 | 0.0% |
| Self-Employed (Not Incorporated) | 63 | 2.6% |
| Not-for-profit Organizations | 193 | 8.0% |
| Local Government Employees | 277 | 11.4% |
| State Government Employees | 230 | 9.5% |
| Federal Government Employees | 37 | 1.5% |
| Unpaid Family Workers | 0 | 0.0% |
| Total | 2,424 | 100.0% |
Employment Status by Age in Broadmoor
According to the labor force statistics for Broadmoor, out of the total population over 16 years of age (3,511), 72.6% or 2,549 individuals are in the labor force, with 4.9% or 125 of them unemployed. The age group with the highest labor force participation rate is 16 to 19 years, with 100.0% or 12 individuals in the labor force. Within the labor force, the 25 to 29 years age range has the highest percentage of unemployed individuals, with 15.4% or 56 of them being unemployed.
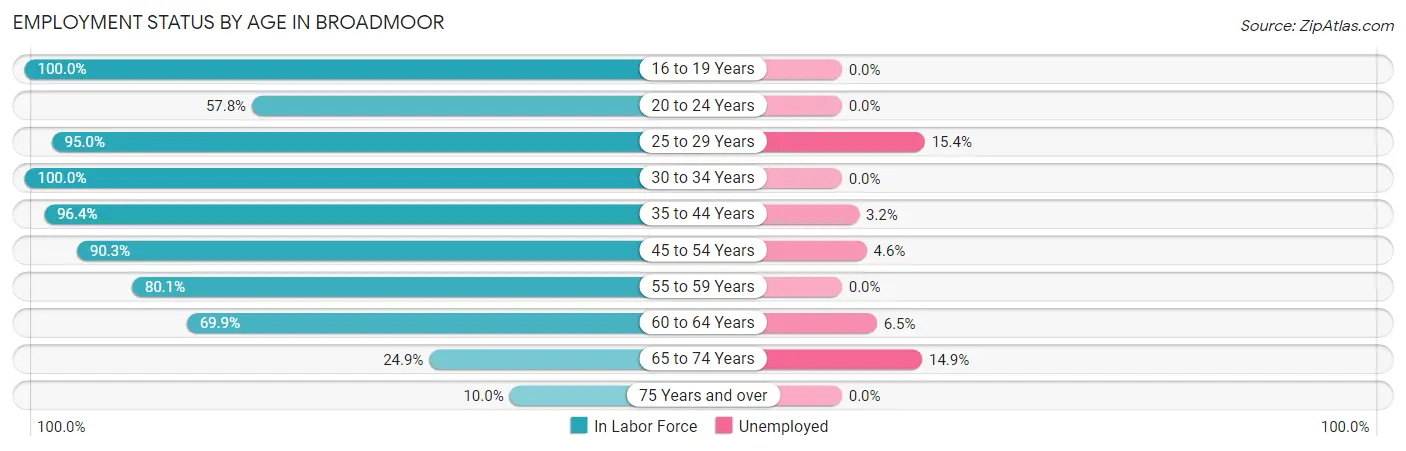
| Age Bracket | In Labor Force | Unemployed |
| 16 to 19 Years | 12 (100.0%) | 0 (0.0%) |
| 20 to 24 Years | 119 (57.8%) | 0 (0.0%) |
| 25 to 29 Years | 363 (95.0%) | 56 (15.4%) |
| 30 to 34 Years | 371 (100.0%) | 0 (0.0%) |
| 35 to 44 Years | 591 (96.4%) | 19 (3.2%) |
| 45 to 54 Years | 456 (90.3%) | 21 (4.6%) |
| 55 to 59 Years | 274 (80.1%) | 0 (0.0%) |
| 60 to 64 Years | 232 (69.9%) | 15 (6.5%) |
| 65 to 74 Years | 94 (24.9%) | 14 (14.9%) |
| 75 Years and over | 37 (10.0%) | 0 (0.0%) |
| Total | 2,549 (72.6%) | 125 (4.9%) |
Employment Status by Educational Attainment in Broadmoor
According to labor force statistics for Broadmoor, 89.9% of individuals (2,288) out of the total population between 25 and 64 years of age (2,545) are in the labor force, with 4.9% or 112 of them being unemployed. The group with the highest labor force participation rate are those with the educational attainment of bachelor's degree or higher, with 96.3% or 1,036 individuals in the labor force. Within the labor force, individuals with college / associate degree education have the highest percentage of unemployment, with 8.2% or 71 of them being unemployed.
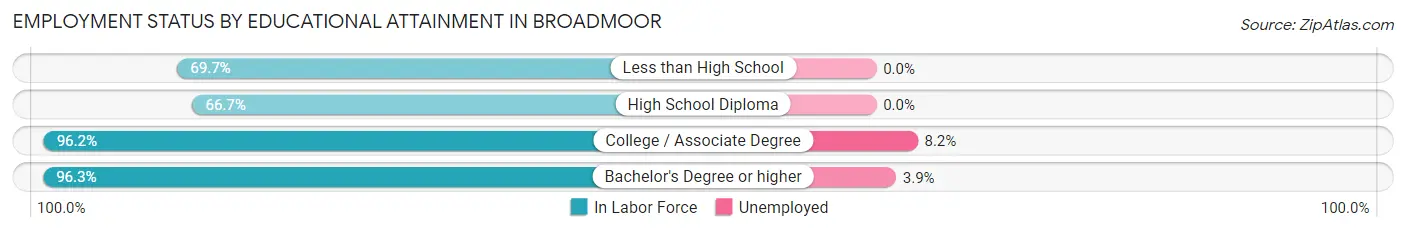
| Educational Attainment | In Labor Force | Unemployed |
| Less than High School | 122 (69.7%) | 0 (0.0%) |
| High School Diploma | 262 (66.7%) | 0 (0.0%) |
| College / Associate Degree | 867 (96.2%) | 74 (8.2%) |
| Bachelor's Degree or higher | 1,036 (96.3%) | 42 (3.9%) |
| Total | 2,288 (89.9%) | 125 (4.9%) |
Employment Occupations by Sex in Broadmoor
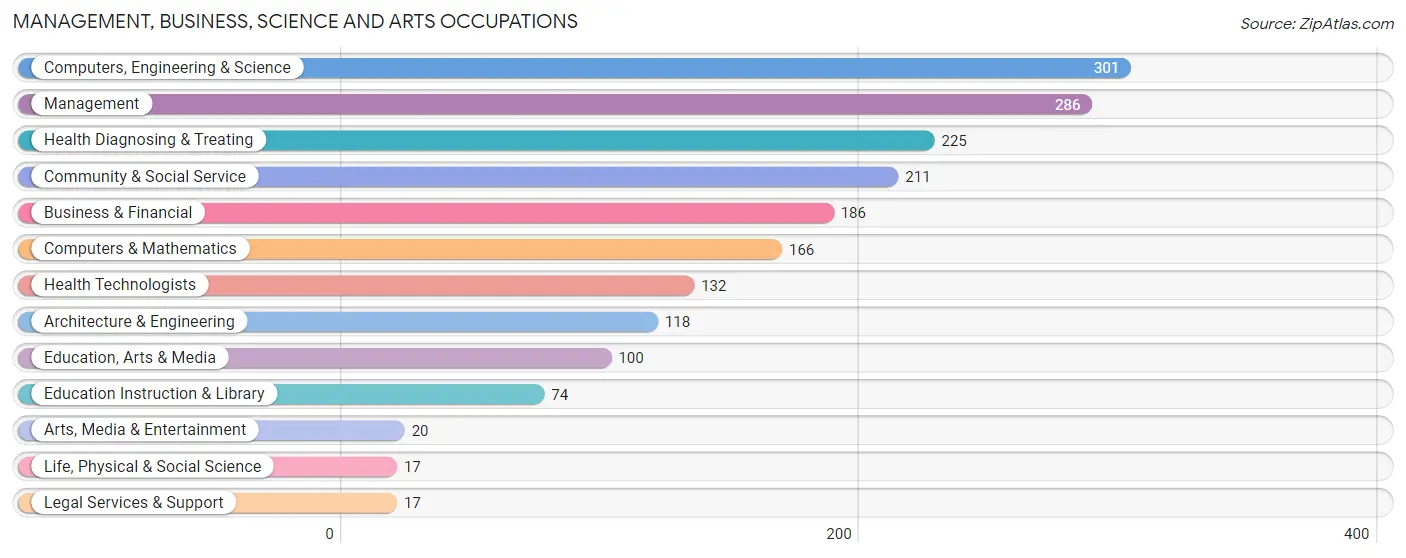
Management, Business, Science and Arts Occupations
The most common Management, Business, Science and Arts occupations in Broadmoor are Computers, Engineering & Science (301 | 12.4%), Management (286 | 11.8%), Health Diagnosing & Treating (225 | 9.3%), Community & Social Service (211 | 8.7%), and Business & Financial (186 | 7.7%).
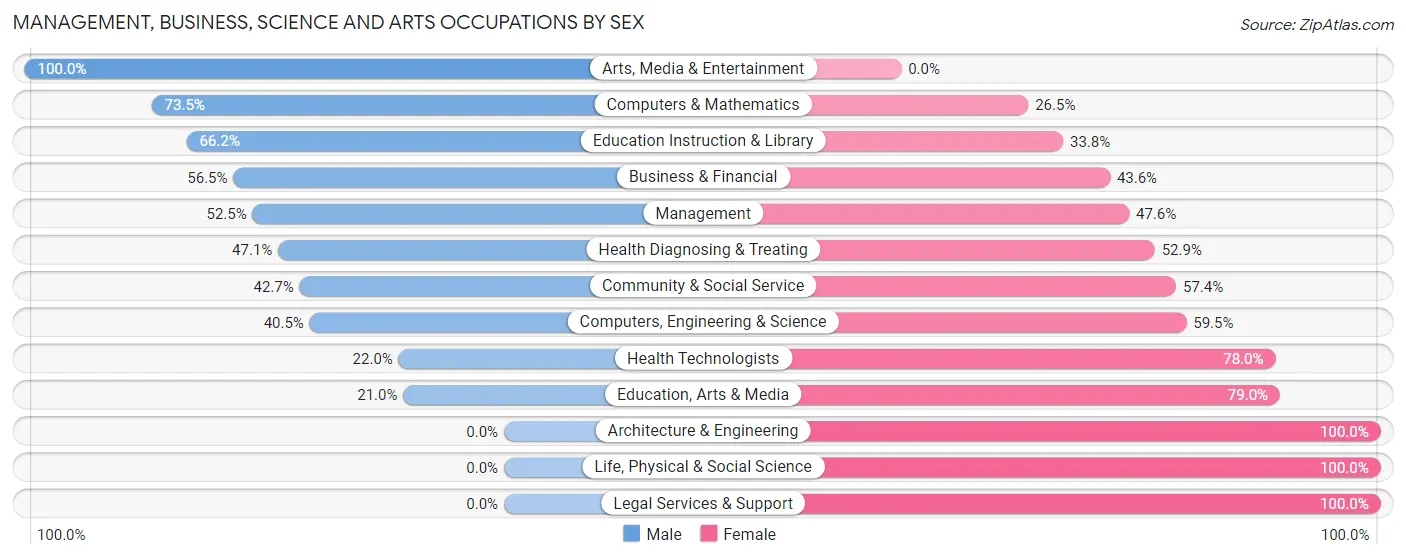
Management, Business, Science and Arts Occupations by Sex
Within the Management, Business, Science and Arts occupations in Broadmoor, the most male-oriented occupations are Arts, Media & Entertainment (100.0%), Computers & Mathematics (73.5%), and Education Instruction & Library (66.2%), while the most female-oriented occupations are Architecture & Engineering (100.0%), Life, Physical & Social Science (100.0%), and Legal Services & Support (100.0%).
| Occupation | Male | Female |
| Management | 150 (52.4%) | 136 (47.5%) |
| Business & Financial | 105 (56.5%) | 81 (43.5%) |
| Computers, Engineering & Science | 122 (40.5%) | 179 (59.5%) |
| Computers & Mathematics | 122 (73.5%) | 44 (26.5%) |
| Architecture & Engineering | 0 (0.0%) | 118 (100.0%) |
| Life, Physical & Social Science | 0 (0.0%) | 17 (100.0%) |
| Community & Social Service | 90 (42.6%) | 121 (57.4%) |
| Education, Arts & Media | 21 (21.0%) | 79 (79.0%) |
| Legal Services & Support | 0 (0.0%) | 17 (100.0%) |
| Education Instruction & Library | 49 (66.2%) | 25 (33.8%) |
| Arts, Media & Entertainment | 20 (100.0%) | 0 (0.0%) |
| Health Diagnosing & Treating | 106 (47.1%) | 119 (52.9%) |
| Health Technologists | 29 (22.0%) | 103 (78.0%) |
| Total (Category) | 573 (47.4%) | 636 (52.6%) |
| Total (Overall) | 1,450 (59.8%) | 974 (40.2%) |
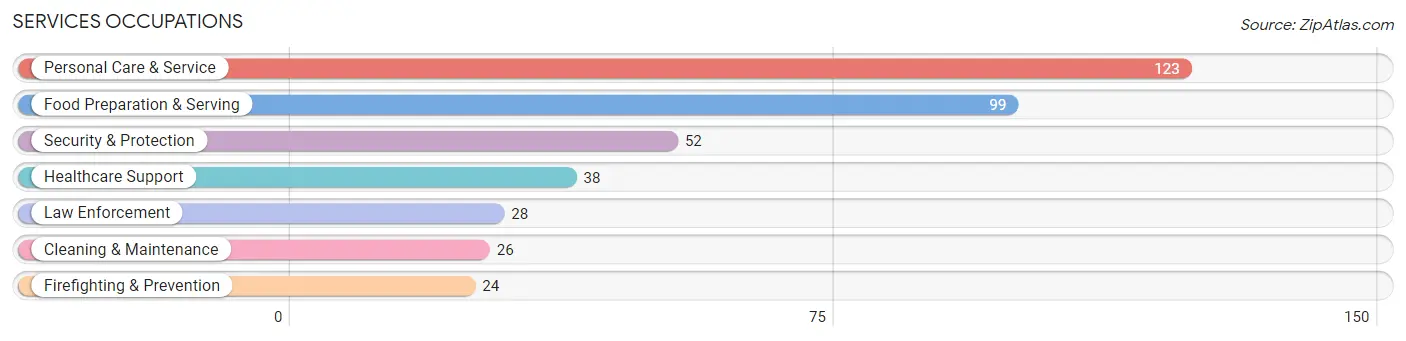
Services Occupations
The most common Services occupations in Broadmoor are Personal Care & Service (123 | 5.1%), Food Preparation & Serving (99 | 4.1%), Security & Protection (52 | 2.1%), Healthcare Support (38 | 1.6%), and Law Enforcement (28 | 1.2%).
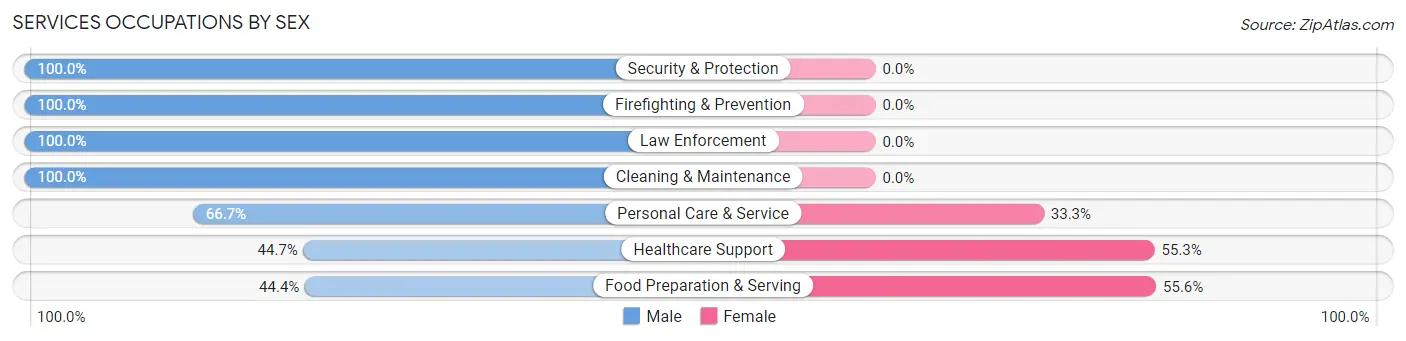
Services Occupations by Sex
Within the Services occupations in Broadmoor, the most male-oriented occupations are Security & Protection (100.0%), Firefighting & Prevention (100.0%), and Law Enforcement (100.0%), while the most female-oriented occupations are Food Preparation & Serving (55.6%), Healthcare Support (55.3%), and Personal Care & Service (33.3%).
| Occupation | Male | Female |
| Healthcare Support | 17 (44.7%) | 21 (55.3%) |
| Security & Protection | 52 (100.0%) | 0 (0.0%) |
| Firefighting & Prevention | 24 (100.0%) | 0 (0.0%) |
| Law Enforcement | 28 (100.0%) | 0 (0.0%) |
| Food Preparation & Serving | 44 (44.4%) | 55 (55.6%) |
| Cleaning & Maintenance | 26 (100.0%) | 0 (0.0%) |
| Personal Care & Service | 82 (66.7%) | 41 (33.3%) |
| Total (Category) | 221 (65.4%) | 117 (34.6%) |
| Total (Overall) | 1,450 (59.8%) | 974 (40.2%) |
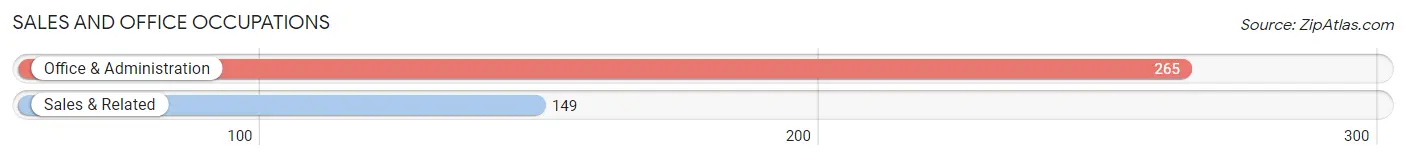
Sales and Office Occupations
The most common Sales and Office occupations in Broadmoor are Office & Administration (265 | 10.9%), and Sales & Related (149 | 6.1%).
Sales and Office Occupations by Sex
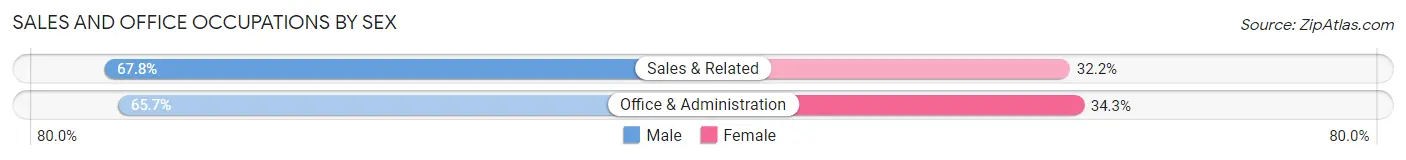
| Occupation | Male | Female |
| Sales & Related | 101 (67.8%) | 48 (32.2%) |
| Office & Administration | 174 (65.7%) | 91 (34.3%) |
| Total (Category) | 275 (66.4%) | 139 (33.6%) |
| Total (Overall) | 1,450 (59.8%) | 974 (40.2%) |
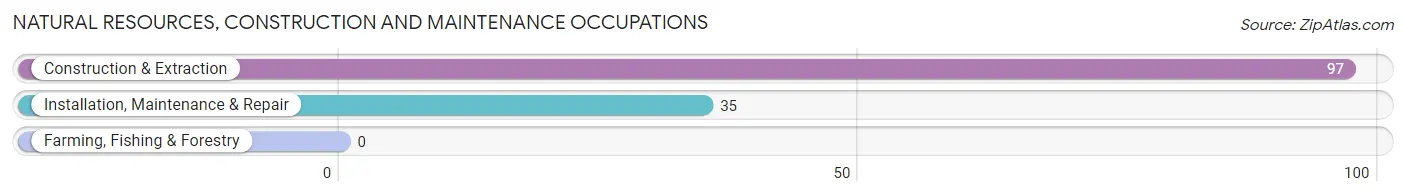
Natural Resources, Construction and Maintenance Occupations
The most common Natural Resources, Construction and Maintenance occupations in Broadmoor are Construction & Extraction (97 | 4.0%), and Installation, Maintenance & Repair (35 | 1.4%).
Natural Resources, Construction and Maintenance Occupations by Sex
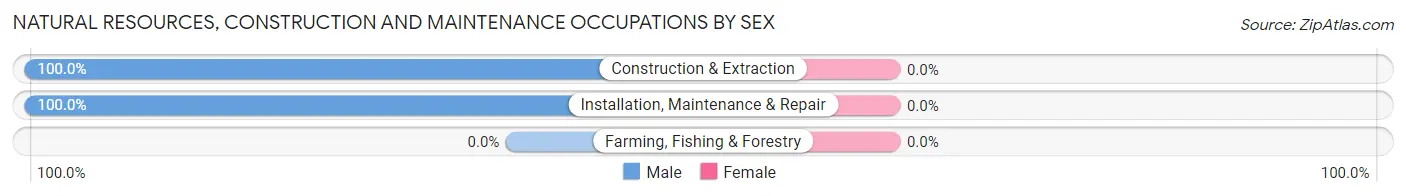
| Occupation | Male | Female |
| Farming, Fishing & Forestry | 0 (0.0%) | 0 (0.0%) |
| Construction & Extraction | 97 (100.0%) | 0 (0.0%) |
| Installation, Maintenance & Repair | 35 (100.0%) | 0 (0.0%) |
| Total (Category) | 132 (100.0%) | 0 (0.0%) |
| Total (Overall) | 1,450 (59.8%) | 974 (40.2%) |
Production, Transportation and Moving Occupations
The most common Production, Transportation and Moving occupations in Broadmoor are Transportation (159 | 6.6%), Production (87 | 3.6%), and Material Moving (85 | 3.5%).
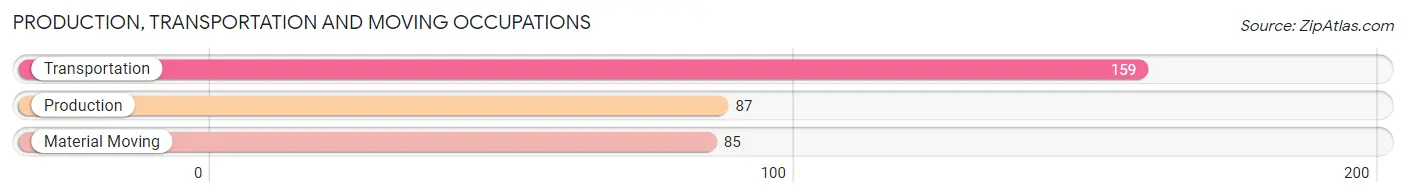
Production, Transportation and Moving Occupations by Sex
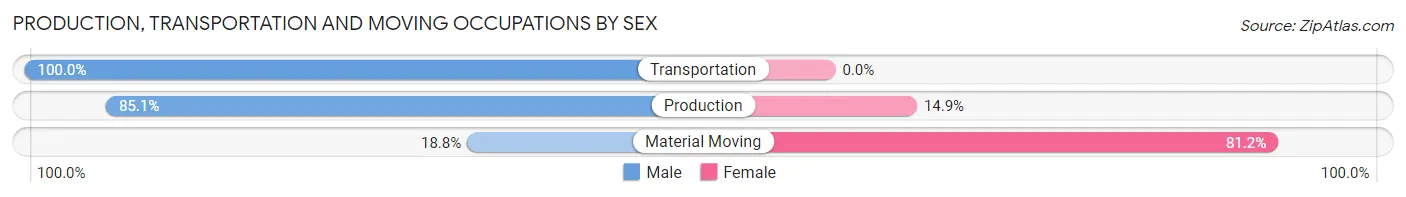
| Occupation | Male | Female |
| Production | 74 (85.1%) | 13 (14.9%) |
| Transportation | 159 (100.0%) | 0 (0.0%) |
| Material Moving | 16 (18.8%) | 69 (81.2%) |
| Total (Category) | 249 (75.2%) | 82 (24.8%) |
| Total (Overall) | 1,450 (59.8%) | 974 (40.2%) |
Employment Industries by Sex in Broadmoor
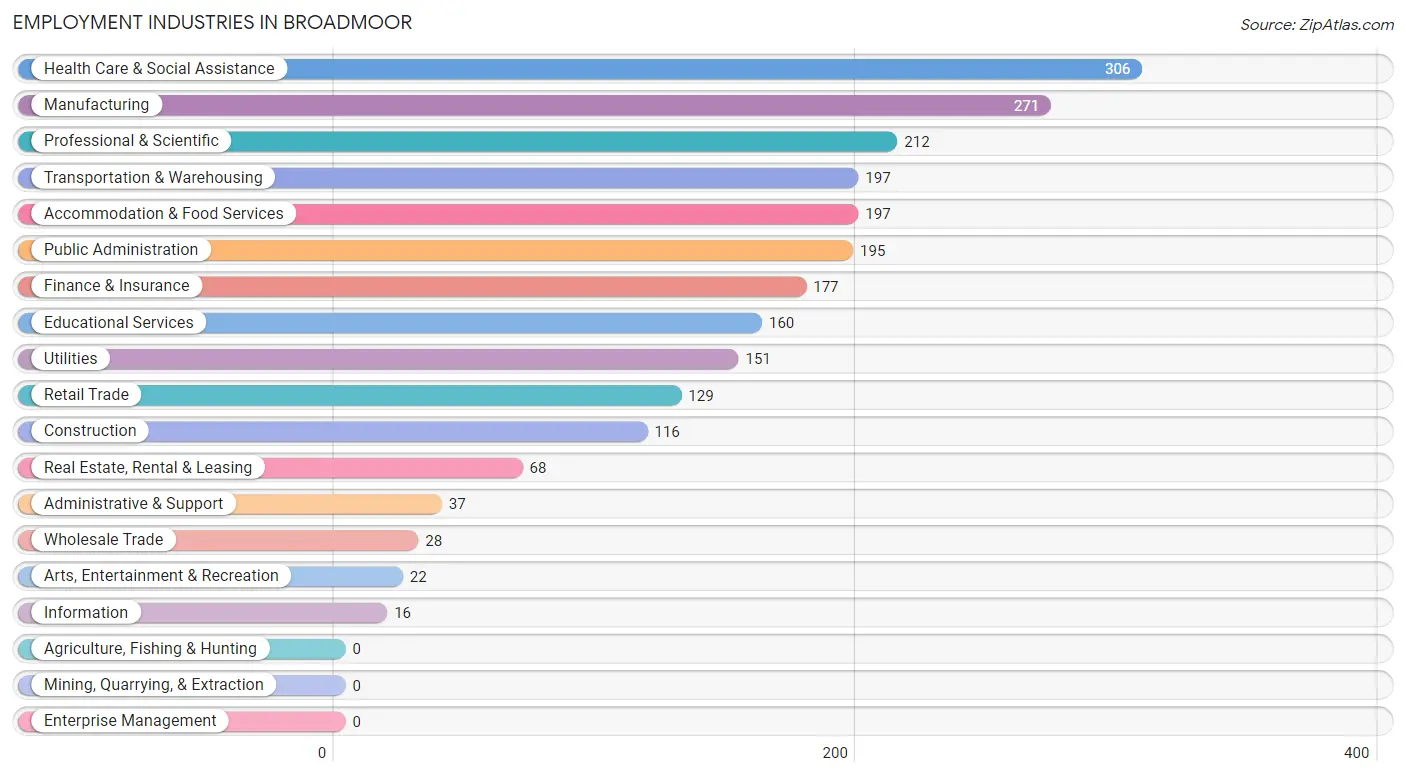
Employment Industries in Broadmoor
The major employment industries in Broadmoor include Health Care & Social Assistance (306 | 12.6%), Manufacturing (271 | 11.2%), Professional & Scientific (212 | 8.7%), Transportation & Warehousing (197 | 8.1%), and Accommodation & Food Services (197 | 8.1%).
Employment Industries by Sex in Broadmoor
The Broadmoor industries that see more men than women are Construction (100.0%), Wholesale Trade (100.0%), and Information (100.0%), whereas the industries that tend to have a higher number of women are Utilities (78.1%), Educational Services (69.4%), and Accommodation & Food Services (55.8%).

| Industry | Male | Female |
| Agriculture, Fishing & Hunting | 0 (0.0%) | 0 (0.0%) |
| Mining, Quarrying, & Extraction | 0 (0.0%) | 0 (0.0%) |
| Construction | 116 (100.0%) | 0 (0.0%) |
| Manufacturing | 178 (65.7%) | 93 (34.3%) |
| Wholesale Trade | 28 (100.0%) | 0 (0.0%) |
| Retail Trade | 91 (70.5%) | 38 (29.5%) |
| Transportation & Warehousing | 176 (89.3%) | 21 (10.7%) |
| Utilities | 33 (21.8%) | 118 (78.1%) |
| Information | 16 (100.0%) | 0 (0.0%) |
| Finance & Insurance | 85 (48.0%) | 92 (52.0%) |
| Real Estate, Rental & Leasing | 52 (76.5%) | 16 (23.5%) |
| Professional & Scientific | 134 (63.2%) | 78 (36.8%) |
| Enterprise Management | 0 (0.0%) | 0 (0.0%) |
| Administrative & Support | 24 (64.9%) | 13 (35.1%) |
| Educational Services | 49 (30.6%) | 111 (69.4%) |
| Health Care & Social Assistance | 136 (44.4%) | 170 (55.6%) |
| Arts, Entertainment & Recreation | 22 (100.0%) | 0 (0.0%) |
| Accommodation & Food Services | 87 (44.2%) | 110 (55.8%) |
| Public Administration | 124 (63.6%) | 71 (36.4%) |
| Total | 1,450 (59.8%) | 974 (40.2%) |
Education in Broadmoor
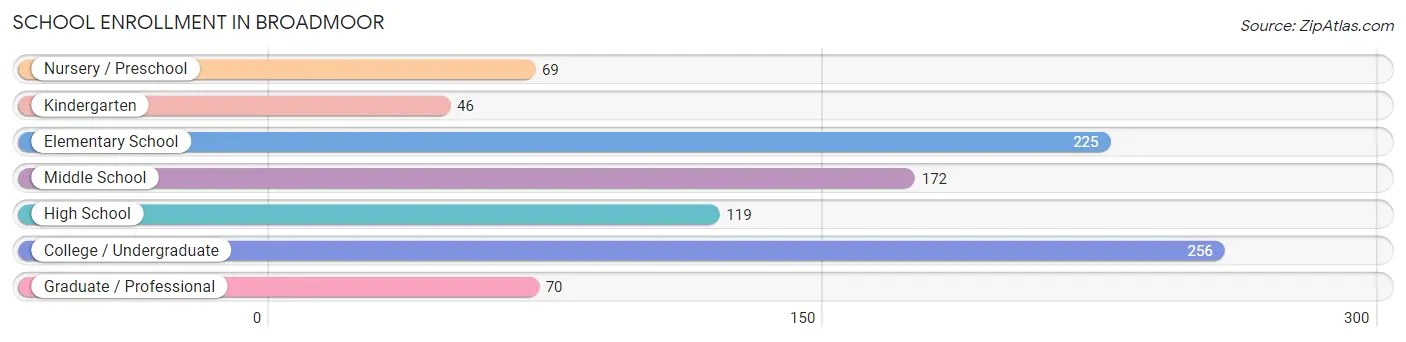
School Enrollment in Broadmoor
The most common levels of schooling among the 957 students in Broadmoor are college / undergraduate (256 | 26.8%), elementary school (225 | 23.5%), and middle school (172 | 18.0%).
| School Level | # Students | % Students |
| Nursery / Preschool | 69 | 7.2% |
| Kindergarten | 46 | 4.8% |
| Elementary School | 225 | 23.5% |
| Middle School | 172 | 18.0% |
| High School | 119 | 12.4% |
| College / Undergraduate | 256 | 26.8% |
| Graduate / Professional | 70 | 7.3% |
| Total | 957 | 100.0% |
School Enrollment by Age by Funding Source in Broadmoor
Out of a total of 957 students who are enrolled in schools in Broadmoor, 289 (30.2%) attend a private institution, while the remaining 668 (69.8%) are enrolled in public schools. The age group of 3 to 4 year olds has the highest likelihood of being enrolled in private schools, with 19 (100.0% in the age bracket) enrolled. Conversely, the age group of 18 to 19 year olds has the lowest likelihood of being enrolled in a private school, with 12 (100.0% in the age bracket) attending a public institution.
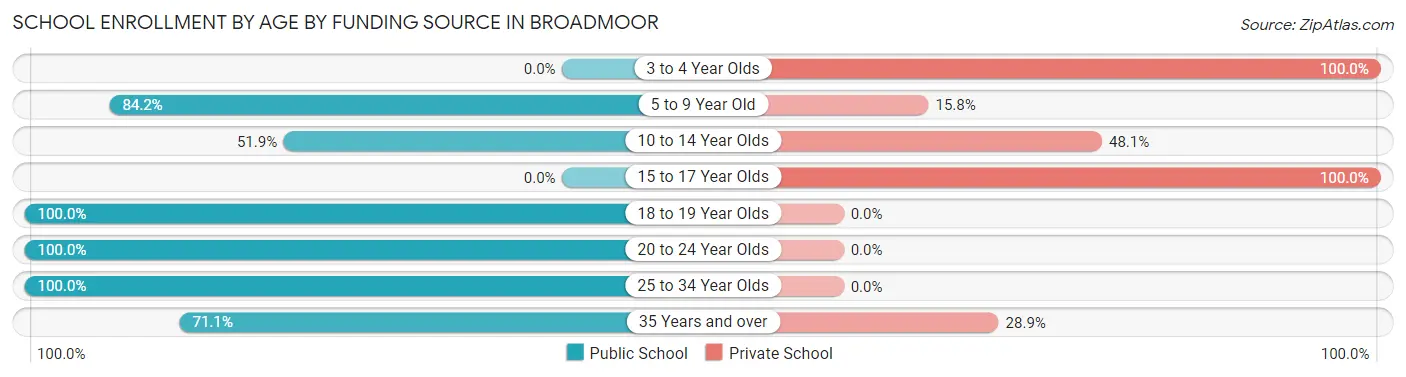
| Age Bracket | Public School | Private School |
| 3 to 4 Year Olds | 0 (0.0%) | 19 (100.0%) |
| 5 to 9 Year Old | 245 (84.2%) | 46 (15.8%) |
| 10 to 14 Year Olds | 125 (51.9%) | 116 (48.1%) |
| 15 to 17 Year Olds | 0 (0.0%) | 80 (100.0%) |
| 18 to 19 Year Olds | 12 (100.0%) | 0 (0.0%) |
| 20 to 24 Year Olds | 182 (100.0%) | 0 (0.0%) |
| 25 to 34 Year Olds | 35 (100.0%) | 0 (0.0%) |
| 35 Years and over | 69 (71.1%) | 28 (28.9%) |
| Total | 668 (69.8%) | 289 (30.2%) |
Educational Attainment by Field of Study in Broadmoor
Business (379 | 29.0%), arts & humanities (161 | 12.3%), science & technology (144 | 11.0%), social sciences (100 | 7.6%), and bio, nature & agricultural (96 | 7.3%) are the most common fields of study among 1,307 individuals in Broadmoor who have obtained a bachelor's degree or higher.
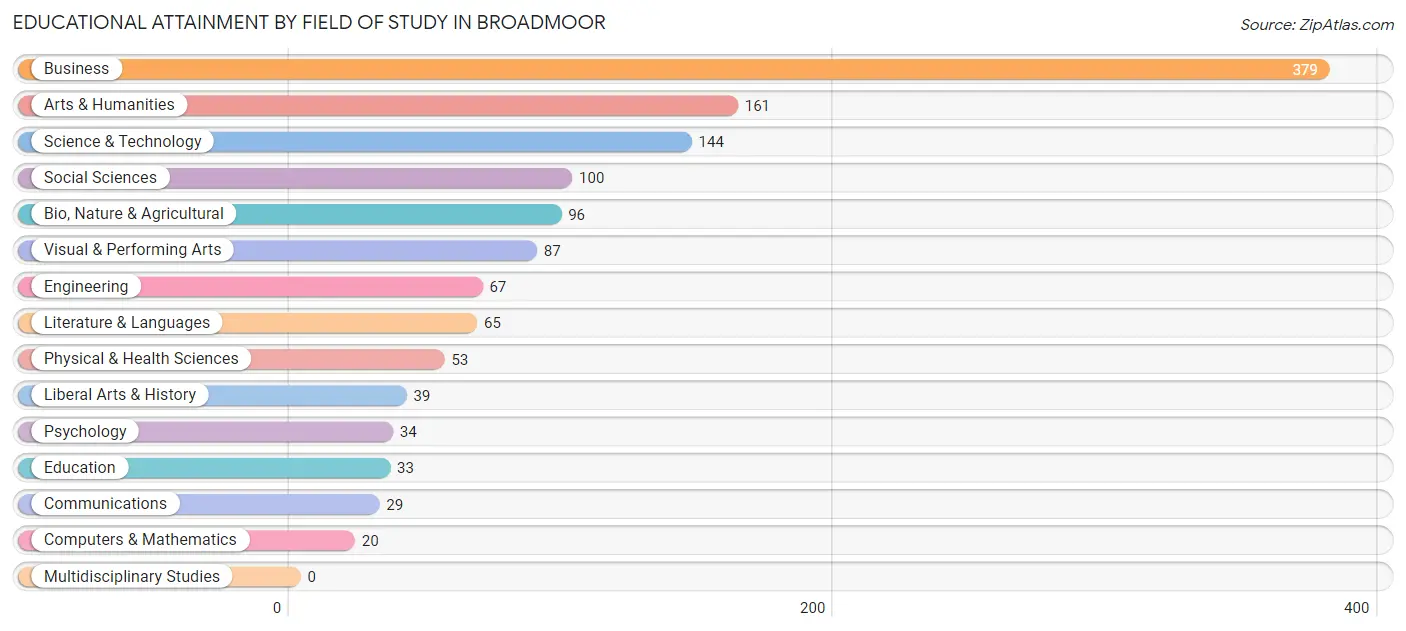
| Field of Study | # Graduates | % Graduates |
| Computers & Mathematics | 20 | 1.5% |
| Bio, Nature & Agricultural | 96 | 7.3% |
| Physical & Health Sciences | 53 | 4.1% |
| Psychology | 34 | 2.6% |
| Social Sciences | 100 | 7.6% |
| Engineering | 67 | 5.1% |
| Multidisciplinary Studies | 0 | 0.0% |
| Science & Technology | 144 | 11.0% |
| Business | 379 | 29.0% |
| Education | 33 | 2.5% |
| Literature & Languages | 65 | 5.0% |
| Liberal Arts & History | 39 | 3.0% |
| Visual & Performing Arts | 87 | 6.7% |
| Communications | 29 | 2.2% |
| Arts & Humanities | 161 | 12.3% |
| Total | 1,307 | 100.0% |
Transportation & Commute in Broadmoor
Vehicle Availability by Sex in Broadmoor
The most prevalent vehicle ownership categories in Broadmoor are males with 3 vehicles (623, accounting for 43.0%) and females with 3 vehicles (234, making up 64.0%).
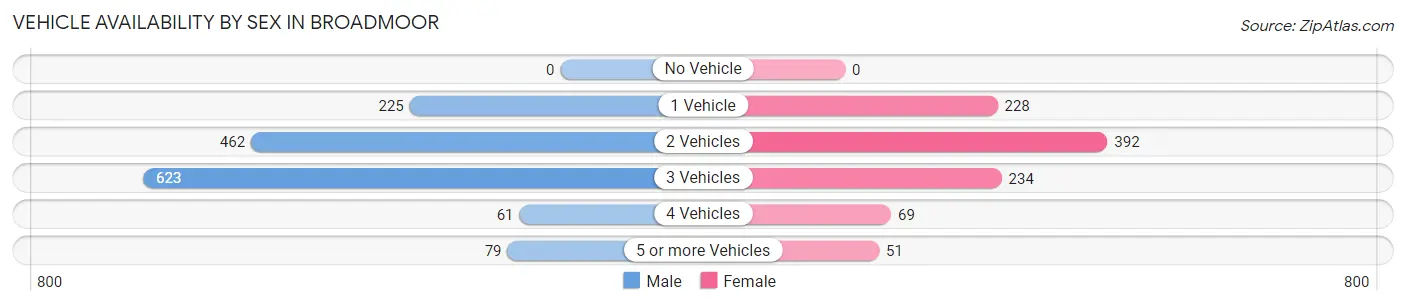
| Vehicles Available | Male | Female |
| No Vehicle | 0 (0.0%) | 0 (0.0%) |
| 1 Vehicle | 225 (15.5%) | 228 (23.4%) |
| 2 Vehicles | 462 (31.9%) | 392 (40.3%) |
| 3 Vehicles | 623 (43.0%) | 234 (24.0%) |
| 4 Vehicles | 61 (4.2%) | 69 (7.1%) |
| 5 or more Vehicles | 79 (5.4%) | 51 (5.2%) |
| Total | 1,450 (100.0%) | 974 (100.0%) |
Commute Time in Broadmoor
The most frequently occuring commute durations in Broadmoor are 30 to 34 minutes (411 commuters, 21.3%), 15 to 19 minutes (335 commuters, 17.4%), and 20 to 24 minutes (245 commuters, 12.7%).
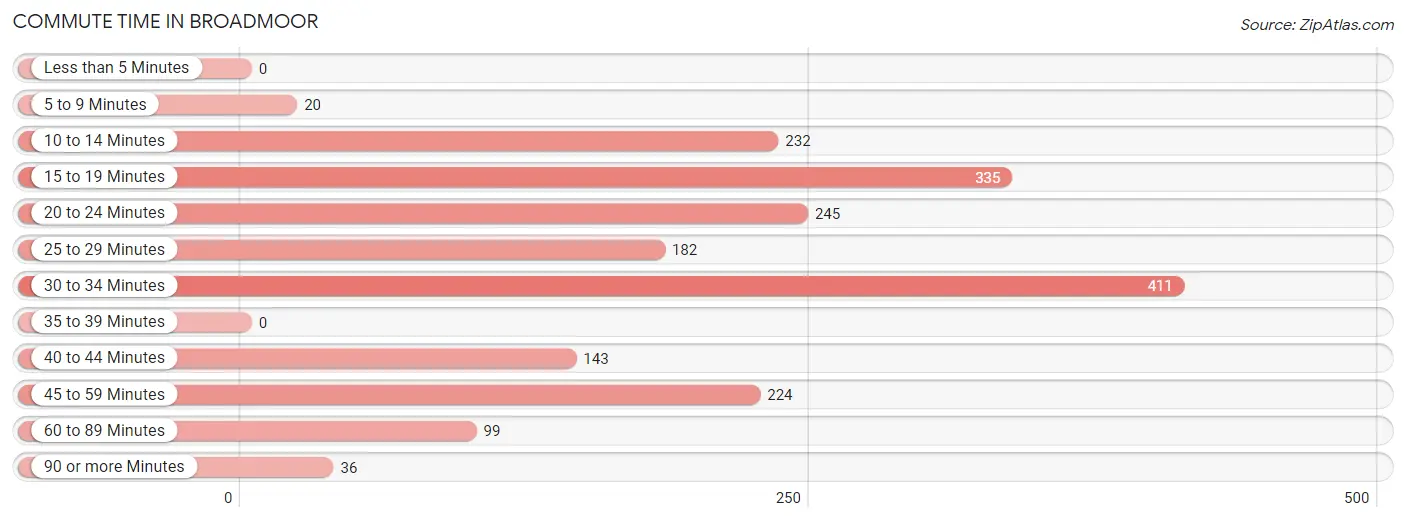
| Commute Time | # Commuters | % Commuters |
| Less than 5 Minutes | 0 | 0.0% |
| 5 to 9 Minutes | 20 | 1.0% |
| 10 to 14 Minutes | 232 | 12.0% |
| 15 to 19 Minutes | 335 | 17.4% |
| 20 to 24 Minutes | 245 | 12.7% |
| 25 to 29 Minutes | 182 | 9.4% |
| 30 to 34 Minutes | 411 | 21.3% |
| 35 to 39 Minutes | 0 | 0.0% |
| 40 to 44 Minutes | 143 | 7.4% |
| 45 to 59 Minutes | 224 | 11.6% |
| 60 to 89 Minutes | 99 | 5.1% |
| 90 or more Minutes | 36 | 1.9% |
Commute Time by Sex in Broadmoor
The most common commute times in Broadmoor are 30 to 34 minutes (250 commuters, 22.6%) for males and 15 to 19 minutes (227 commuters, 27.7%) for females.
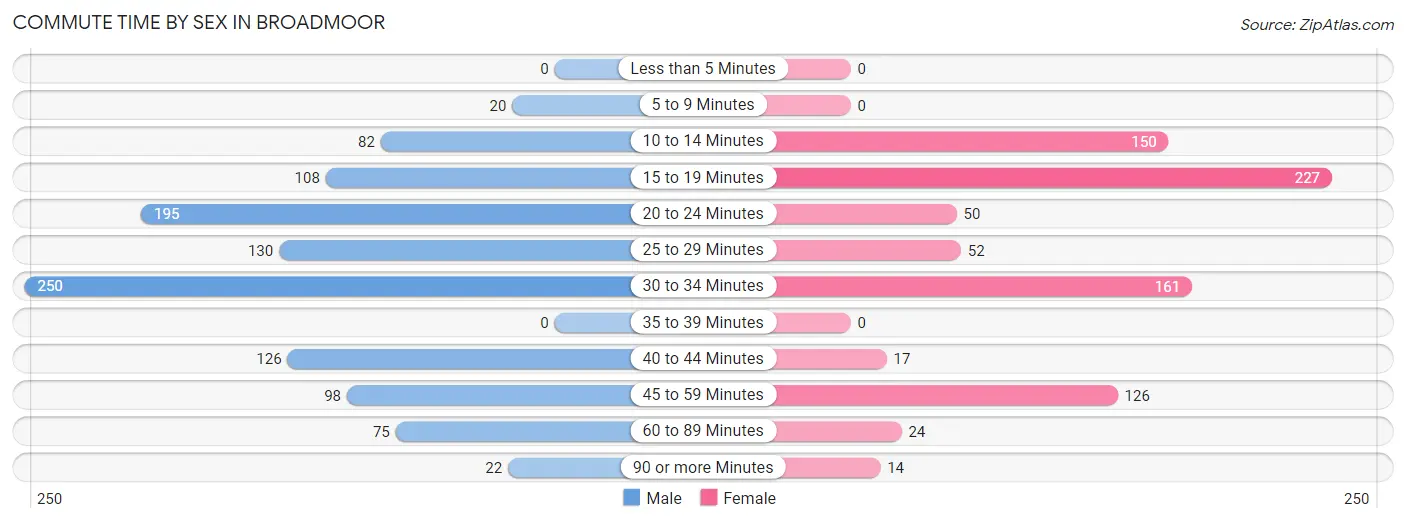
| Commute Time | Male | Female |
| Less than 5 Minutes | 0 (0.0%) | 0 (0.0%) |
| 5 to 9 Minutes | 20 (1.8%) | 0 (0.0%) |
| 10 to 14 Minutes | 82 (7.4%) | 150 (18.3%) |
| 15 to 19 Minutes | 108 (9.8%) | 227 (27.7%) |
| 20 to 24 Minutes | 195 (17.6%) | 50 (6.1%) |
| 25 to 29 Minutes | 130 (11.7%) | 52 (6.3%) |
| 30 to 34 Minutes | 250 (22.6%) | 161 (19.6%) |
| 35 to 39 Minutes | 0 (0.0%) | 0 (0.0%) |
| 40 to 44 Minutes | 126 (11.4%) | 17 (2.1%) |
| 45 to 59 Minutes | 98 (8.9%) | 126 (15.3%) |
| 60 to 89 Minutes | 75 (6.8%) | 24 (2.9%) |
| 90 or more Minutes | 22 (2.0%) | 14 (1.7%) |
Time of Departure to Work by Sex in Broadmoor
The most frequent times of departure to work in Broadmoor are 7:30 AM to 7:59 AM (260, 23.5%) for males and 12:00 PM to 3:59 PM (265, 32.3%) for females.
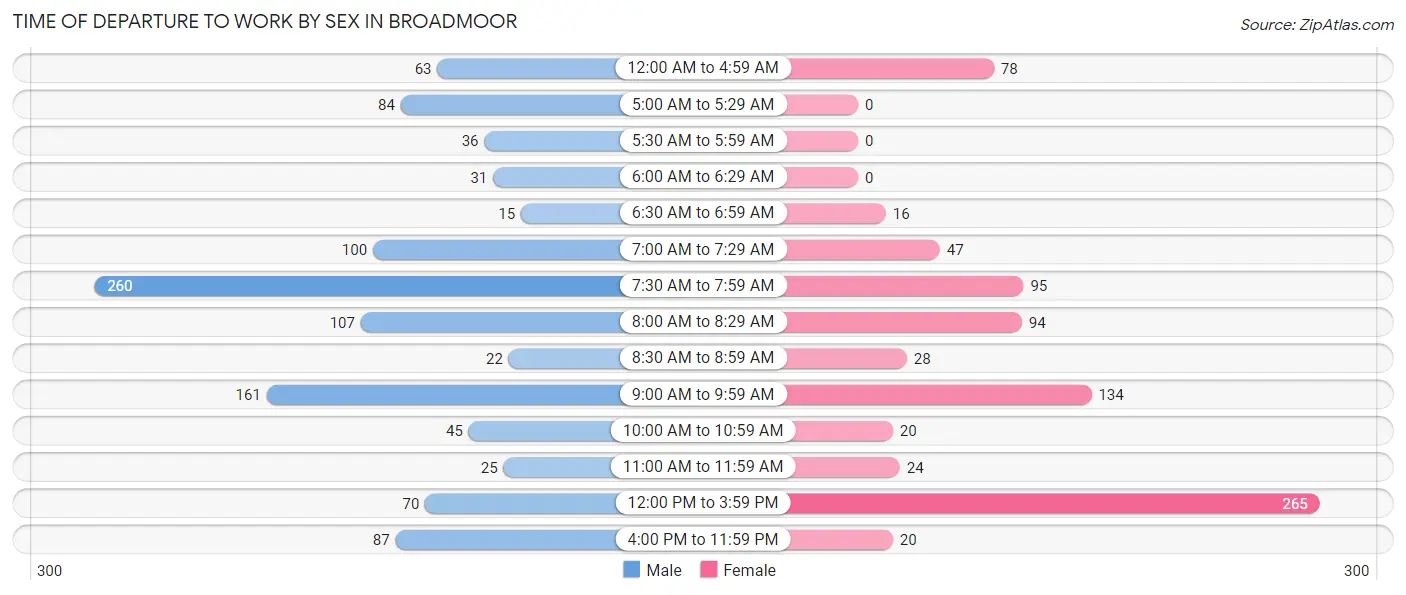
| Time of Departure | Male | Female |
| 12:00 AM to 4:59 AM | 63 (5.7%) | 78 (9.5%) |
| 5:00 AM to 5:29 AM | 84 (7.6%) | 0 (0.0%) |
| 5:30 AM to 5:59 AM | 36 (3.3%) | 0 (0.0%) |
| 6:00 AM to 6:29 AM | 31 (2.8%) | 0 (0.0%) |
| 6:30 AM to 6:59 AM | 15 (1.4%) | 16 (1.9%) |
| 7:00 AM to 7:29 AM | 100 (9.0%) | 47 (5.7%) |
| 7:30 AM to 7:59 AM | 260 (23.5%) | 95 (11.6%) |
| 8:00 AM to 8:29 AM | 107 (9.7%) | 94 (11.5%) |
| 8:30 AM to 8:59 AM | 22 (2.0%) | 28 (3.4%) |
| 9:00 AM to 9:59 AM | 161 (14.6%) | 134 (16.3%) |
| 10:00 AM to 10:59 AM | 45 (4.1%) | 20 (2.4%) |
| 11:00 AM to 11:59 AM | 25 (2.3%) | 24 (2.9%) |
| 12:00 PM to 3:59 PM | 70 (6.3%) | 265 (32.3%) |
| 4:00 PM to 11:59 PM | 87 (7.9%) | 20 (2.4%) |
| Total | 1,106 (100.0%) | 821 (100.0%) |
Housing Occupancy in Broadmoor
Occupancy by Ownership in Broadmoor
Of the total 1,349 dwellings in Broadmoor, owner-occupied units account for 969 (71.8%), while renter-occupied units make up 380 (28.2%).
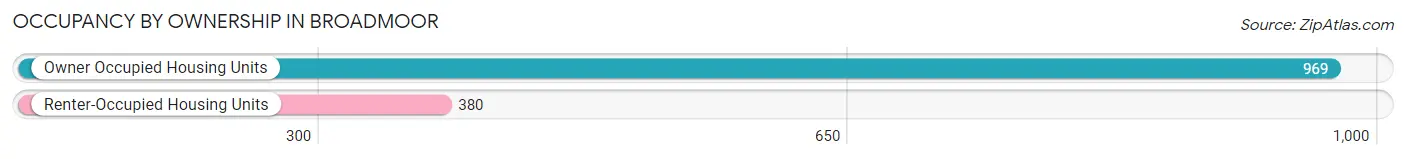
| Occupancy | # Housing Units | % Housing Units |
| Owner Occupied Housing Units | 969 | 71.8% |
| Renter-Occupied Housing Units | 380 | 28.2% |
| Total Occupied Housing Units | 1,349 | 100.0% |
Occupancy by Household Size in Broadmoor
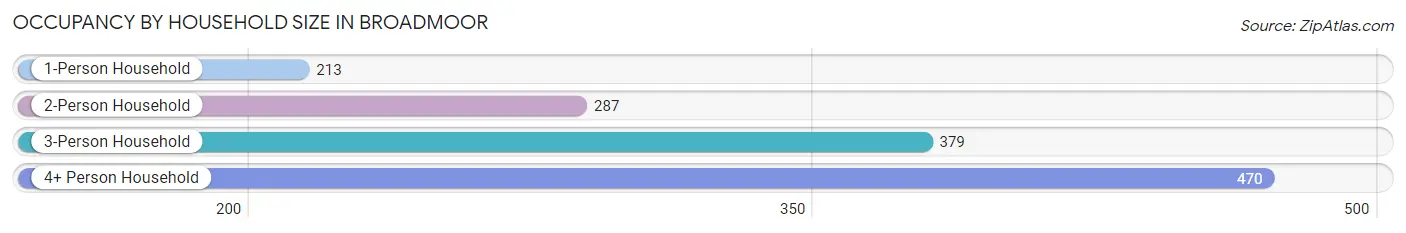
| Household Size | # Housing Units | % Housing Units |
| 1-Person Household | 213 | 15.8% |
| 2-Person Household | 287 | 21.3% |
| 3-Person Household | 379 | 28.1% |
| 4+ Person Household | 470 | 34.8% |
| Total Housing Units | 1,349 | 100.0% |
Occupancy by Ownership by Household Size in Broadmoor
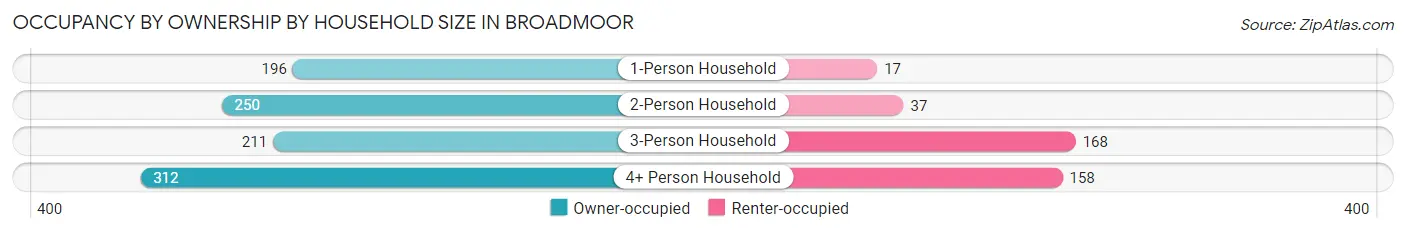
| Household Size | Owner-occupied | Renter-occupied |
| 1-Person Household | 196 (92.0%) | 17 (8.0%) |
| 2-Person Household | 250 (87.1%) | 37 (12.9%) |
| 3-Person Household | 211 (55.7%) | 168 (44.3%) |
| 4+ Person Household | 312 (66.4%) | 158 (33.6%) |
| Total Housing Units | 969 (71.8%) | 380 (28.2%) |
Occupancy by Educational Attainment in Broadmoor
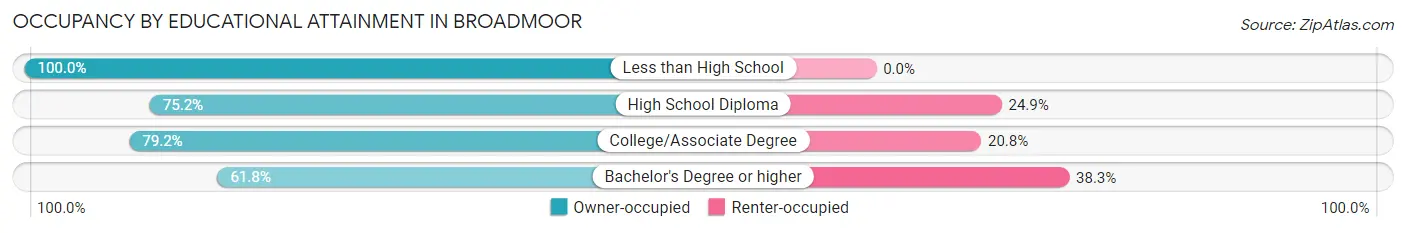
| Household Size | Owner-occupied | Renter-occupied |
| Less than High School | 19 (100.0%) | 0 (0.0%) |
| High School Diploma | 251 (75.1%) | 83 (24.8%) |
| College/Associate Degree | 381 (79.2%) | 100 (20.8%) |
| Bachelor's Degree or higher | 318 (61.8%) | 197 (38.3%) |
Occupancy by Age of Householder in Broadmoor
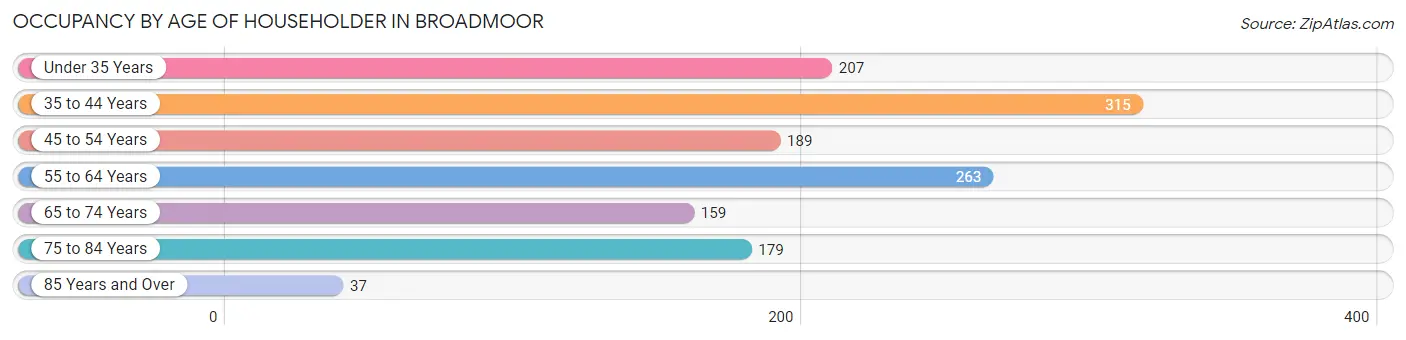
| Age Bracket | # Households | % Households |
| Under 35 Years | 207 | 15.3% |
| 35 to 44 Years | 315 | 23.4% |
| 45 to 54 Years | 189 | 14.0% |
| 55 to 64 Years | 263 | 19.5% |
| 65 to 74 Years | 159 | 11.8% |
| 75 to 84 Years | 179 | 13.3% |
| 85 Years and Over | 37 | 2.7% |
| Total | 1,349 | 100.0% |
Housing Finances in Broadmoor
Median Income by Occupancy in Broadmoor
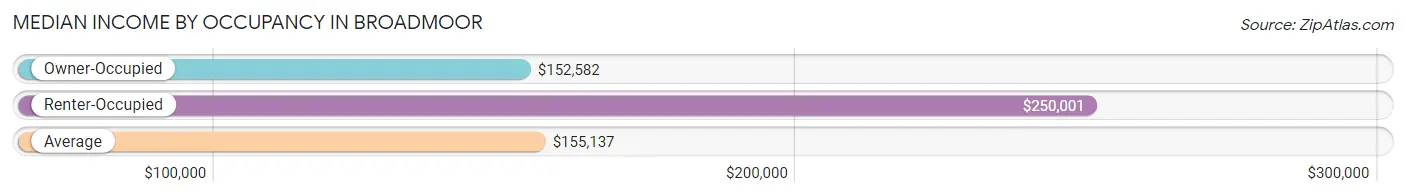
| Occupancy Type | # Households | Median Income |
| Owner-Occupied | 969 (71.8%) | $152,582 |
| Renter-Occupied | 380 (28.2%) | $250,001 |
| Average | 1,349 (100.0%) | $155,137 |
Occupancy by Householder Income Bracket in Broadmoor
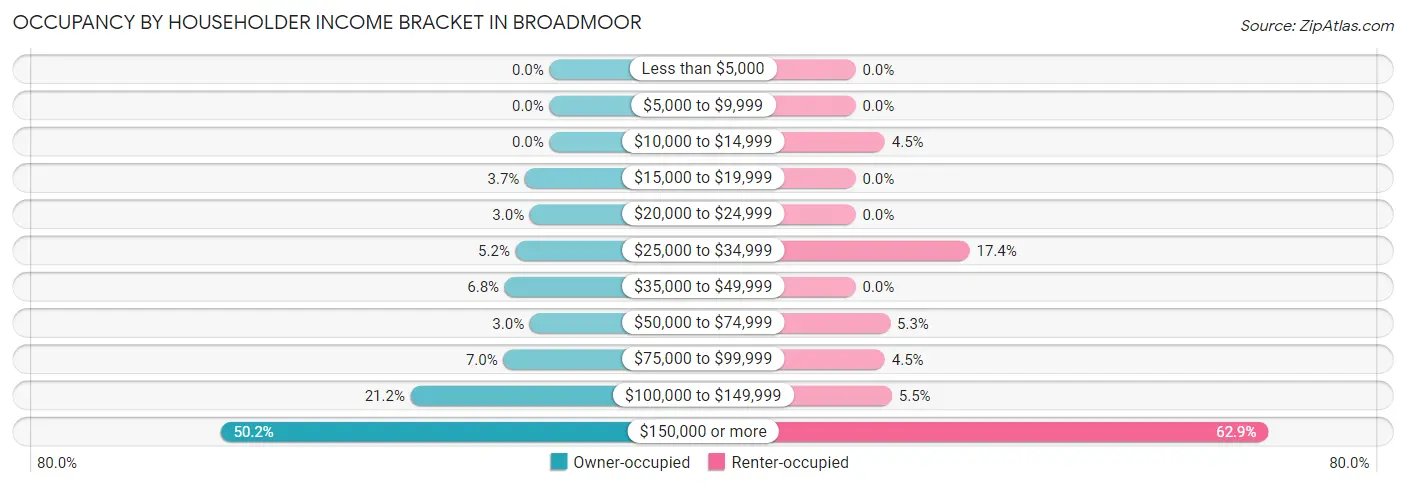
| Income Bracket | Owner-occupied | Renter-occupied |
| Less than $5,000 | 0 (0.0%) | 0 (0.0%) |
| $5,000 to $9,999 | 0 (0.0%) | 0 (0.0%) |
| $10,000 to $14,999 | 0 (0.0%) | 17 (4.5%) |
| $15,000 to $19,999 | 36 (3.7%) | 0 (0.0%) |
| $20,000 to $24,999 | 29 (3.0%) | 0 (0.0%) |
| $25,000 to $34,999 | 50 (5.2%) | 66 (17.4%) |
| $35,000 to $49,999 | 66 (6.8%) | 0 (0.0%) |
| $50,000 to $74,999 | 29 (3.0%) | 20 (5.3%) |
| $75,000 to $99,999 | 68 (7.0%) | 17 (4.5%) |
| $100,000 to $149,999 | 205 (21.2%) | 21 (5.5%) |
| $150,000 or more | 486 (50.1%) | 239 (62.9%) |
| Total | 969 (100.0%) | 380 (100.0%) |
Monthly Housing Cost Tiers in Broadmoor
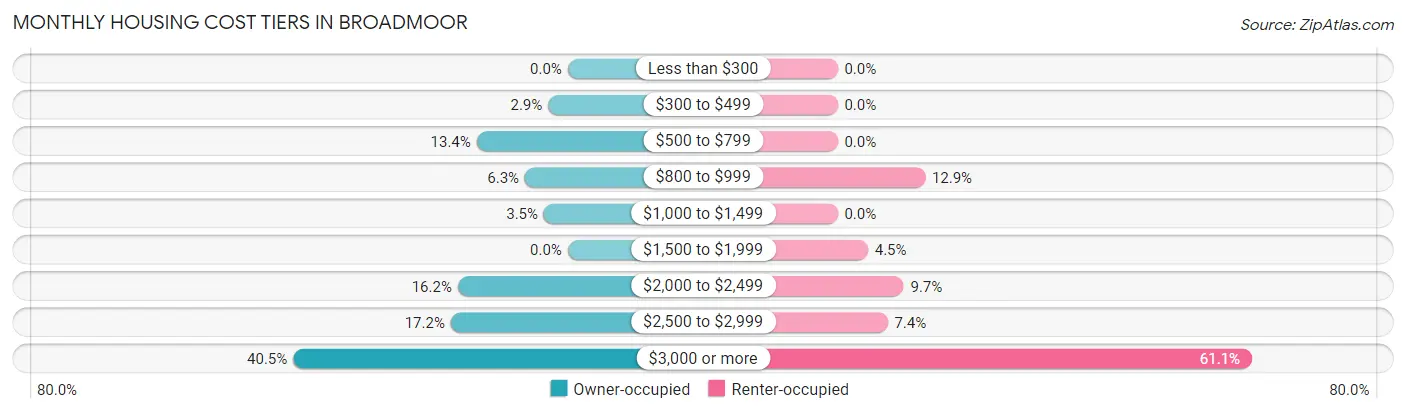
| Monthly Cost | Owner-occupied | Renter-occupied |
| Less than $300 | 0 (0.0%) | 0 (0.0%) |
| $300 to $499 | 28 (2.9%) | 0 (0.0%) |
| $500 to $799 | 130 (13.4%) | 0 (0.0%) |
| $800 to $999 | 61 (6.3%) | 49 (12.9%) |
| $1,000 to $1,499 | 34 (3.5%) | 0 (0.0%) |
| $1,500 to $1,999 | 0 (0.0%) | 17 (4.5%) |
| $2,000 to $2,499 | 157 (16.2%) | 37 (9.7%) |
| $2,500 to $2,999 | 167 (17.2%) | 28 (7.4%) |
| $3,000 or more | 392 (40.5%) | 232 (61.1%) |
| Total | 969 (100.0%) | 380 (100.0%) |
Physical Housing Characteristics in Broadmoor
Housing Structures in Broadmoor
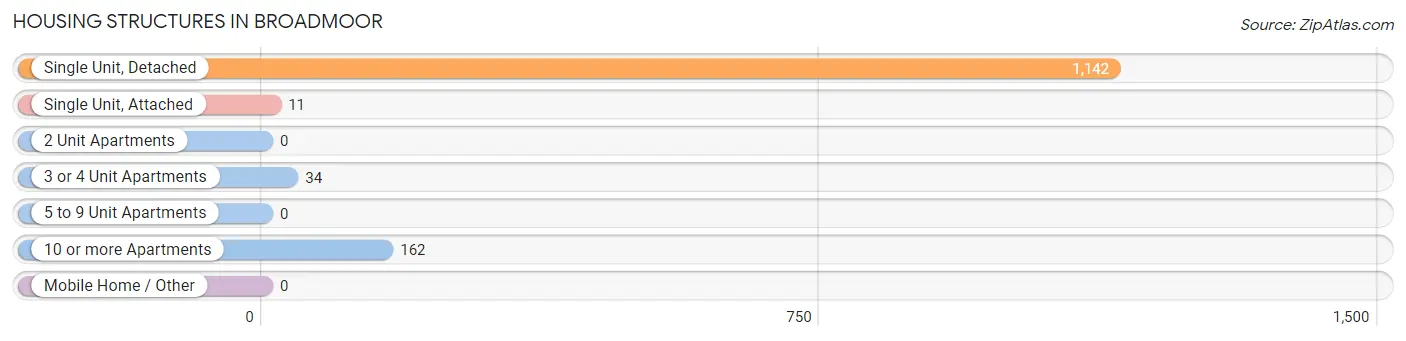
| Structure Type | # Housing Units | % Housing Units |
| Single Unit, Detached | 1,142 | 84.7% |
| Single Unit, Attached | 11 | 0.8% |
| 2 Unit Apartments | 0 | 0.0% |
| 3 or 4 Unit Apartments | 34 | 2.5% |
| 5 to 9 Unit Apartments | 0 | 0.0% |
| 10 or more Apartments | 162 | 12.0% |
| Mobile Home / Other | 0 | 0.0% |
| Total | 1,349 | 100.0% |
Housing Structures by Occupancy in Broadmoor
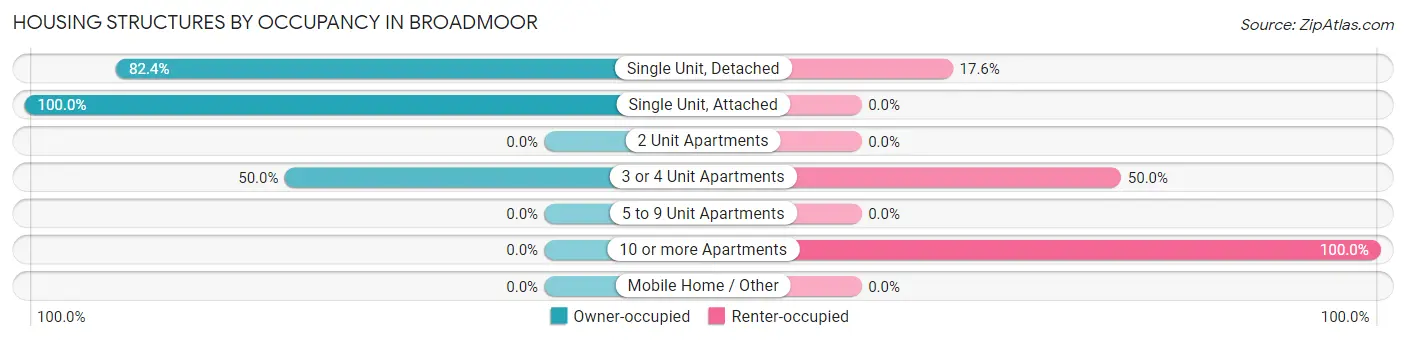
| Structure Type | Owner-occupied | Renter-occupied |
| Single Unit, Detached | 941 (82.4%) | 201 (17.6%) |
| Single Unit, Attached | 11 (100.0%) | 0 (0.0%) |
| 2 Unit Apartments | 0 (0.0%) | 0 (0.0%) |
| 3 or 4 Unit Apartments | 17 (50.0%) | 17 (50.0%) |
| 5 to 9 Unit Apartments | 0 (0.0%) | 0 (0.0%) |
| 10 or more Apartments | 0 (0.0%) | 162 (100.0%) |
| Mobile Home / Other | 0 (0.0%) | 0 (0.0%) |
| Total | 969 (71.8%) | 380 (28.2%) |
Housing Structures by Number of Rooms in Broadmoor
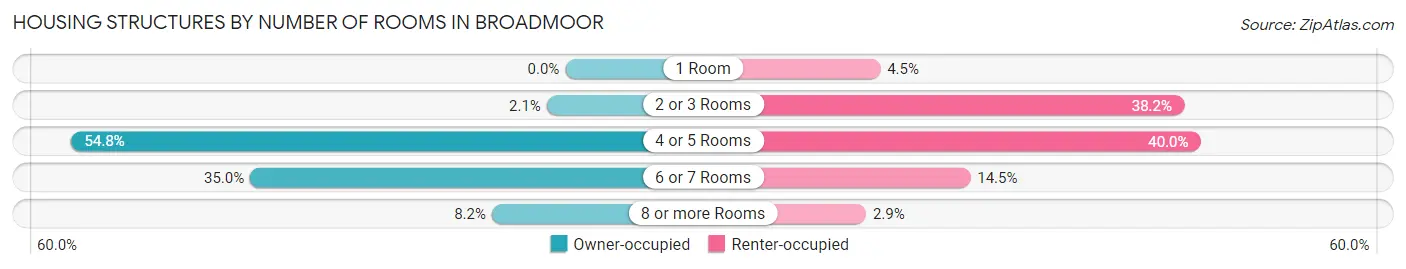
| Number of Rooms | Owner-occupied | Renter-occupied |
| 1 Room | 0 (0.0%) | 17 (4.5%) |
| 2 or 3 Rooms | 20 (2.1%) | 145 (38.2%) |
| 4 or 5 Rooms | 531 (54.8%) | 152 (40.0%) |
| 6 or 7 Rooms | 339 (35.0%) | 55 (14.5%) |
| 8 or more Rooms | 79 (8.2%) | 11 (2.9%) |
| Total | 969 (100.0%) | 380 (100.0%) |
Housing Structure by Heating Type in Broadmoor
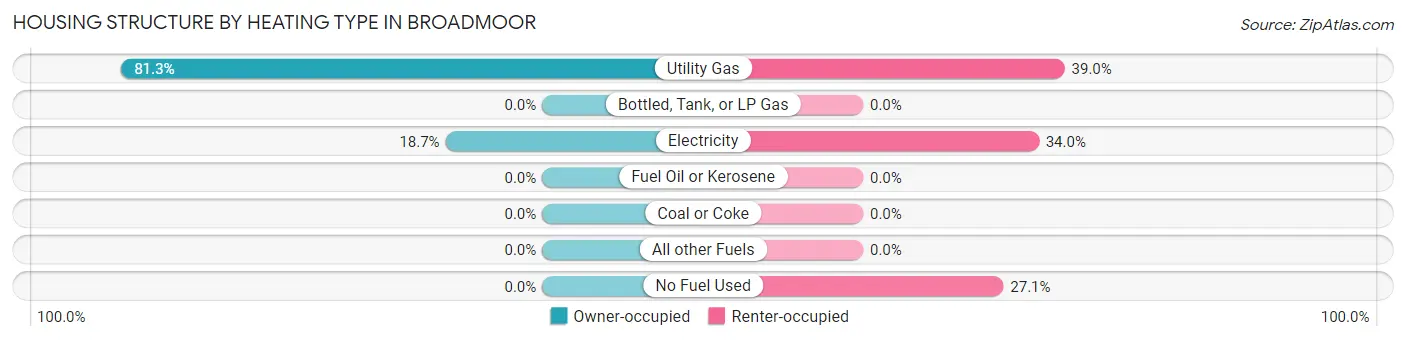
| Heating Type | Owner-occupied | Renter-occupied |
| Utility Gas | 788 (81.3%) | 148 (39.0%) |
| Bottled, Tank, or LP Gas | 0 (0.0%) | 0 (0.0%) |
| Electricity | 181 (18.7%) | 129 (34.0%) |
| Fuel Oil or Kerosene | 0 (0.0%) | 0 (0.0%) |
| Coal or Coke | 0 (0.0%) | 0 (0.0%) |
| All other Fuels | 0 (0.0%) | 0 (0.0%) |
| No Fuel Used | 0 (0.0%) | 103 (27.1%) |
| Total | 969 (100.0%) | 380 (100.0%) |
Household Vehicle Usage in Broadmoor
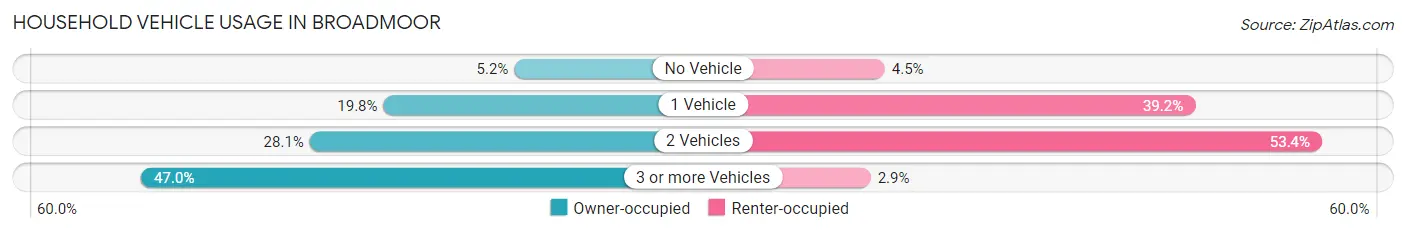
| Vehicles per Household | Owner-occupied | Renter-occupied |
| No Vehicle | 50 (5.2%) | 17 (4.5%) |
| 1 Vehicle | 192 (19.8%) | 149 (39.2%) |
| 2 Vehicles | 272 (28.1%) | 203 (53.4%) |
| 3 or more Vehicles | 455 (47.0%) | 11 (2.9%) |
| Total | 969 (100.0%) | 380 (100.0%) |
Real Estate & Mortgages in Broadmoor
Real Estate and Mortgage Overview in Broadmoor
| Characteristic | Without Mortgage | With Mortgage |
| Housing Units | 234 | 735 |
| Median Property Value | $993,800 | $1,145,000 |
| Median Household Income | $81,000 | $412 |
| Monthly Housing Costs | $598 | $392 |
| Real Estate Taxes | $3,754 | $0 |
Property Value by Mortgage Status in Broadmoor
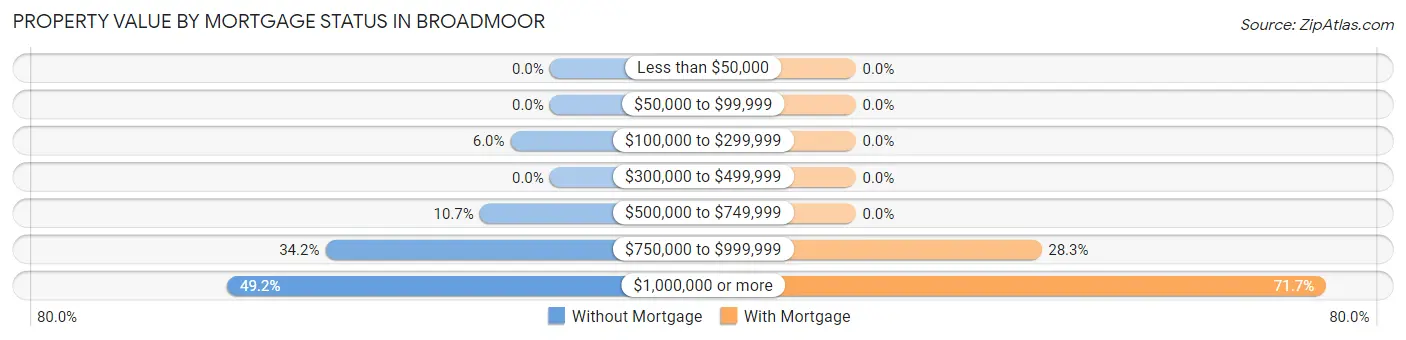
| Property Value | Without Mortgage | With Mortgage |
| Less than $50,000 | 0 (0.0%) | 0 (0.0%) |
| $50,000 to $99,999 | 0 (0.0%) | 0 (0.0%) |
| $100,000 to $299,999 | 14 (6.0%) | 0 (0.0%) |
| $300,000 to $499,999 | 0 (0.0%) | 0 (0.0%) |
| $500,000 to $749,999 | 25 (10.7%) | 0 (0.0%) |
| $750,000 to $999,999 | 80 (34.2%) | 208 (28.3%) |
| $1,000,000 or more | 115 (49.1%) | 527 (71.7%) |
| Total | 234 (100.0%) | 735 (100.0%) |
Household Income by Mortgage Status in Broadmoor
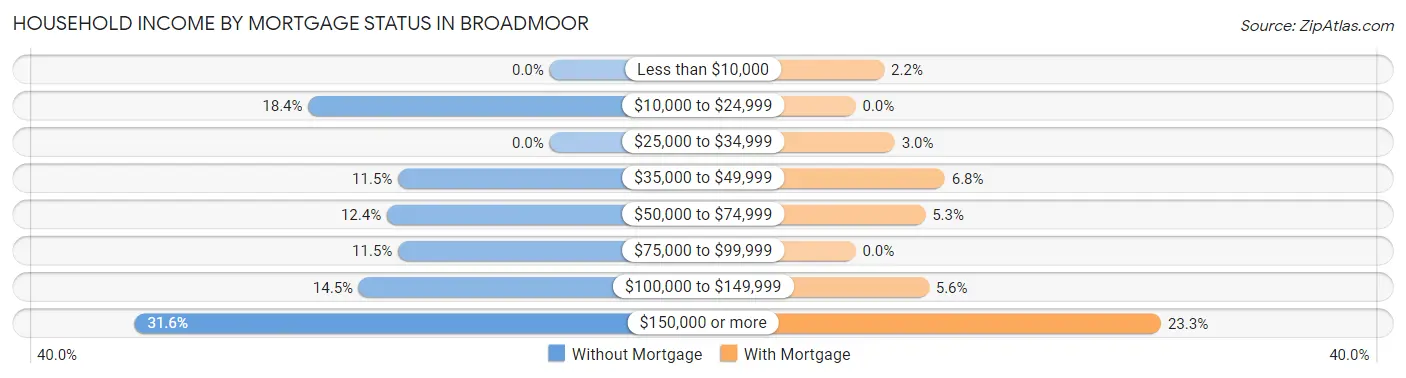
| Household Income | Without Mortgage | With Mortgage |
| Less than $10,000 | 0 (0.0%) | 16 (2.2%) |
| $10,000 to $24,999 | 43 (18.4%) | 0 (0.0%) |
| $25,000 to $34,999 | 0 (0.0%) | 22 (3.0%) |
| $35,000 to $49,999 | 27 (11.5%) | 50 (6.8%) |
| $50,000 to $74,999 | 29 (12.4%) | 39 (5.3%) |
| $75,000 to $99,999 | 27 (11.5%) | 0 (0.0%) |
| $100,000 to $149,999 | 34 (14.5%) | 41 (5.6%) |
| $150,000 or more | 74 (31.6%) | 171 (23.3%) |
| Total | 234 (100.0%) | 735 (100.0%) |
Property Value to Household Income Ratio in Broadmoor
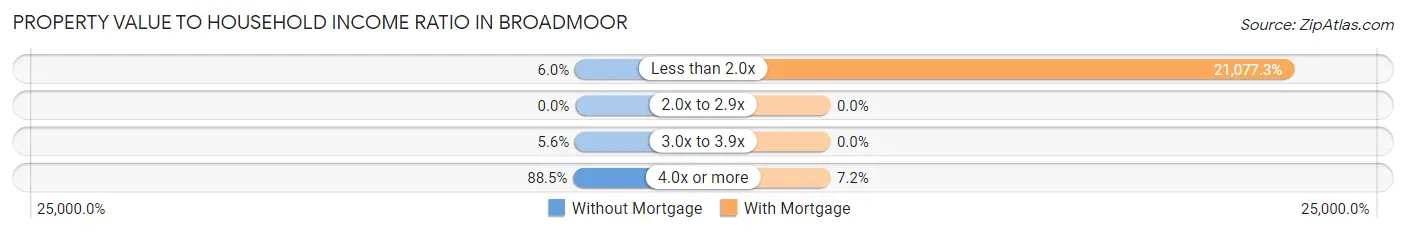
| Value-to-Income Ratio | Without Mortgage | With Mortgage |
| Less than 2.0x | 14 (6.0%) | 154,918 (21,077.3%) |
| 2.0x to 2.9x | 0 (0.0%) | 0 (0.0%) |
| 3.0x to 3.9x | 13 (5.6%) | 0 (0.0%) |
| 4.0x or more | 207 (88.5%) | 53 (7.2%) |
| Total | 234 (100.0%) | 735 (100.0%) |
Real Estate Taxes by Mortgage Status in Broadmoor
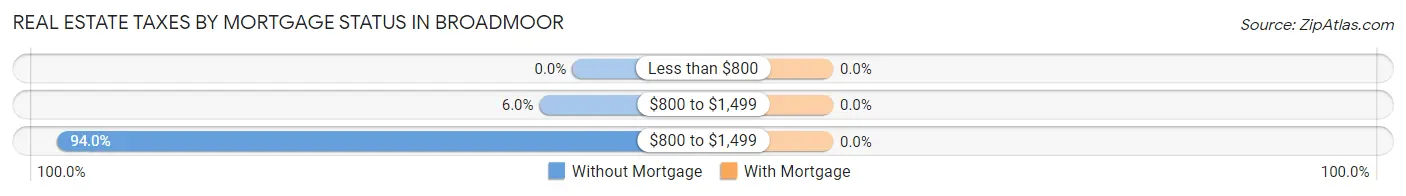
| Property Taxes | Without Mortgage | With Mortgage |
| Less than $800 | 0 (0.0%) | 0 (0.0%) |
| $800 to $1,499 | 14 (6.0%) | 0 (0.0%) |
| $800 to $1,499 | 220 (94.0%) | 0 (0.0%) |
| Total | 234 (100.0%) | 735 (100.0%) |
Health & Disability in Broadmoor
Health Insurance Coverage by Age in Broadmoor
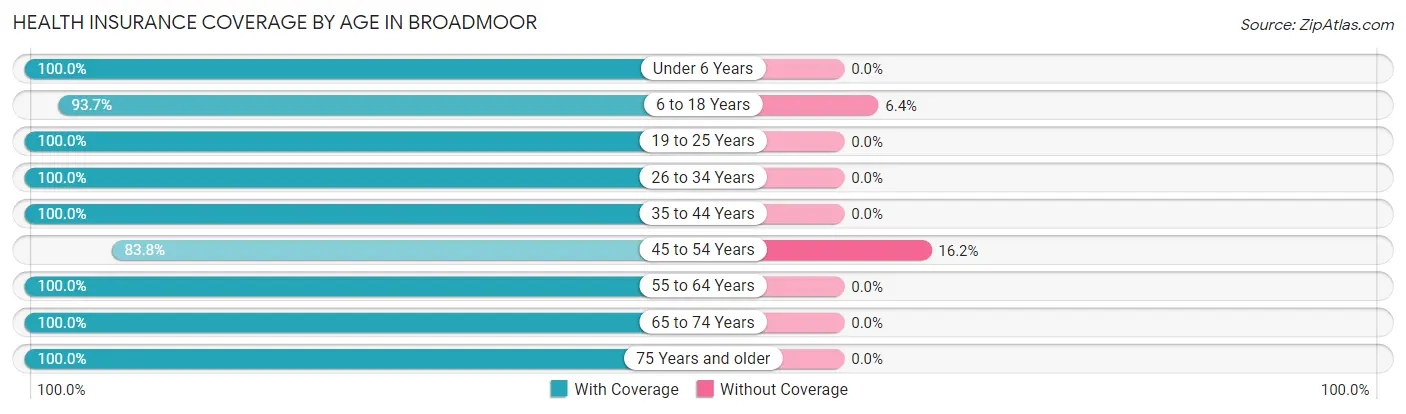
| Age Bracket | With Coverage | Without Coverage |
| Under 6 Years | 294 (100.0%) | 0 (0.0%) |
| 6 to 18 Years | 575 (93.6%) | 39 (6.4%) |
| 19 to 25 Years | 304 (100.0%) | 0 (0.0%) |
| 26 to 34 Years | 666 (100.0%) | 0 (0.0%) |
| 35 to 44 Years | 613 (100.0%) | 0 (0.0%) |
| 45 to 54 Years | 423 (83.8%) | 82 (16.2%) |
| 55 to 64 Years | 670 (100.0%) | 0 (0.0%) |
| 65 to 74 Years | 373 (100.0%) | 0 (0.0%) |
| 75 Years and older | 348 (100.0%) | 0 (0.0%) |
| Total | 4,266 (97.2%) | 121 (2.8%) |
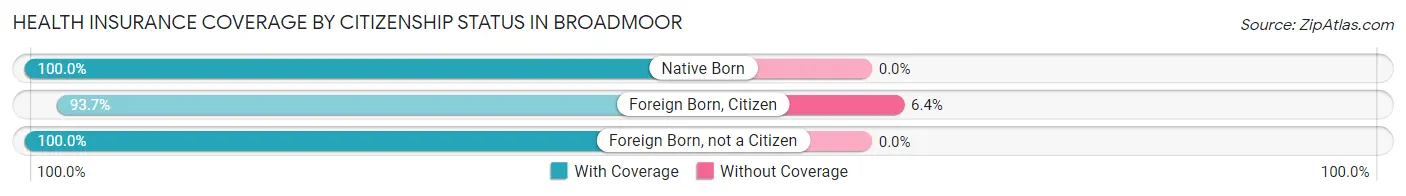
Health Insurance Coverage by Citizenship Status in Broadmoor
| Citizenship Status | With Coverage | Without Coverage |
| Native Born | 294 (100.0%) | 0 (0.0%) |
| Foreign Born, Citizen | 575 (93.6%) | 39 (6.4%) |
| Foreign Born, not a Citizen | 304 (100.0%) | 0 (0.0%) |
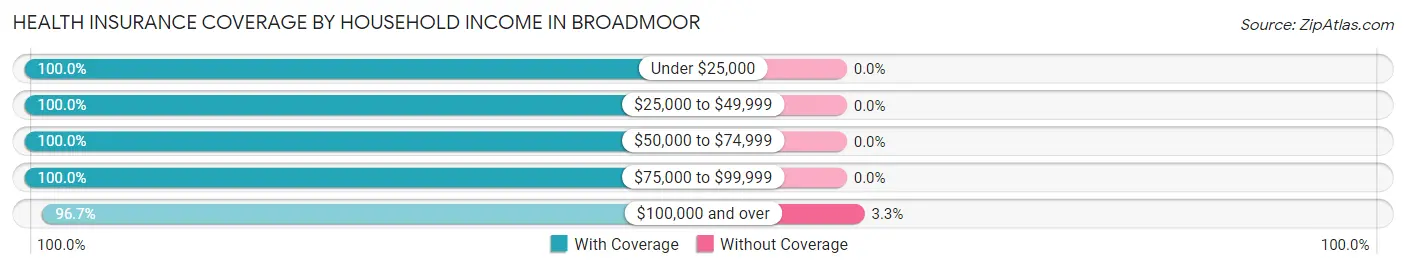
Health Insurance Coverage by Household Income in Broadmoor
| Household Income | With Coverage | Without Coverage |
| Under $25,000 | 100 (100.0%) | 0 (0.0%) |
| $25,000 to $49,999 | 376 (100.0%) | 0 (0.0%) |
| $50,000 to $74,999 | 67 (100.0%) | 0 (0.0%) |
| $75,000 to $99,999 | 201 (100.0%) | 0 (0.0%) |
| $100,000 and over | 3,522 (96.7%) | 121 (3.3%) |
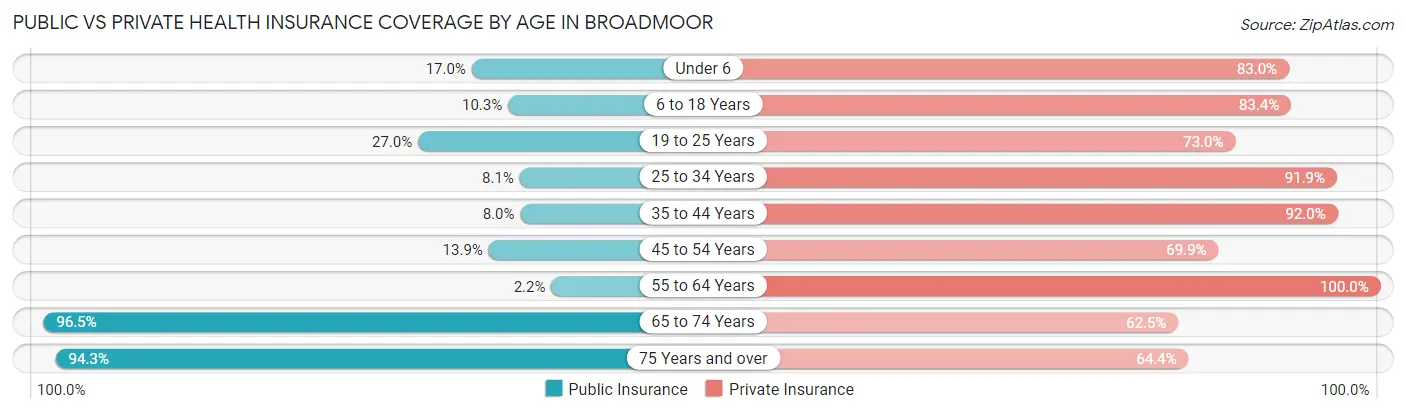
Public vs Private Health Insurance Coverage by Age in Broadmoor
| Age Bracket | Public Insurance | Private Insurance |
| Under 6 | 50 (17.0%) | 244 (83.0%) |
| 6 to 18 Years | 63 (10.3%) | 512 (83.4%) |
| 19 to 25 Years | 82 (27.0%) | 222 (73.0%) |
| 25 to 34 Years | 54 (8.1%) | 612 (91.9%) |
| 35 to 44 Years | 49 (8.0%) | 564 (92.0%) |
| 45 to 54 Years | 70 (13.9%) | 353 (69.9%) |
| 55 to 64 Years | 15 (2.2%) | 670 (100.0%) |
| 65 to 74 Years | 360 (96.5%) | 233 (62.5%) |
| 75 Years and over | 328 (94.3%) | 224 (64.4%) |
| Total | 1,071 (24.4%) | 3,634 (82.8%) |
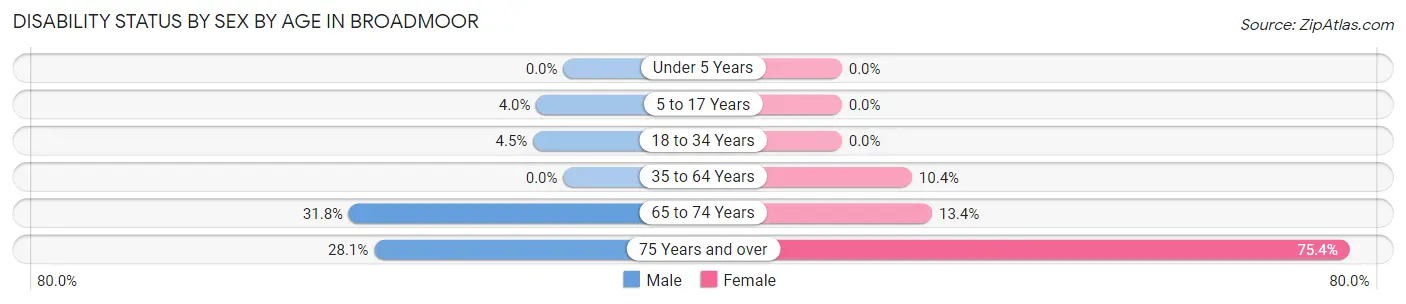
Disability Status by Sex by Age in Broadmoor
| Age Bracket | Male | Female |
| Under 5 Years | 0 (0.0%) | 0 (0.0%) |
| 5 to 17 Years | 13 (4.0%) | 0 (0.0%) |
| 18 to 34 Years | 31 (4.5%) | 0 (0.0%) |
| 35 to 64 Years | 0 (0.0%) | 94 (10.4%) |
| 65 to 74 Years | 57 (31.8%) | 26 (13.4%) |
| 75 Years and over | 43 (28.1%) | 147 (75.4%) |
Disability Class by Sex by Age in Broadmoor
Disability Class: Hearing Difficulty
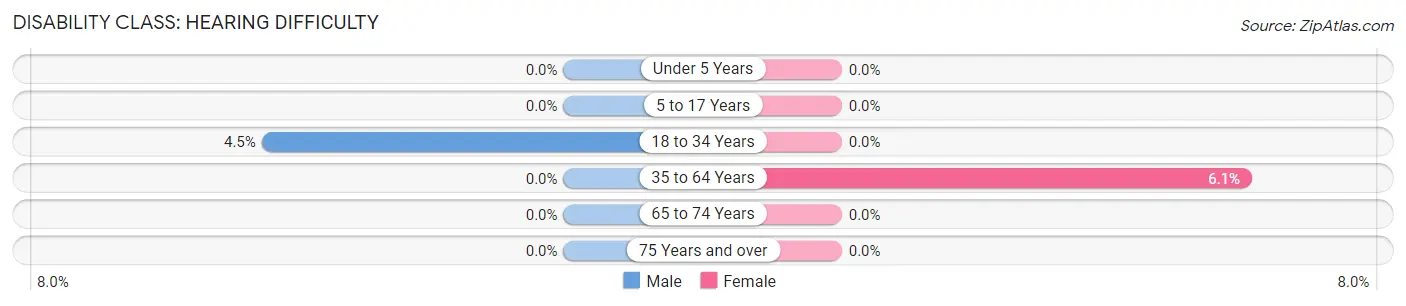
| Age Bracket | Male | Female |
| Under 5 Years | 0 (0.0%) | 0 (0.0%) |
| 5 to 17 Years | 0 (0.0%) | 0 (0.0%) |
| 18 to 34 Years | 31 (4.5%) | 0 (0.0%) |
| 35 to 64 Years | 0 (0.0%) | 55 (6.1%) |
| 65 to 74 Years | 0 (0.0%) | 0 (0.0%) |
| 75 Years and over | 0 (0.0%) | 0 (0.0%) |
Disability Class: Vision Difficulty
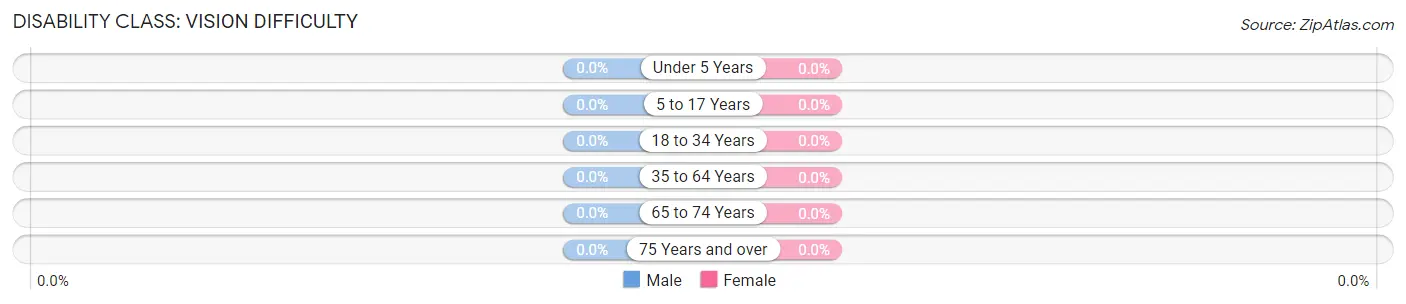
| Age Bracket | Male | Female |
| Under 5 Years | 0 (0.0%) | 0 (0.0%) |
| 5 to 17 Years | 0 (0.0%) | 0 (0.0%) |
| 18 to 34 Years | 0 (0.0%) | 0 (0.0%) |
| 35 to 64 Years | 0 (0.0%) | 0 (0.0%) |
| 65 to 74 Years | 0 (0.0%) | 0 (0.0%) |
| 75 Years and over | 0 (0.0%) | 0 (0.0%) |
Disability Class: Cognitive Difficulty
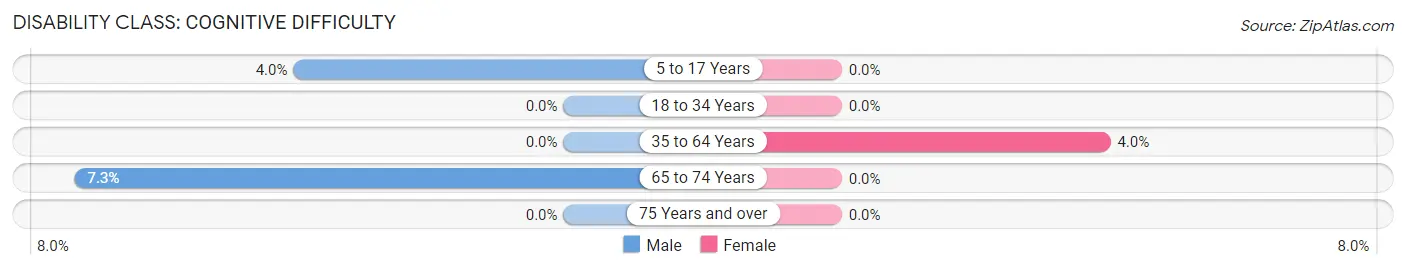
| Age Bracket | Male | Female |
| 5 to 17 Years | 13 (4.0%) | 0 (0.0%) |
| 18 to 34 Years | 0 (0.0%) | 0 (0.0%) |
| 35 to 64 Years | 0 (0.0%) | 36 (4.0%) |
| 65 to 74 Years | 13 (7.3%) | 0 (0.0%) |
| 75 Years and over | 0 (0.0%) | 0 (0.0%) |
Disability Class: Ambulatory Difficulty
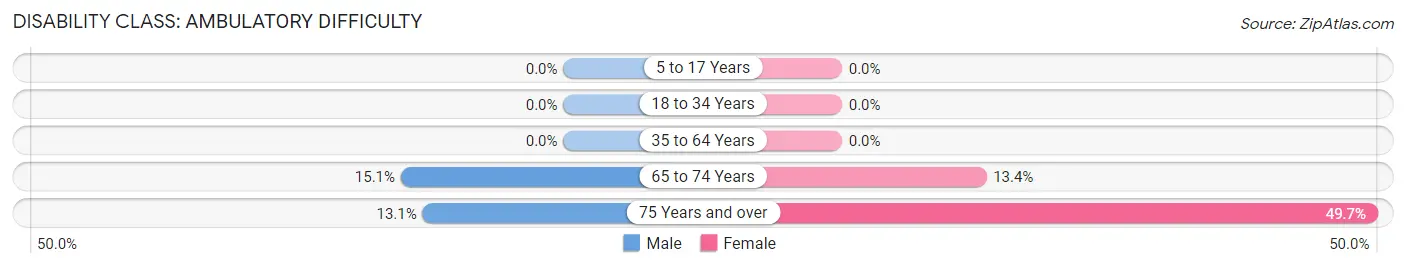
| Age Bracket | Male | Female |
| 5 to 17 Years | 0 (0.0%) | 0 (0.0%) |
| 18 to 34 Years | 0 (0.0%) | 0 (0.0%) |
| 35 to 64 Years | 0 (0.0%) | 0 (0.0%) |
| 65 to 74 Years | 27 (15.1%) | 26 (13.4%) |
| 75 Years and over | 20 (13.1%) | 97 (49.7%) |
Disability Class: Self-Care Difficulty
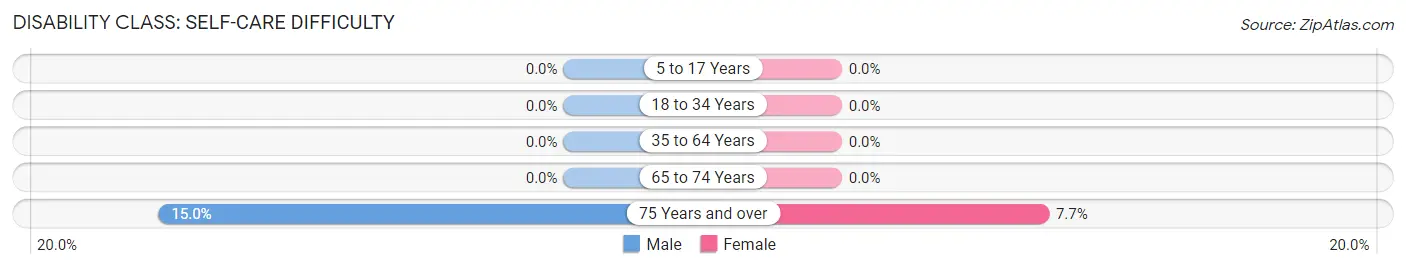
| Age Bracket | Male | Female |
| 5 to 17 Years | 0 (0.0%) | 0 (0.0%) |
| 18 to 34 Years | 0 (0.0%) | 0 (0.0%) |
| 35 to 64 Years | 0 (0.0%) | 0 (0.0%) |
| 65 to 74 Years | 0 (0.0%) | 0 (0.0%) |
| 75 Years and over | 23 (15.0%) | 15 (7.7%) |
Technology Access in Broadmoor
Computing Device Access in Broadmoor
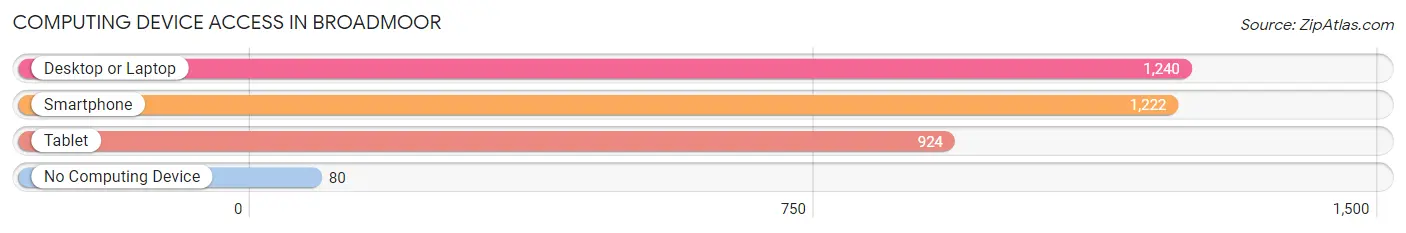
| Device Type | # Households | % Households |
| Desktop or Laptop | 1,240 | 91.9% |
| Smartphone | 1,222 | 90.6% |
| Tablet | 924 | 68.5% |
| No Computing Device | 80 | 5.9% |
| Total | 1,349 | 100.0% |
Internet Access in Broadmoor
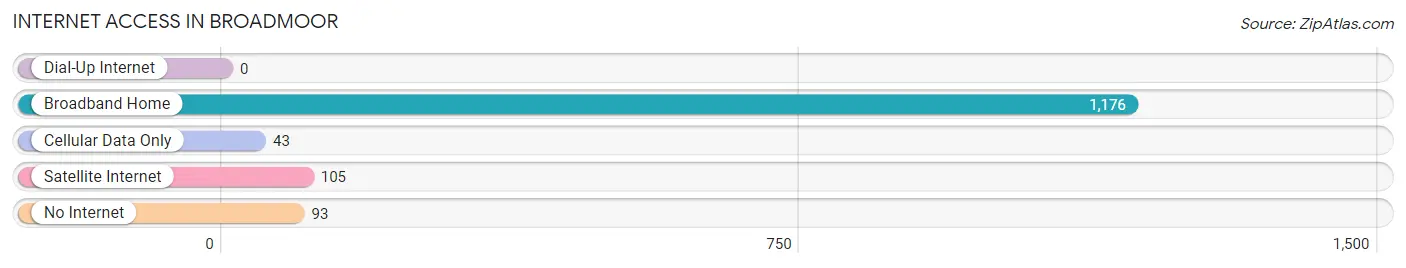
| Internet Type | # Households | % Households |
| Dial-Up Internet | 0 | 0.0% |
| Broadband Home | 1,176 | 87.2% |
| Cellular Data Only | 43 | 3.2% |
| Satellite Internet | 105 | 7.8% |
| No Internet | 93 | 6.9% |
| Total | 1,349 | 100.0% |
Broadmoor Summary
Broadmoor is a census-designated place (CDP) located in San Mateo County, California, United States. It is located in the San Francisco Bay Area, and is part of the larger city of Daly City. As of the 2010 census, the population of Broadmoor was 4,176.
History
The area now known as Broadmoor was originally inhabited by the Ohlone people, who were the first inhabitants of the San Francisco Bay Area. The Ohlone people were hunter-gatherers who lived in small villages and subsisted on the abundant natural resources of the area.
In the late 19th century, the area was settled by European immigrants, primarily from Italy and Ireland. The area was originally known as “Little Italy” due to the large number of Italian immigrants who settled there. The area was annexed by Daly City in 1925, and the name was changed to Broadmoor in 1927.
Geography
Broadmoor is located at 37°41'17" North, 122°25'17" West (37.688056, -122.421389). It is situated in the San Francisco Bay Area, and is bordered by Daly City to the north, Colma to the east, and San Bruno to the south. The CDP has a total area of 0.9 square miles, all of which is land.
The terrain of Broadmoor is mostly flat, with some rolling hills. The climate is mild, with temperatures rarely exceeding 80 degrees Fahrenheit in the summer and rarely dropping below 40 degrees Fahrenheit in the winter.
Economy
Broadmoor’s economy is largely based on the service industry. The largest employers in the area are the Daly City Medical Center, the San Mateo County Health System, and the San Mateo County Sheriff’s Office. Other major employers include the San Mateo County Fire Department, the San Mateo County Library, and the San Mateo County Parks and Recreation Department.
Demographics
As of the 2010 census, there were 4,176 people, 1,541 households, and 1,039 families residing in Broadmoor. The population density was 4,619.3 people per square mile. The racial makeup of the CDP was 57.2% White, 8.2% African American, 0.7% Native American, 16.2% Asian, 0.3% Pacific Islander, 11.3% from other races, and 6.3% from two or more races. Hispanic or Latino of any race were 24.3% of the population.
The median income for a household in the CDP was $60,938, and the median income for a family was $68,958. About 11.2% of families and 13.2% of the population were below the poverty line, including 17.2% of those under age 18 and 8.2% of those age 65 or over.
Common Questions
What is Per Capita Income in Broadmoor?
Per Capita income in Broadmoor is $53,654.
What is the Median Family Income in Broadmoor?
Median Family Income in Broadmoor is $156,326.
What is the Median Household income in Broadmoor?
Median Household Income in Broadmoor is $155,137.
What is Income or Wage Gap in Broadmoor?
Income or Wage Gap in Broadmoor is 16.9%.
Women in Broadmoor earn 83.1 cents for every dollar earned by a man.
What is Inequality or Gini Index in Broadmoor?
Inequality or Gini Index in Broadmoor is 0.36.
What is the Total Population of Broadmoor?
Total Population of Broadmoor is 4,419.
What is the Total Male Population of Broadmoor?
Total Male Population of Broadmoor is 2,322.
What is the Total Female Population of Broadmoor?
Total Female Population of Broadmoor is 2,097.
What is the Ratio of Males per 100 Females in Broadmoor?
There are 110.73 Males per 100 Females in Broadmoor.
What is the Ratio of Females per 100 Males in Broadmoor?
There are 90.31 Females per 100 Males in Broadmoor.
What is the Median Population Age in Broadmoor?
Median Population Age in Broadmoor is 41.2 Years.
What is the Average Family Size in Broadmoor
Average Family Size in Broadmoor is 3.6 People.
What is the Average Household Size in Broadmoor
Average Household Size in Broadmoor is 3.2 People.
How Large is the Labor Force in Broadmoor?
There are 2,549 People in the Labor Forcein in Broadmoor.
What is the Percentage of People in the Labor Force in Broadmoor?
72.6% of People are in the Labor Force in Broadmoor.
What is the Unemployment Rate in Broadmoor?
Unemployment Rate in Broadmoor is 4.9%.