Cities with the Lowest Poverty Level Among Seniors Over the Age of 65 in Washington
RELATED REPORTS & OPTIONS
Lowest Poverty | Seniors 65+
Washington
Compare Cities
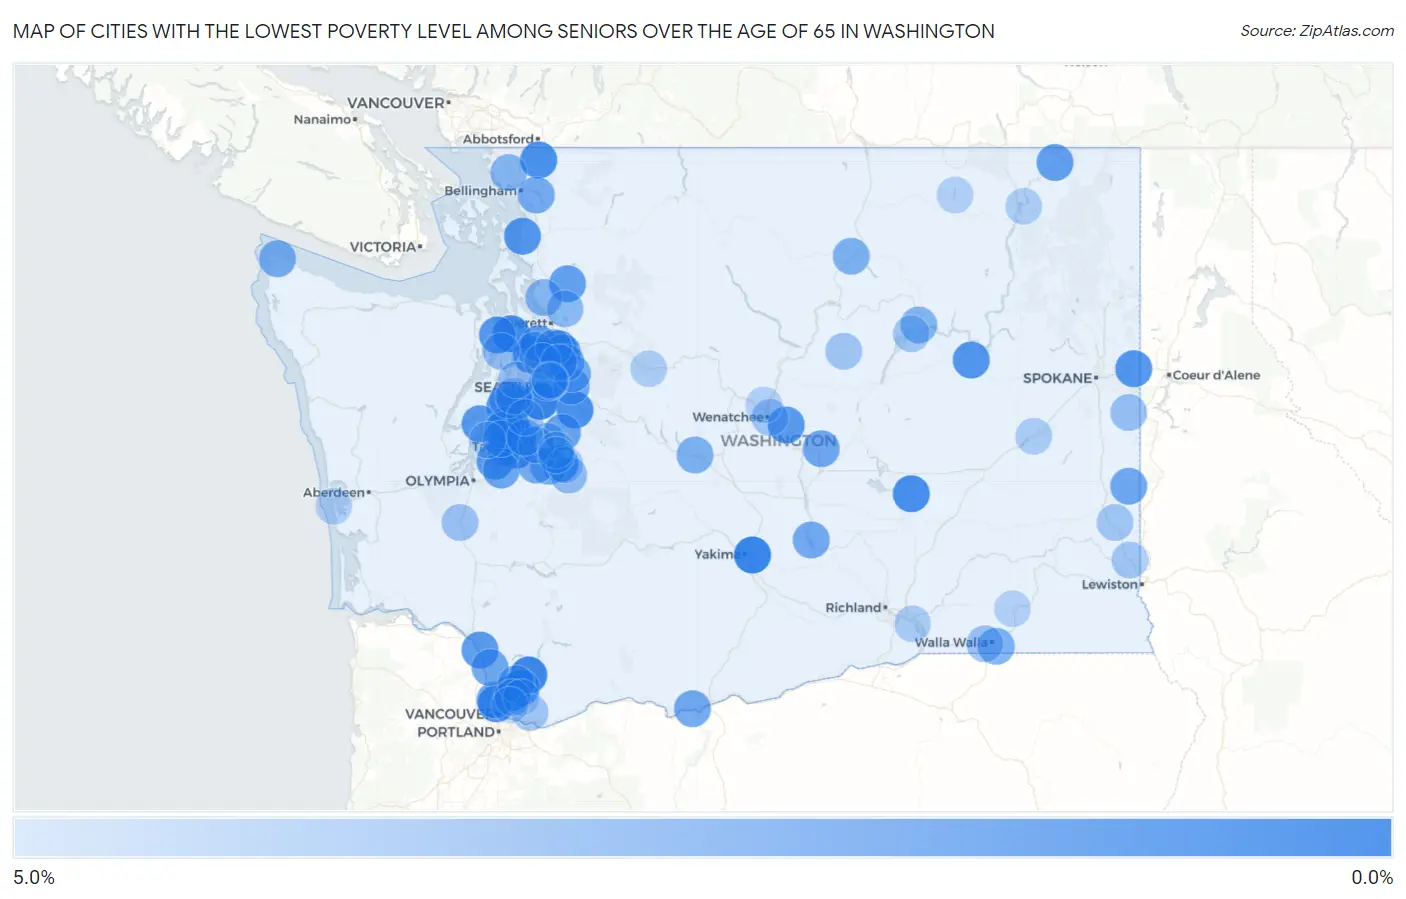
Map of Cities with the Lowest Poverty Level Among Seniors Over the Age of 65 in Washington
5.0%
0.0%
Cities with the Lowest Poverty Level Among Seniors Over the Age of 65 in Washington
| City | Senior Poverty | vs State | vs National | |
| 1. | Boulevard Park | 0.36% | 8.1%(-7.72)#1 | 10.0%(-9.59)#51 |
| 2. | Terrace Heights | 0.37% | 8.1%(-7.70)#2 | 10.0%(-9.58)#53 |
| 3. | Yacolt | 0.52% | 8.1%(-7.56)#3 | 10.0%(-9.43)#84 |
| 4. | Clear Lake Cdp Pierce County | 0.54% | 8.1%(-7.54)#4 | 10.0%(-9.41)#91 |
| 5. | Hansville | 0.71% | 8.1%(-7.37)#5 | 10.0%(-9.25)#144 |
| 6. | Warden | 0.79% | 8.1%(-7.29)#6 | 10.0%(-9.17)#171 |
| 7. | Mirrormont | 0.92% | 8.1%(-7.15)#7 | 10.0%(-9.03)#238 |
| 8. | Nooksack | 0.93% | 8.1%(-7.15)#8 | 10.0%(-9.03)#240 |
| 9. | Fircrest | 0.94% | 8.1%(-7.14)#9 | 10.0%(-9.01)#252 |
| 10. | Lake Shore | 0.97% | 8.1%(-7.11)#10 | 10.0%(-8.99)#263 |
| 11. | Bethel | 0.98% | 8.1%(-7.10)#11 | 10.0%(-8.97)#269 |
| 12. | Clearview | 1.1% | 8.1%(-6.99)#12 | 10.0%(-8.87)#326 |
| 13. | Ruston | 1.1% | 8.1%(-6.98)#13 | 10.0%(-8.85)#338 |
| 14. | Medina | 1.1% | 8.1%(-6.95)#14 | 10.0%(-8.83)#354 |
| 15. | Otis Orchards East Farms | 1.1% | 8.1%(-6.93)#15 | 10.0%(-8.80)#371 |
| 16. | Woodway | 1.2% | 8.1%(-6.92)#16 | 10.0%(-8.80)#377 |
| 17. | Creston | 1.2% | 8.1%(-6.92)#17 | 10.0%(-8.79)#388 |
| 18. | Bay View | 1.2% | 8.1%(-6.86)#18 | 10.0%(-8.74)#428 |
| 19. | Port Ludlow | 1.3% | 8.1%(-6.80)#19 | 10.0%(-8.68)#467 |
| 20. | Prairie Ridge | 1.3% | 8.1%(-6.74)#20 | 10.0%(-8.61)#528 |
| 21. | Meadow Glade | 1.3% | 8.1%(-6.74)#21 | 10.0%(-8.61)#531 |
| 22. | Rock Island | 1.4% | 8.1%(-6.71)#22 | 10.0%(-8.58)#552 |
| 23. | Kalama | 1.4% | 8.1%(-6.70)#23 | 10.0%(-8.58)#560 |
| 24. | Allyn | 1.4% | 8.1%(-6.66)#24 | 10.0%(-8.54)#589 |
| 25. | Maplewood | 1.5% | 8.1%(-6.58)#25 | 10.0%(-8.45)#650 |
| 26. | Fox Island | 1.5% | 8.1%(-6.58)#26 | 10.0%(-8.45)#653 |
| 27. | Anderson Island | 1.6% | 8.1%(-6.50)#27 | 10.0%(-8.37)#707 |
| 28. | Meadowdale | 1.6% | 8.1%(-6.47)#28 | 10.0%(-8.34)#742 |
| 29. | Maltby | 1.6% | 8.1%(-6.45)#29 | 10.0%(-8.33)#751 |
| 30. | Arlington Heights | 1.6% | 8.1%(-6.43)#30 | 10.0%(-8.30)#766 |
| 31. | Northport | 1.7% | 8.1%(-6.41)#31 | 10.0%(-8.29)#781 |
| 32. | Venersborg | 1.7% | 8.1%(-6.37)#32 | 10.0%(-8.25)#819 |
| 33. | Lake Morton Berrydale | 1.9% | 8.1%(-6.22)#33 | 10.0%(-8.09)#955 |
| 34. | Garfield | 1.9% | 8.1%(-6.14)#34 | 10.0%(-8.01)#1,034 |
| 35. | Dupont | 2.0% | 8.1%(-6.10)#35 | 10.0%(-7.98)#1,074 |
| 36. | Felida | 2.0% | 8.1%(-6.05)#36 | 10.0%(-7.92)#1,114 |
| 37. | Quincy | 2.0% | 8.1%(-6.03)#37 | 10.0%(-7.91)#1,133 |
| 38. | Woodland | 2.1% | 8.1%(-6.02)#38 | 10.0%(-7.89)#1,147 |
| 39. | Wishram | 2.1% | 8.1%(-6.02)#39 | 10.0%(-7.89)#1,151 |
| 40. | Desert Aire | 2.1% | 8.1%(-5.98)#40 | 10.0%(-7.85)#1,190 |
| 41. | Sammamish | 2.1% | 8.1%(-5.97)#41 | 10.0%(-7.84)#1,195 |
| 42. | Union Hill Novelty Hill | 2.1% | 8.1%(-5.94)#42 | 10.0%(-7.82)#1,218 |
| 43. | Southworth | 2.2% | 8.1%(-5.90)#43 | 10.0%(-7.78)#1,238 |
| 44. | Mcmillin | 2.2% | 8.1%(-5.84)#44 | 10.0%(-7.72)#1,308 |
| 45. | Sudden Valley | 2.2% | 8.1%(-5.83)#45 | 10.0%(-7.71)#1,322 |
| 46. | Summit View | 2.3% | 8.1%(-5.78)#46 | 10.0%(-7.66)#1,375 |
| 47. | Neah Bay | 2.3% | 8.1%(-5.77)#47 | 10.0%(-7.64)#1,383 |
| 48. | Canterwood | 2.3% | 8.1%(-5.73)#48 | 10.0%(-7.60)#1,428 |
| 49. | Rosedale | 2.4% | 8.1%(-5.66)#49 | 10.0%(-7.54)#1,505 |
| 50. | Lewisville | 2.4% | 8.1%(-5.64)#50 | 10.0%(-7.52)#1,519 |
| 51. | Artondale | 2.4% | 8.1%(-5.64)#51 | 10.0%(-7.51)#1,524 |
| 52. | Walla Walla East | 2.5% | 8.1%(-5.60)#52 | 10.0%(-7.47)#1,569 |
| 53. | Cle Elum | 2.5% | 8.1%(-5.59)#53 | 10.0%(-7.47)#1,575 |
| 54. | Okanogan | 2.5% | 8.1%(-5.57)#54 | 10.0%(-7.45)#1,599 |
| 55. | Parkwood | 2.6% | 8.1%(-5.50)#55 | 10.0%(-7.37)#1,683 |
| 56. | Cottage Lake | 2.6% | 8.1%(-5.47)#56 | 10.0%(-7.34)#1,715 |
| 57. | Fairwood Cdp Spokane County | 2.7% | 8.1%(-5.36)#57 | 10.0%(-7.23)#1,856 |
| 58. | Lake Goodwin | 2.8% | 8.1%(-5.32)#58 | 10.0%(-7.20)#1,879 |
| 59. | Ferndale | 2.8% | 8.1%(-5.31)#59 | 10.0%(-7.19)#1,891 |
| 60. | Coulee Dam | 2.8% | 8.1%(-5.30)#60 | 10.0%(-7.17)#1,903 |
| 61. | Algona | 2.9% | 8.1%(-5.22)#61 | 10.0%(-7.09)#1,988 |
| 62. | Lake Cassidy | 2.9% | 8.1%(-5.16)#62 | 10.0%(-7.03)#2,074 |
| 63. | Edmonds | 3.0% | 8.1%(-5.06)#63 | 10.0%(-6.93)#2,198 |
| 64. | Fife Heights | 3.0% | 8.1%(-5.03)#64 | 10.0%(-6.90)#2,241 |
| 65. | Lofall | 3.1% | 8.1%(-5.01)#65 | 10.0%(-6.88)#2,256 |
| 66. | Carbonado | 3.1% | 8.1%(-4.95)#66 | 10.0%(-6.83)#2,335 |
| 67. | Browns Point | 3.2% | 8.1%(-4.91)#67 | 10.0%(-6.79)#2,388 |
| 68. | Mill Creek East | 3.2% | 8.1%(-4.91)#68 | 10.0%(-6.78)#2,394 |
| 69. | Riverpoint | 3.2% | 8.1%(-4.90)#69 | 10.0%(-6.78)#2,400 |
| 70. | Manchester | 3.2% | 8.1%(-4.84)#70 | 10.0%(-6.72)#2,494 |
| 71. | Rockford | 3.3% | 8.1%(-4.78)#71 | 10.0%(-6.65)#2,571 |
| 72. | Bainbridge Island | 3.3% | 8.1%(-4.75)#72 | 10.0%(-6.62)#2,605 |
| 73. | Garrett | 3.3% | 8.1%(-4.74)#73 | 10.0%(-6.62)#2,608 |
| 74. | Grand Mound | 3.4% | 8.1%(-4.72)#74 | 10.0%(-6.59)#2,670 |
| 75. | Fern Prairie | 3.5% | 8.1%(-4.58)#75 | 10.0%(-6.46)#2,842 |
| 76. | Mansfield | 3.5% | 8.1%(-4.57)#76 | 10.0%(-6.44)#2,867 |
| 77. | East Wenatchee | 3.5% | 8.1%(-4.53)#77 | 10.0%(-6.41)#2,903 |
| 78. | Electric City | 3.6% | 8.1%(-4.46)#78 | 10.0%(-6.34)#3,028 |
| 79. | Albion | 3.6% | 8.1%(-4.46)#79 | 10.0%(-6.34)#3,031 |
| 80. | Colton | 3.6% | 8.1%(-4.46)#80 | 10.0%(-6.34)#3,034 |
| 81. | Brush Prairie | 3.7% | 8.1%(-4.42)#81 | 10.0%(-6.30)#3,071 |
| 82. | South Prairie | 3.7% | 8.1%(-4.37)#82 | 10.0%(-6.25)#3,147 |
| 83. | Lake Tapps | 3.9% | 8.1%(-4.19)#83 | 10.0%(-6.06)#3,380 |
| 84. | Bonney Lake | 3.9% | 8.1%(-4.16)#84 | 10.0%(-6.03)#3,416 |
| 85. | Finley | 3.9% | 8.1%(-4.16)#85 | 10.0%(-6.03)#3,420 |
| 86. | Sprague | 3.9% | 8.1%(-4.14)#86 | 10.0%(-6.01)#3,457 |
| 87. | Lake Forest Park | 4.0% | 8.1%(-4.09)#87 | 10.0%(-5.96)#3,521 |
| 88. | Marcus | 4.0% | 8.1%(-4.08)#88 | 10.0%(-5.95)#3,559 |
| 89. | Skykomish | 4.0% | 8.1%(-4.08)#89 | 10.0%(-5.95)#3,567 |
| 90. | Woodinville | 4.0% | 8.1%(-4.05)#90 | 10.0%(-5.92)#3,591 |
| 91. | Waitsburg | 4.1% | 8.1%(-4.00)#91 | 10.0%(-5.87)#3,651 |
| 92. | Home | 4.1% | 8.1%(-3.99)#92 | 10.0%(-5.86)#3,672 |
| 93. | Vashon | 4.1% | 8.1%(-3.98)#93 | 10.0%(-5.86)#3,676 |
| 94. | Curlew Lake | 4.1% | 8.1%(-3.98)#94 | 10.0%(-5.85)#3,686 |
| 95. | Westport | 4.1% | 8.1%(-3.97)#95 | 10.0%(-5.85)#3,696 |
| 96. | Sunnyslope | 4.1% | 8.1%(-3.95)#96 | 10.0%(-5.82)#3,730 |
| 97. | Clyde Hill | 4.2% | 8.1%(-3.92)#97 | 10.0%(-5.80)#3,759 |
| 98. | Yarrow Point | 4.2% | 8.1%(-3.89)#98 | 10.0%(-5.77)#3,815 |
| 99. | Hockinson | 4.2% | 8.1%(-3.89)#99 | 10.0%(-5.76)#3,820 |
| 100. | Five Corners | 4.2% | 8.1%(-3.84)#100 | 10.0%(-5.72)#3,875 |
Common Questions
What are the Top 10 Cities with the Lowest Poverty Level Among Seniors Over the Age of 65 in Washington?
Top 10 Cities with the Lowest Poverty Level Among Seniors Over the Age of 65 in Washington are:
#1
0.36%
#2
0.37%
#3
0.52%
#4
0.71%
#5
0.79%
#6
0.92%
#7
0.93%
#8
0.94%
#9
0.97%
#10
0.98%
What city has the Lowest Poverty Level Among Seniors Over the Age of 65 in Washington?
Boulevard Park has the Lowest Poverty Level Among Seniors Over the Age of 65 in Washington with 0.36%.
What is the Poverty Level Among Seniors Over the Age of 65 in the State of Washington?
Poverty Level Among Seniors Over the Age of 65 in Washington is 8.1%.
What is the Poverty Level Among Seniors Over the Age of 65 in the United States?
Poverty Level Among Seniors Over the Age of 65 in the United States is 10.0%.