Cities with the Lowest Poverty Level Among Seniors Over the Age of 65 in North Carolina
RELATED REPORTS & OPTIONS
Lowest Poverty | Seniors 65+
North Carolina
Compare Cities
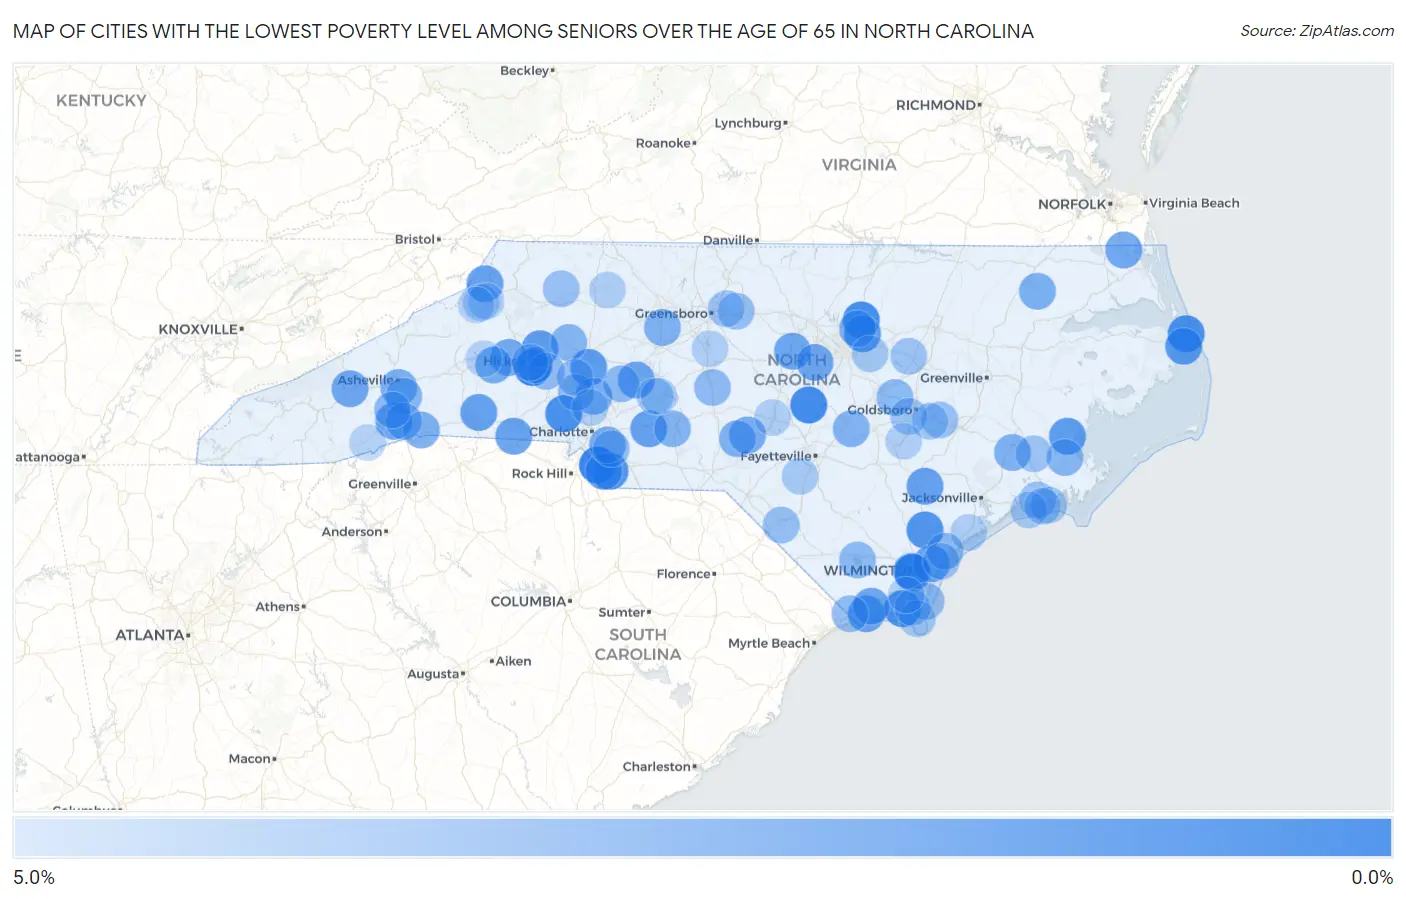
Map of Cities with the Lowest Poverty Level Among Seniors Over the Age of 65 in North Carolina
5.0%
0.0%
Cities with the Lowest Poverty Level Among Seniors Over the Age of 65 in North Carolina
| City | Senior Poverty | vs State | vs National | |
| 1. | Marvin | 0.13% | 9.8%(-9.63)#1 | 10.0%(-9.82)#4 |
| 2. | Mountain View | 0.14% | 9.8%(-9.62)#2 | 10.0%(-9.81)#6 |
| 3. | Belville | 0.19% | 9.8%(-9.56)#3 | 10.0%(-9.76)#12 |
| 4. | Mamers | 0.43% | 9.8%(-9.33)#4 | 10.0%(-9.52)#70 |
| 5. | Youngsville | 0.52% | 9.8%(-9.23)#5 | 10.0%(-9.43)#88 |
| 6. | Stanley | 0.67% | 9.8%(-9.09)#6 | 10.0%(-9.29)#126 |
| 7. | Nags Head | 0.69% | 9.8%(-9.07)#7 | 10.0%(-9.26)#139 |
| 8. | St James | 0.80% | 9.8%(-8.96)#8 | 10.0%(-9.16)#178 |
| 9. | St Helena | 0.95% | 9.8%(-8.81)#9 | 10.0%(-9.00)#256 |
| 10. | Mineral Springs | 0.97% | 9.8%(-8.79)#10 | 10.0%(-8.98)#267 |
| 11. | Wanchese | 1.2% | 9.8%(-8.59)#11 | 10.0%(-8.78)#397 |
| 12. | Spout Springs | 1.2% | 9.8%(-8.56)#12 | 10.0%(-8.75)#417 |
| 13. | Vandemere | 1.3% | 9.8%(-8.46)#13 | 10.0%(-8.65)#497 |
| 14. | Troutman | 1.3% | 9.8%(-8.45)#14 | 10.0%(-8.64)#502 |
| 15. | Bethlehem | 1.3% | 9.8%(-8.41)#15 | 10.0%(-8.61)#536 |
| 16. | Rolesville | 1.3% | 9.8%(-8.41)#16 | 10.0%(-8.61)#538 |
| 17. | Waxhaw | 1.5% | 9.8%(-8.22)#17 | 10.0%(-8.41)#678 |
| 18. | Greenevers | 1.6% | 9.8%(-8.19)#18 | 10.0%(-8.38)#699 |
| 19. | Bostic | 1.6% | 9.8%(-8.17)#19 | 10.0%(-8.36)#716 |
| 20. | Oakboro | 1.6% | 9.8%(-8.15)#20 | 10.0%(-8.34)#743 |
| 21. | Cove Creek | 1.6% | 9.8%(-8.12)#21 | 10.0%(-8.31)#763 |
| 22. | Earl | 1.7% | 9.8%(-8.09)#22 | 10.0%(-8.29)#778 |
| 23. | Kings Grant | 1.7% | 9.8%(-8.07)#23 | 10.0%(-8.27)#794 |
| 24. | Faith | 1.7% | 9.8%(-8.06)#24 | 10.0%(-8.26)#803 |
| 25. | Ocean Isle Beach | 1.7% | 9.8%(-8.02)#25 | 10.0%(-8.21)#852 |
| 26. | Etowah | 1.8% | 9.8%(-7.98)#26 | 10.0%(-8.18)#882 |
| 27. | Shallotte | 1.8% | 9.8%(-7.97)#27 | 10.0%(-8.16)#898 |
| 28. | Brandywine Bay | 1.8% | 9.8%(-7.95)#28 | 10.0%(-8.14)#908 |
| 29. | Fearrington Village | 1.8% | 9.8%(-7.94)#29 | 10.0%(-8.13)#912 |
| 30. | Lake Junaluska | 1.8% | 9.8%(-7.93)#30 | 10.0%(-8.12)#924 |
| 31. | Apex | 1.8% | 9.8%(-7.92)#31 | 10.0%(-8.11)#937 |
| 32. | Moyock | 1.9% | 9.8%(-7.85)#32 | 10.0%(-8.04)#997 |
| 33. | Valdese | 1.9% | 9.8%(-7.81)#33 | 10.0%(-8.01)#1,035 |
| 34. | Davidson | 2.1% | 9.8%(-7.66)#34 | 10.0%(-7.86)#1,186 |
| 35. | Salem | 2.1% | 9.8%(-7.64)#35 | 10.0%(-7.83)#1,203 |
| 36. | Pinehurst | 2.1% | 9.8%(-7.63)#36 | 10.0%(-7.83)#1,204 |
| 37. | Matthews | 2.2% | 9.8%(-7.57)#37 | 10.0%(-7.76)#1,269 |
| 38. | Biltmore Forest | 2.2% | 9.8%(-7.52)#38 | 10.0%(-7.71)#1,321 |
| 39. | Saluda | 2.3% | 9.8%(-7.42)#39 | 10.0%(-7.62)#1,414 |
| 40. | Powellsville | 2.3% | 9.8%(-7.41)#40 | 10.0%(-7.61)#1,425 |
| 41. | Midway | 2.4% | 9.8%(-7.40)#41 | 10.0%(-7.60)#1,434 |
| 42. | River Bend | 2.4% | 9.8%(-7.40)#42 | 10.0%(-7.59)#1,438 |
| 43. | Foxfire | 2.5% | 9.8%(-7.28)#43 | 10.0%(-7.47)#1,570 |
| 44. | Plain View | 2.5% | 9.8%(-7.24)#44 | 10.0%(-7.43)#1,616 |
| 45. | Wake Forest | 2.5% | 9.8%(-7.21)#45 | 10.0%(-7.41)#1,644 |
| 46. | Stony Point | 2.6% | 9.8%(-7.20)#46 | 10.0%(-7.39)#1,653 |
| 47. | Norwood | 2.6% | 9.8%(-7.15)#47 | 10.0%(-7.35)#1,708 |
| 48. | Leland | 2.6% | 9.8%(-7.15)#48 | 10.0%(-7.34)#1,717 |
| 49. | Oriental | 2.7% | 9.8%(-7.10)#49 | 10.0%(-7.30)#1,772 |
| 50. | Royal Pines | 2.7% | 9.8%(-7.08)#50 | 10.0%(-7.28)#1,800 |
| 51. | Hampstead | 2.7% | 9.8%(-7.07)#51 | 10.0%(-7.26)#1,817 |
| 52. | Valley Hill | 2.7% | 9.8%(-7.05)#52 | 10.0%(-7.24)#1,841 |
| 53. | Princeton | 2.8% | 9.8%(-6.99)#53 | 10.0%(-7.18)#1,893 |
| 54. | Lake Waccamaw | 2.8% | 9.8%(-6.95)#54 | 10.0%(-7.15)#1,937 |
| 55. | Governors Club | 2.8% | 9.8%(-6.95)#55 | 10.0%(-7.14)#1,939 |
| 56. | China Grove | 2.8% | 9.8%(-6.93)#56 | 10.0%(-7.13)#1,956 |
| 57. | Seagrove | 2.9% | 9.8%(-6.90)#57 | 10.0%(-7.09)#1,999 |
| 58. | Mills River | 2.9% | 9.8%(-6.89)#58 | 10.0%(-7.08)#2,028 |
| 59. | Carolina Shores | 2.9% | 9.8%(-6.87)#59 | 10.0%(-7.07)#2,038 |
| 60. | Westport | 2.9% | 9.8%(-6.86)#60 | 10.0%(-7.06)#2,049 |
| 61. | Newton | 2.9% | 9.8%(-6.83)#61 | 10.0%(-7.02)#2,088 |
| 62. | Kure Beach | 3.0% | 9.8%(-6.79)#62 | 10.0%(-6.98)#2,144 |
| 63. | Stallings | 3.1% | 9.8%(-6.68)#63 | 10.0%(-6.88)#2,259 |
| 64. | Whitsett | 3.1% | 9.8%(-6.68)#64 | 10.0%(-6.87)#2,271 |
| 65. | Mcdonald | 3.1% | 9.8%(-6.63)#65 | 10.0%(-6.83)#2,349 |
| 66. | Lake Norman Of Catawba | 3.1% | 9.8%(-6.62)#66 | 10.0%(-6.82)#2,361 |
| 67. | Hays | 3.2% | 9.8%(-6.59)#67 | 10.0%(-6.78)#2,398 |
| 68. | La Grange | 3.2% | 9.8%(-6.53)#68 | 10.0%(-6.72)#2,490 |
| 69. | Broad Creek | 3.2% | 9.8%(-6.53)#69 | 10.0%(-6.72)#2,491 |
| 70. | Mar Mac | 3.3% | 9.8%(-6.44)#70 | 10.0%(-6.63)#2,596 |
| 71. | Misenheimer | 3.3% | 9.8%(-6.43)#71 | 10.0%(-6.62)#2,621 |
| 72. | Brookford | 3.3% | 9.8%(-6.43)#72 | 10.0%(-6.62)#2,629 |
| 73. | Sims | 3.3% | 9.8%(-6.43)#73 | 10.0%(-6.62)#2,630 |
| 74. | Porters Neck | 3.4% | 9.8%(-6.38)#74 | 10.0%(-6.57)#2,686 |
| 75. | Fairfield Harbour | 3.4% | 9.8%(-6.38)#75 | 10.0%(-6.57)#2,692 |
| 76. | Mcleansville | 3.4% | 9.8%(-6.37)#76 | 10.0%(-6.56)#2,701 |
| 77. | Pine Knoll Shores | 3.4% | 9.8%(-6.34)#77 | 10.0%(-6.53)#2,741 |
| 78. | Long View | 3.4% | 9.8%(-6.31)#78 | 10.0%(-6.50)#2,772 |
| 79. | Wendell | 3.5% | 9.8%(-6.27)#79 | 10.0%(-6.46)#2,835 |
| 80. | Walnut Creek | 3.5% | 9.8%(-6.26)#80 | 10.0%(-6.45)#2,852 |
| 81. | Bald Head Island | 3.6% | 9.8%(-6.19)#81 | 10.0%(-6.38)#2,962 |
| 82. | Emerald Isle | 3.6% | 9.8%(-6.17)#82 | 10.0%(-6.36)#2,998 |
| 83. | Southport | 3.6% | 9.8%(-6.15)#83 | 10.0%(-6.34)#3,022 |
| 84. | Parkton | 3.6% | 9.8%(-6.14)#84 | 10.0%(-6.34)#3,032 |
| 85. | Emma | 3.6% | 9.8%(-6.13)#85 | 10.0%(-6.32)#3,050 |
| 86. | Indian Beach | 3.7% | 9.8%(-6.10)#86 | 10.0%(-6.29)#3,082 |
| 87. | Seven Devils | 3.7% | 9.8%(-6.05)#87 | 10.0%(-6.25)#3,143 |
| 88. | Alexis | 3.8% | 9.8%(-5.95)#88 | 10.0%(-6.15)#3,263 |
| 89. | Richfield | 3.8% | 9.8%(-5.94)#89 | 10.0%(-6.13)#3,290 |
| 90. | Cameron | 3.8% | 9.8%(-5.91)#90 | 10.0%(-6.11)#3,332 |
| 91. | Holly Ridge | 3.9% | 9.8%(-5.90)#91 | 10.0%(-6.09)#3,353 |
| 92. | Huntersville | 3.9% | 9.8%(-5.89)#92 | 10.0%(-6.08)#3,366 |
| 93. | Randleman | 3.9% | 9.8%(-5.84)#93 | 10.0%(-6.03)#3,418 |
| 94. | Calypso | 3.9% | 9.8%(-5.84)#94 | 10.0%(-6.03)#3,428 |
| 95. | Boonville | 3.9% | 9.8%(-5.83)#95 | 10.0%(-6.02)#3,445 |
| 96. | Boiling Spring Lakes | 4.0% | 9.8%(-5.77)#96 | 10.0%(-5.97)#3,514 |
| 97. | Foscoe | 4.0% | 9.8%(-5.77)#97 | 10.0%(-5.96)#3,518 |
| 98. | Sugar Mountain | 4.1% | 9.8%(-5.70)#98 | 10.0%(-5.89)#3,629 |
| 99. | Glen Alpine | 4.1% | 9.8%(-5.69)#99 | 10.0%(-5.89)#3,634 |
| 100. | Rosman | 4.1% | 9.8%(-5.66)#100 | 10.0%(-5.85)#3,693 |
Common Questions
What are the Top 10 Cities with the Lowest Poverty Level Among Seniors Over the Age of 65 in North Carolina?
Top 10 Cities with the Lowest Poverty Level Among Seniors Over the Age of 65 in North Carolina are:
#1
0.13%
#2
0.14%
#3
0.19%
#4
0.43%
#5
0.52%
#6
0.67%
#7
0.69%
#8
0.80%
#9
0.95%
#10
0.97%
What city has the Lowest Poverty Level Among Seniors Over the Age of 65 in North Carolina?
Marvin has the Lowest Poverty Level Among Seniors Over the Age of 65 in North Carolina with 0.13%.
What is the Poverty Level Among Seniors Over the Age of 65 in the State of North Carolina?
Poverty Level Among Seniors Over the Age of 65 in North Carolina is 9.8%.
What is the Poverty Level Among Seniors Over the Age of 65 in the United States?
Poverty Level Among Seniors Over the Age of 65 in the United States is 10.0%.