Cities with the Lowest Poverty Level Among Seniors Over the Age of 65 in Texas
RELATED REPORTS & OPTIONS
Lowest Poverty | Seniors 65+
Texas
Compare Cities
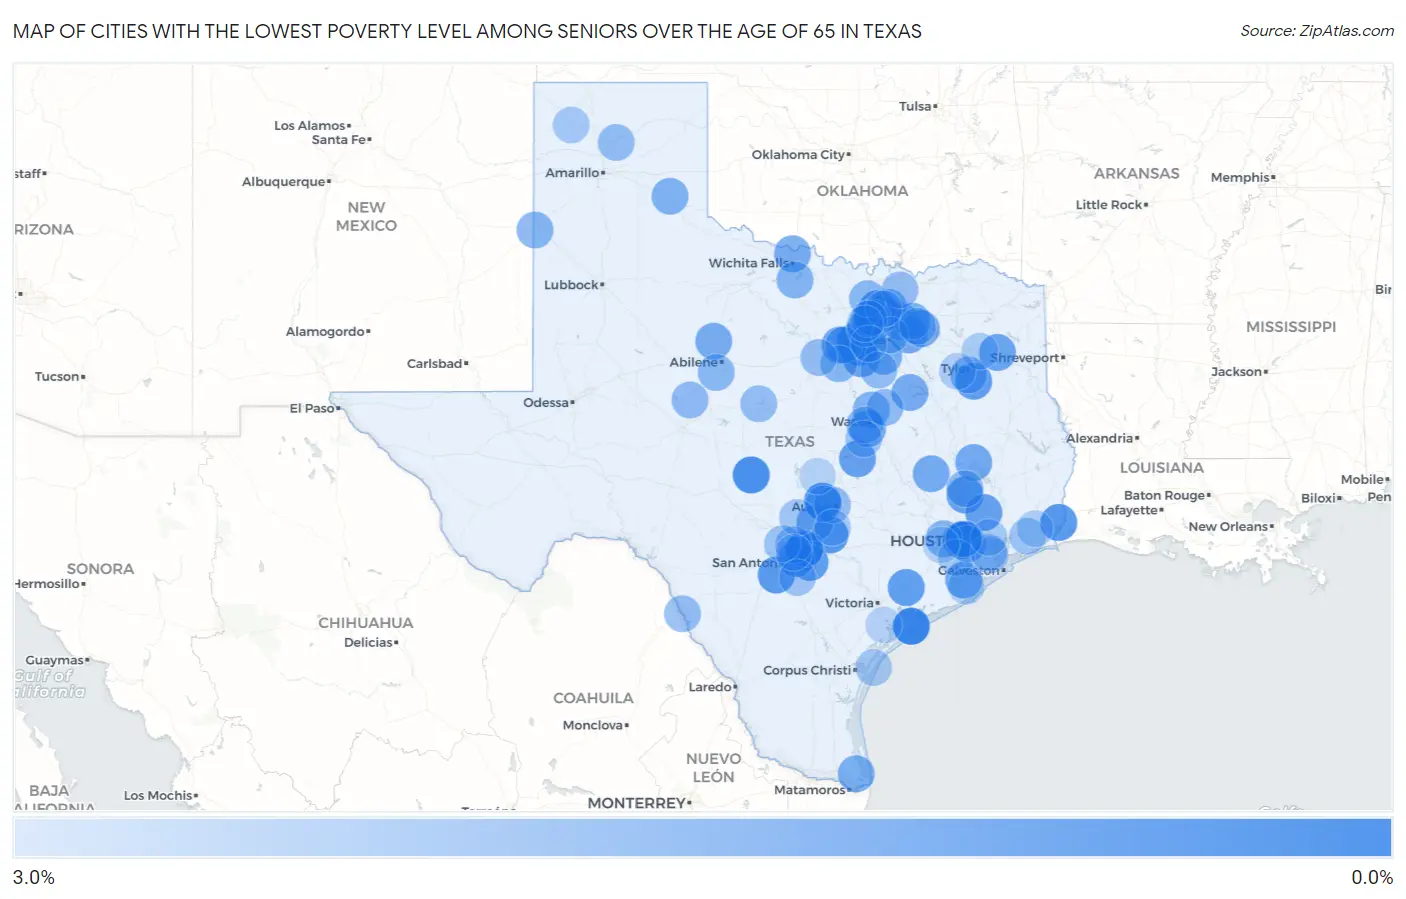
Map of Cities with the Lowest Poverty Level Among Seniors Over the Age of 65 in Texas
3.0%
0.0%
Cities with the Lowest Poverty Level Among Seniors Over the Age of 65 in Texas
| City | Senior Poverty | vs State | vs National | |
| 1. | Bunker Hill Village | 0.21% | 11.4%(-11.2)#1 | 10.0%(-9.74)#18 |
| 2. | Selma | 0.23% | 11.4%(-11.2)#2 | 10.0%(-9.73)#26 |
| 3. | Port O Connor | 0.27% | 11.4%(-11.1)#3 | 10.0%(-9.68)#38 |
| 4. | The Hills | 0.60% | 11.4%(-10.8)#4 | 10.0%(-9.36)#104 |
| 5. | Mason | 0.60% | 11.4%(-10.8)#5 | 10.0%(-9.35)#106 |
| 6. | Edgecliff Village | 0.61% | 11.4%(-10.8)#6 | 10.0%(-9.35)#107 |
| 7. | Westover Hills | 0.69% | 11.4%(-10.7)#7 | 10.0%(-9.26)#138 |
| 8. | Piney Point Village | 0.72% | 11.4%(-10.7)#8 | 10.0%(-9.24)#149 |
| 9. | Hunters Creek Village | 0.74% | 11.4%(-10.7)#9 | 10.0%(-9.21)#157 |
| 10. | Bridge City | 0.84% | 11.4%(-10.6)#10 | 10.0%(-9.11)#194 |
| 11. | Lytle | 0.86% | 11.4%(-10.6)#11 | 10.0%(-9.09)#200 |
| 12. | Cross Roads | 0.89% | 11.4%(-10.5)#12 | 10.0%(-9.06)#222 |
| 13. | Martindale | 0.89% | 11.4%(-10.5)#13 | 10.0%(-9.06)#223 |
| 14. | St Hedwig | 0.99% | 11.4%(-10.4)#14 | 10.0%(-8.97)#276 |
| 15. | Bullard | 0.99% | 11.4%(-10.4)#15 | 10.0%(-8.96)#278 |
| 16. | Ganado | 1.0% | 11.4%(-10.4)#16 | 10.0%(-8.92)#303 |
| 17. | Willis | 1.1% | 11.4%(-10.3)#17 | 10.0%(-8.85)#343 |
| 18. | Briaroaks | 1.1% | 11.4%(-10.3)#18 | 10.0%(-8.84)#350 |
| 19. | Roman Forest | 1.1% | 11.4%(-10.3)#19 | 10.0%(-8.83)#359 |
| 20. | Little River Academy | 1.1% | 11.4%(-10.3)#20 | 10.0%(-8.81)#366 |
| 21. | Bailey S Prairie | 1.2% | 11.4%(-10.2)#21 | 10.0%(-8.76)#409 |
| 22. | Union Grove | 1.2% | 11.4%(-10.2)#22 | 10.0%(-8.75)#421 |
| 23. | Parker | 1.3% | 11.4%(-10.2)#23 | 10.0%(-8.70)#445 |
| 24. | Annetta | 1.3% | 11.4%(-10.1)#24 | 10.0%(-8.68)#468 |
| 25. | Southlake | 1.3% | 11.4%(-10.1)#25 | 10.0%(-8.64)#498 |
| 26. | Heath | 1.4% | 11.4%(-10.1)#26 | 10.0%(-8.59)#548 |
| 27. | Terrell Hills | 1.4% | 11.4%(-10.1)#27 | 10.0%(-8.59)#550 |
| 28. | Union Valley | 1.4% | 11.4%(-10.0)#28 | 10.0%(-8.58)#553 |
| 29. | Highland Village | 1.4% | 11.4%(-10.0)#29 | 10.0%(-8.58)#557 |
| 30. | Lakewood Village | 1.4% | 11.4%(-10.0)#30 | 10.0%(-8.56)#564 |
| 31. | Hewitt | 1.4% | 11.4%(-10.0)#31 | 10.0%(-8.56)#570 |
| 32. | West University Place | 1.4% | 11.4%(-10.0)#32 | 10.0%(-8.56)#572 |
| 33. | Hackberry | 1.4% | 11.4%(-10.00)#33 | 10.0%(-8.54)#590 |
| 34. | Westwood Shores | 1.4% | 11.4%(-9.99)#34 | 10.0%(-8.53)#594 |
| 35. | Iola | 1.4% | 11.4%(-9.99)#35 | 10.0%(-8.52)#602 |
| 36. | Prosper | 1.4% | 11.4%(-9.98)#36 | 10.0%(-8.52)#605 |
| 37. | Angus | 1.4% | 11.4%(-9.97)#37 | 10.0%(-8.50)#615 |
| 38. | Aledo | 1.5% | 11.4%(-9.96)#38 | 10.0%(-8.49)#620 |
| 39. | Anson | 1.5% | 11.4%(-9.95)#39 | 10.0%(-8.49)#621 |
| 40. | Cashion Community | 1.5% | 11.4%(-9.94)#40 | 10.0%(-8.48)#629 |
| 41. | Woodcreek | 1.5% | 11.4%(-9.94)#41 | 10.0%(-8.48)#633 |
| 42. | Double Oak | 1.5% | 11.4%(-9.94)#42 | 10.0%(-8.48)#635 |
| 43. | Ovilla | 1.5% | 11.4%(-9.89)#43 | 10.0%(-8.43)#667 |
| 44. | Bayview | 1.6% | 11.4%(-9.86)#44 | 10.0%(-8.40)#685 |
| 45. | Nevada | 1.6% | 11.4%(-9.85)#45 | 10.0%(-8.39)#692 |
| 46. | Lantana | 1.6% | 11.4%(-9.84)#46 | 10.0%(-8.38)#702 |
| 47. | Keller | 1.6% | 11.4%(-9.83)#47 | 10.0%(-8.36)#720 |
| 48. | Hedley | 1.6% | 11.4%(-9.77)#48 | 10.0%(-8.31)#762 |
| 49. | Scotland | 1.7% | 11.4%(-9.72)#49 | 10.0%(-8.26)#806 |
| 50. | Noonday | 1.7% | 11.4%(-9.72)#50 | 10.0%(-8.26)#808 |
| 51. | Garden Ridge | 1.7% | 11.4%(-9.71)#51 | 10.0%(-8.25)#822 |
| 52. | Ross | 1.7% | 11.4%(-9.69)#52 | 10.0%(-8.23)#845 |
| 53. | Copper Canyon | 1.7% | 11.4%(-9.69)#53 | 10.0%(-8.22)#847 |
| 54. | Farwell | 1.7% | 11.4%(-9.68)#54 | 10.0%(-8.22)#851 |
| 55. | Katy | 1.8% | 11.4%(-9.64)#55 | 10.0%(-8.18)#883 |
| 56. | Woodway | 1.8% | 11.4%(-9.61)#56 | 10.0%(-8.15)#903 |
| 57. | Sanger | 1.8% | 11.4%(-9.58)#57 | 10.0%(-8.12)#929 |
| 58. | Buffalo Gap | 1.8% | 11.4%(-9.58)#58 | 10.0%(-8.12)#932 |
| 59. | Decordova | 1.8% | 11.4%(-9.57)#59 | 10.0%(-8.10)#945 |
| 60. | Steiner Ranch | 1.9% | 11.4%(-9.54)#60 | 10.0%(-8.08)#963 |
| 61. | University Park | 1.9% | 11.4%(-9.53)#61 | 10.0%(-8.07)#971 |
| 62. | Mount Calm | 1.9% | 11.4%(-9.51)#62 | 10.0%(-8.05)#992 |
| 63. | Timberwood Park | 1.9% | 11.4%(-9.49)#63 | 10.0%(-8.03)#1,002 |
| 64. | New Waverly | 1.9% | 11.4%(-9.49)#64 | 10.0%(-8.03)#1,005 |
| 65. | Bronte | 1.9% | 11.4%(-9.48)#65 | 10.0%(-8.02)#1,027 |
| 66. | Fritch | 2.0% | 11.4%(-9.43)#66 | 10.0%(-7.97)#1,077 |
| 67. | Lakeside Town San Patricio County | 2.0% | 11.4%(-9.39)#67 | 10.0%(-7.93)#1,109 |
| 68. | West Lake Hills | 2.0% | 11.4%(-9.39)#68 | 10.0%(-7.92)#1,111 |
| 69. | Rosita | 2.0% | 11.4%(-9.38)#69 | 10.0%(-7.92)#1,115 |
| 70. | Howe | 2.0% | 11.4%(-9.37)#70 | 10.0%(-7.91)#1,117 |
| 71. | Lipan | 2.0% | 11.4%(-9.37)#71 | 10.0%(-7.91)#1,125 |
| 72. | Lake Brownwood | 2.0% | 11.4%(-9.37)#72 | 10.0%(-7.91)#1,132 |
| 73. | Maypearl | 2.1% | 11.4%(-9.35)#73 | 10.0%(-7.89)#1,149 |
| 74. | Royse City | 2.1% | 11.4%(-9.35)#74 | 10.0%(-7.89)#1,154 |
| 75. | Bee Cave | 2.1% | 11.4%(-9.31)#75 | 10.0%(-7.85)#1,193 |
| 76. | Clear Lake Shores | 2.1% | 11.4%(-9.30)#76 | 10.0%(-7.84)#1,197 |
| 77. | Winnie | 2.2% | 11.4%(-9.20)#77 | 10.0%(-7.73)#1,291 |
| 78. | Scenic Oaks | 2.2% | 11.4%(-9.19)#78 | 10.0%(-7.73)#1,292 |
| 79. | Savannah | 2.2% | 11.4%(-9.18)#79 | 10.0%(-7.71)#1,312 |
| 80. | Sandy Oaks | 2.3% | 11.4%(-9.16)#80 | 10.0%(-7.70)#1,335 |
| 81. | Bruceville Eddy | 2.3% | 11.4%(-9.15)#81 | 10.0%(-7.69)#1,346 |
| 82. | Blanco | 2.3% | 11.4%(-9.13)#82 | 10.0%(-7.66)#1,364 |
| 83. | Bartonville | 2.3% | 11.4%(-9.10)#83 | 10.0%(-7.64)#1,391 |
| 84. | Thompsons | 2.3% | 11.4%(-9.09)#84 | 10.0%(-7.63)#1,404 |
| 85. | Port Aransas | 2.3% | 11.4%(-9.07)#85 | 10.0%(-7.61)#1,419 |
| 86. | Taylor Lake Village | 2.4% | 11.4%(-9.05)#86 | 10.0%(-7.58)#1,447 |
| 87. | Hartley | 2.4% | 11.4%(-9.03)#87 | 10.0%(-7.57)#1,464 |
| 88. | Highlands | 2.4% | 11.4%(-9.03)#88 | 10.0%(-7.57)#1,481 |
| 89. | Uhland | 2.4% | 11.4%(-9.01)#89 | 10.0%(-7.55)#1,492 |
| 90. | Hawkins | 2.5% | 11.4%(-8.90)#90 | 10.0%(-7.44)#1,604 |
| 91. | Lake Jackson | 2.5% | 11.4%(-8.90)#91 | 10.0%(-7.43)#1,614 |
| 92. | Brownsboro | 2.5% | 11.4%(-8.88)#92 | 10.0%(-7.42)#1,627 |
| 93. | Fannett | 2.5% | 11.4%(-8.88)#93 | 10.0%(-7.41)#1,637 |
| 94. | Hill Country Village | 2.6% | 11.4%(-8.78)#94 | 10.0%(-7.32)#1,734 |
| 95. | Bertram | 2.7% | 11.4%(-8.76)#95 | 10.0%(-7.30)#1,773 |
| 96. | Pantego | 2.7% | 11.4%(-8.75)#96 | 10.0%(-7.29)#1,780 |
| 97. | Spring Valley Village | 2.7% | 11.4%(-8.74)#97 | 10.0%(-7.28)#1,799 |
| 98. | Roanoke | 2.7% | 11.4%(-8.74)#98 | 10.0%(-7.27)#1,802 |
| 99. | Tivoli | 2.7% | 11.4%(-8.73)#99 | 10.0%(-7.26)#1,811 |
| 100. | Fulshear | 2.7% | 11.4%(-8.71)#100 | 10.0%(-7.24)#1,838 |
Common Questions
What are the Top 10 Cities with the Lowest Poverty Level Among Seniors Over the Age of 65 in Texas?
Top 10 Cities with the Lowest Poverty Level Among Seniors Over the Age of 65 in Texas are:
#1
0.21%
#2
0.23%
#3
0.27%
#4
0.60%
#5
0.60%
#6
0.61%
#7
0.69%
#8
0.72%
#9
0.74%
#10
0.84%
What city has the Lowest Poverty Level Among Seniors Over the Age of 65 in Texas?
Bunker Hill Village has the Lowest Poverty Level Among Seniors Over the Age of 65 in Texas with 0.21%.
What is the Poverty Level Among Seniors Over the Age of 65 in the State of Texas?
Poverty Level Among Seniors Over the Age of 65 in Texas is 11.4%.
What is the Poverty Level Among Seniors Over the Age of 65 in the United States?
Poverty Level Among Seniors Over the Age of 65 in the United States is 10.0%.