Cities with the Lowest Poverty Level Among Seniors Over the Age of 65 in New Jersey
RELATED REPORTS & OPTIONS
Lowest Poverty | Seniors 65+
New Jersey
Compare Cities
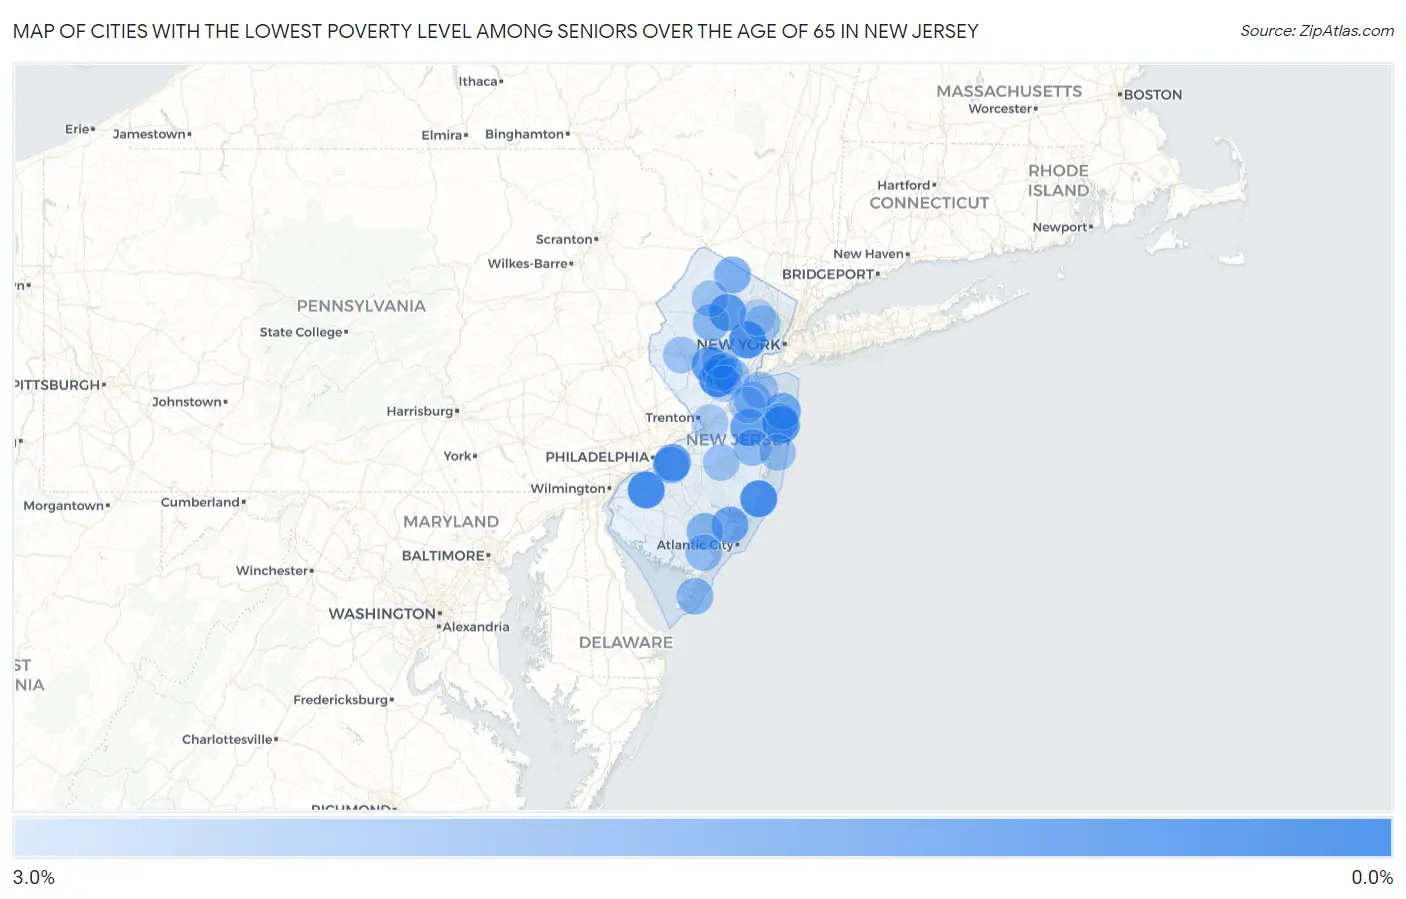
Map of Cities with the Lowest Poverty Level Among Seniors Over the Age of 65 in New Jersey
3.0%
0.0%
Cities with the Lowest Poverty Level Among Seniors Over the Age of 65 in New Jersey
| City | Senior Poverty | vs State | vs National | |
| 1. | Harrington Park Borough | 0.11% | 9.1%(-8.96)#1 | 10.0%(-9.84)#2 |
| 2. | Hopelawn | 0.12% | 9.1%(-8.95)#2 | 10.0%(-9.83)#3 |
| 3. | Pines Lake | 0.15% | 9.1%(-8.92)#3 | 10.0%(-9.80)#7 |
| 4. | Ho Ho Kus Borough | 0.17% | 9.1%(-8.90)#4 | 10.0%(-9.78)#10 |
| 5. | Seaville | 0.20% | 9.1%(-8.88)#5 | 10.0%(-9.76)#14 |
| 6. | Dorothy | 0.22% | 9.1%(-8.85)#6 | 10.0%(-9.73)#21 |
| 7. | Morris Plains Borough | 0.35% | 9.1%(-8.72)#7 | 10.0%(-9.60)#50 |
| 8. | Mullica Hill | 0.40% | 9.1%(-8.67)#8 | 10.0%(-9.55)#62 |
| 9. | Blackwells Mills | 0.44% | 9.1%(-8.63)#9 | 10.0%(-9.51)#75 |
| 10. | Kinnelon Borough | 0.53% | 9.1%(-8.55)#10 | 10.0%(-9.43)#89 |
| 11. | West Belmar | 0.56% | 9.1%(-8.51)#11 | 10.0%(-9.39)#98 |
| 12. | Short Hills | 0.59% | 9.1%(-8.48)#12 | 10.0%(-9.36)#102 |
| 13. | Beach Haven West | 0.59% | 9.1%(-8.48)#13 | 10.0%(-9.36)#103 |
| 14. | Mantoloking Borough | 0.65% | 9.1%(-8.42)#14 | 10.0%(-9.30)#121 |
| 15. | Bradley Beach Borough | 0.75% | 9.1%(-8.33)#15 | 10.0%(-9.21)#159 |
| 16. | Bloomsbury Borough | 0.86% | 9.1%(-8.21)#16 | 10.0%(-9.09)#201 |
| 17. | Lake Como Borough | 0.91% | 9.1%(-8.16)#17 | 10.0%(-9.04)#230 |
| 18. | Marmora | 0.93% | 9.1%(-8.15)#18 | 10.0%(-9.03)#239 |
| 19. | Woodcliff Lake Borough | 0.96% | 9.1%(-8.11)#19 | 10.0%(-8.99)#258 |
| 20. | Ship Bottom Borough | 0.96% | 9.1%(-8.11)#20 | 10.0%(-8.99)#262 |
| 21. | White Meadow Lake | 0.97% | 9.1%(-8.10)#21 | 10.0%(-8.98)#266 |
| 22. | Roseland Borough | 1.00% | 9.1%(-8.07)#22 | 10.0%(-8.95)#281 |
| 23. | Sea Girt Borough | 1.0% | 9.1%(-8.02)#23 | 10.0%(-8.90)#311 |
| 24. | Barnegat Light Borough | 1.1% | 9.1%(-8.00)#24 | 10.0%(-8.88)#321 |
| 25. | Kingston Estates | 1.1% | 9.1%(-7.96)#25 | 10.0%(-8.84)#351 |
| 26. | Landing | 1.1% | 9.1%(-7.95)#26 | 10.0%(-8.83)#353 |
| 27. | Bradley Gardens | 1.2% | 9.1%(-7.91)#27 | 10.0%(-8.79)#389 |
| 28. | Vista Center | 1.2% | 9.1%(-7.87)#28 | 10.0%(-8.75)#415 |
| 29. | Newfield Borough | 1.2% | 9.1%(-7.86)#29 | 10.0%(-8.74)#424 |
| 30. | Packanack Lake | 1.2% | 9.1%(-7.84)#30 | 10.0%(-8.72)#435 |
| 31. | Watchung Borough | 1.3% | 9.1%(-7.79)#31 | 10.0%(-8.67)#470 |
| 32. | Demarest Borough | 1.3% | 9.1%(-7.79)#32 | 10.0%(-8.67)#471 |
| 33. | Lyons | 1.3% | 9.1%(-7.74)#33 | 10.0%(-8.62)#517 |
| 34. | Smithville | 1.4% | 9.1%(-7.70)#34 | 10.0%(-8.58)#558 |
| 35. | Great Notch | 1.4% | 9.1%(-7.67)#35 | 10.0%(-8.55)#573 |
| 36. | Hamburg Borough | 1.4% | 9.1%(-7.67)#36 | 10.0%(-8.55)#576 |
| 37. | South Bound Brook Borough | 1.4% | 9.1%(-7.66)#37 | 10.0%(-8.54)#588 |
| 38. | Atlantic Highlands Borough | 1.5% | 9.1%(-7.57)#38 | 10.0%(-8.45)#654 |
| 39. | Glen Ridge Borough | 1.6% | 9.1%(-7.49)#39 | 10.0%(-8.37)#708 |
| 40. | Oakhurst | 1.6% | 9.1%(-7.46)#40 | 10.0%(-8.34)#741 |
| 41. | Medford Lakes Borough | 1.6% | 9.1%(-7.45)#41 | 10.0%(-8.33)#750 |
| 42. | Brielle Borough | 1.7% | 9.1%(-7.37)#42 | 10.0%(-8.25)#817 |
| 43. | Essex Fells Borough | 1.8% | 9.1%(-7.30)#43 | 10.0%(-8.18)#880 |
| 44. | Highland Lakes | 1.8% | 9.1%(-7.29)#44 | 10.0%(-8.17)#890 |
| 45. | Mount Arlington Borough | 1.8% | 9.1%(-7.24)#45 | 10.0%(-8.12)#928 |
| 46. | Frenchtown Borough | 1.8% | 9.1%(-7.23)#46 | 10.0%(-8.11)#943 |
| 47. | Island Heights Borough | 1.8% | 9.1%(-7.22)#47 | 10.0%(-8.10)#946 |
| 48. | Barclay | 1.9% | 9.1%(-7.19)#48 | 10.0%(-8.07)#969 |
| 49. | The Ponds | 1.9% | 9.1%(-7.18)#49 | 10.0%(-8.06)#984 |
| 50. | Mays Landing | 1.9% | 9.1%(-7.17)#50 | 10.0%(-8.05)#990 |
| 51. | Little Silver Borough | 1.9% | 9.1%(-7.15)#51 | 10.0%(-8.03)#1,020 |
| 52. | Succasunna | 1.9% | 9.1%(-7.14)#52 | 10.0%(-8.02)#1,029 |
| 53. | New Providence Borough | 2.0% | 9.1%(-7.12)#53 | 10.0%(-8.00)#1,039 |
| 54. | Franklin Center | 2.0% | 9.1%(-7.11)#54 | 10.0%(-7.99)#1,047 |
| 55. | Vincentown | 2.0% | 9.1%(-7.11)#55 | 10.0%(-7.99)#1,057 |
| 56. | Farmingdale Borough | 2.0% | 9.1%(-7.10)#56 | 10.0%(-7.98)#1,069 |
| 57. | Weston | 2.0% | 9.1%(-7.09)#57 | 10.0%(-7.97)#1,075 |
| 58. | Stonebridge | 2.0% | 9.1%(-7.09)#58 | 10.0%(-7.97)#1,083 |
| 59. | North Wildwood | 2.0% | 9.1%(-7.06)#59 | 10.0%(-7.94)#1,102 |
| 60. | Upper Greenwood Lake | 2.1% | 9.1%(-7.02)#60 | 10.0%(-7.90)#1,143 |
| 61. | North Haledon Borough | 2.1% | 9.1%(-6.98)#61 | 10.0%(-7.86)#1,183 |
| 62. | Wenonah Borough | 2.1% | 9.1%(-6.98)#62 | 10.0%(-7.86)#1,187 |
| 63. | Leisure Knoll | 2.1% | 9.1%(-6.95)#63 | 10.0%(-7.83)#1,205 |
| 64. | Corbin City | 2.2% | 9.1%(-6.87)#64 | 10.0%(-7.75)#1,275 |
| 65. | East Franklin | 2.2% | 9.1%(-6.87)#65 | 10.0%(-7.75)#1,278 |
| 66. | Roosevelt Borough | 2.2% | 9.1%(-6.86)#66 | 10.0%(-7.74)#1,286 |
| 67. | Victory Gardens Borough | 2.2% | 9.1%(-6.85)#67 | 10.0%(-7.73)#1,294 |
| 68. | Allentown Borough | 2.3% | 9.1%(-6.82)#68 | 10.0%(-7.70)#1,340 |
| 69. | Robertsville | 2.3% | 9.1%(-6.78)#69 | 10.0%(-7.66)#1,371 |
| 70. | Cranford | 2.3% | 9.1%(-6.75)#70 | 10.0%(-7.63)#1,394 |
| 71. | Spring Lake Heights Borough | 2.3% | 9.1%(-6.73)#71 | 10.0%(-7.61)#1,415 |
| 72. | Shark River Hills | 2.3% | 9.1%(-6.73)#72 | 10.0%(-7.61)#1,418 |
| 73. | Strathmore | 2.4% | 9.1%(-6.71)#73 | 10.0%(-7.59)#1,437 |
| 74. | Presidential Lakes Estates | 2.4% | 9.1%(-6.71)#74 | 10.0%(-7.59)#1,439 |
| 75. | Monmouth Beach Borough | 2.4% | 9.1%(-6.71)#75 | 10.0%(-7.59)#1,442 |
| 76. | Haddonfield Borough | 2.4% | 9.1%(-6.70)#76 | 10.0%(-7.58)#1,446 |
| 77. | Neshanic Station | 2.4% | 9.1%(-6.70)#77 | 10.0%(-7.58)#1,450 |
| 78. | Dover Beaches North | 2.4% | 9.1%(-6.70)#78 | 10.0%(-7.58)#1,456 |
| 79. | Troy Hills | 2.4% | 9.1%(-6.69)#79 | 10.0%(-7.57)#1,477 |
| 80. | Lake Mohawk | 2.4% | 9.1%(-6.68)#80 | 10.0%(-7.56)#1,486 |
| 81. | Clinton | 2.4% | 9.1%(-6.65)#81 | 10.0%(-7.53)#1,509 |
| 82. | Ramsey Borough | 2.5% | 9.1%(-6.62)#82 | 10.0%(-7.50)#1,548 |
| 83. | Milltown Borough | 2.5% | 9.1%(-6.58)#83 | 10.0%(-7.46)#1,580 |
| 84. | Upper Montclair | 2.5% | 9.1%(-6.56)#84 | 10.0%(-7.44)#1,600 |
| 85. | Emerson Borough | 2.6% | 9.1%(-6.51)#85 | 10.0%(-7.39)#1,656 |
| 86. | Moonachie Borough | 2.6% | 9.1%(-6.46)#86 | 10.0%(-7.34)#1,712 |
| 87. | Yorketown | 2.6% | 9.1%(-6.45)#87 | 10.0%(-7.33)#1,726 |
| 88. | Absecon Highlands | 2.6% | 9.1%(-6.44)#88 | 10.0%(-7.32)#1,731 |
| 89. | Yardville | 2.6% | 9.1%(-6.42)#89 | 10.0%(-7.30)#1,765 |
| 90. | Mountainside Borough | 2.7% | 9.1%(-6.38)#90 | 10.0%(-7.26)#1,813 |
| 91. | Martinsville | 2.7% | 9.1%(-6.38)#91 | 10.0%(-7.26)#1,822 |
| 92. | Palermo | 2.8% | 9.1%(-6.28)#92 | 10.0%(-7.16)#1,923 |
| 93. | Lincoln Park Borough | 2.8% | 9.1%(-6.28)#93 | 10.0%(-7.16)#1,927 |
| 94. | Oradell Borough | 2.9% | 9.1%(-6.21)#94 | 10.0%(-7.09)#2,014 |
| 95. | Midland Park Borough | 2.9% | 9.1%(-6.21)#95 | 10.0%(-7.09)#2,016 |
| 96. | Woodbury Heights Borough | 2.9% | 9.1%(-6.21)#96 | 10.0%(-7.09)#2,017 |
| 97. | Singac | 2.9% | 9.1%(-6.21)#97 | 10.0%(-7.09)#2,021 |
| 98. | Franklin Park | 2.9% | 9.1%(-6.20)#98 | 10.0%(-7.08)#2,024 |
| 99. | Merchantville Borough | 3.0% | 9.1%(-6.12)#99 | 10.0%(-7.00)#2,124 |
| 100. | Bogota Borough | 3.0% | 9.1%(-6.12)#100 | 10.0%(-7.00)#2,125 |
Common Questions
What are the Top 10 Cities with the Lowest Poverty Level Among Seniors Over the Age of 65 in New Jersey?
Top 10 Cities with the Lowest Poverty Level Among Seniors Over the Age of 65 in New Jersey are:
#1
0.40%
#2
0.44%
#3
0.56%
#4
0.59%
#5
0.59%
#6
0.97%
#7
1.1%
#8
1.2%
#9
1.2%
#10
1.4%
What city has the Lowest Poverty Level Among Seniors Over the Age of 65 in New Jersey?
Mullica Hill has the Lowest Poverty Level Among Seniors Over the Age of 65 in New Jersey with 0.40%.
What is the Poverty Level Among Seniors Over the Age of 65 in the State of New Jersey?
Poverty Level Among Seniors Over the Age of 65 in New Jersey is 9.1%.
What is the Poverty Level Among Seniors Over the Age of 65 in the United States?
Poverty Level Among Seniors Over the Age of 65 in the United States is 10.0%.