Cities with the Lowest Poverty Level Among Seniors Over the Age of 65 in North Dakota
RELATED REPORTS & OPTIONS
Lowest Poverty | Seniors 65+
North Dakota
Compare Cities
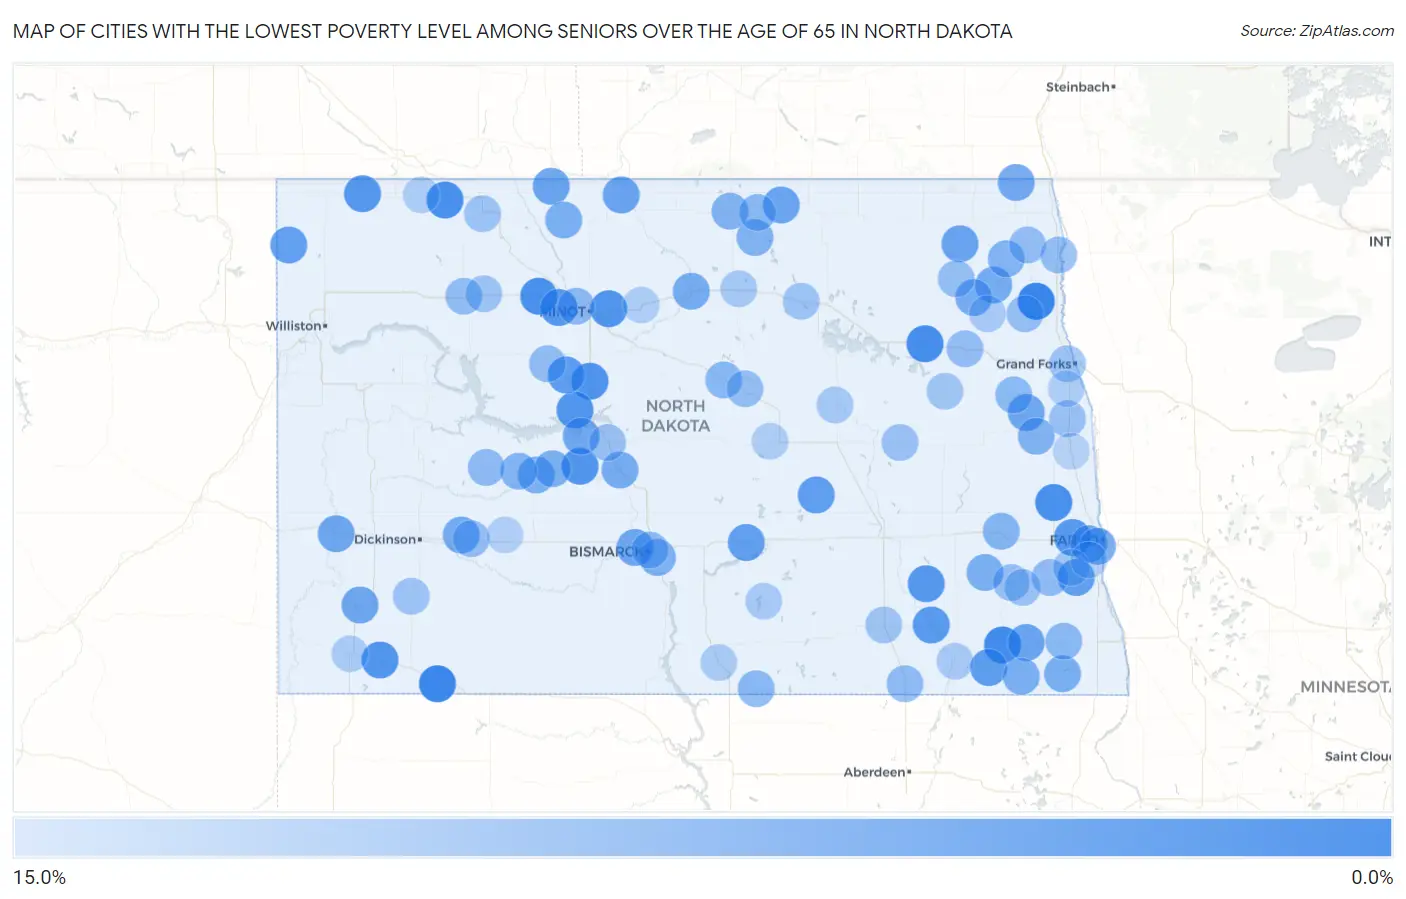
Map of Cities with the Lowest Poverty Level Among Seniors Over the Age of 65 in North Dakota
15.0%
0.0%
Cities with the Lowest Poverty Level Among Seniors Over the Age of 65 in North Dakota
| City | Senior Poverty | vs State | vs National | |
| 1. | Minto | 0.78% | 9.1%(-8.34)#1 | 10.0%(-9.17)#169 |
| 2. | Hettinger | 1.1% | 9.1%(-7.98)#2 | 10.0%(-8.81)#367 |
| 3. | Gwinner | 1.6% | 9.1%(-7.50)#3 | 10.0%(-8.34)#745 |
| 4. | Lakota | 1.8% | 9.1%(-7.28)#4 | 10.0%(-8.12)#931 |
| 5. | Berthold | 2.0% | 9.1%(-7.12)#5 | 10.0%(-7.95)#1,093 |
| 6. | Lignite | 2.0% | 9.1%(-7.08)#6 | 10.0%(-7.91)#1,128 |
| 7. | Arthur | 2.1% | 9.1%(-6.99)#7 | 10.0%(-7.82)#1,210 |
| 8. | Max | 2.6% | 9.1%(-6.48)#8 | 10.0%(-7.32)#1,751 |
| 9. | Surrey | 2.7% | 9.1%(-6.45)#9 | 10.0%(-7.29)#1,787 |
| 10. | Stanton | 2.7% | 9.1%(-6.44)#10 | 10.0%(-7.27)#1,806 |
| 11. | Scranton | 2.7% | 9.1%(-6.41)#11 | 10.0%(-7.25)#1,830 |
| 12. | Garrison | 2.9% | 9.1%(-6.26)#12 | 10.0%(-7.09)#1,991 |
| 13. | Crosby | 3.1% | 9.1%(-5.99)#13 | 10.0%(-6.83)#2,331 |
| 14. | Des Lacs | 3.1% | 9.1%(-5.99)#14 | 10.0%(-6.83)#2,341 |
| 15. | Marion | 3.2% | 9.1%(-5.89)#15 | 10.0%(-6.73)#2,480 |
| 16. | Mapleton | 3.3% | 9.1%(-5.86)#16 | 10.0%(-6.69)#2,519 |
| 17. | Lamoure | 3.3% | 9.1%(-5.81)#17 | 10.0%(-6.64)#2,586 |
| 18. | Douglas | 3.6% | 9.1%(-5.55)#18 | 10.0%(-6.38)#2,970 |
| 19. | Cogswell | 3.7% | 9.1%(-5.41)#19 | 10.0%(-6.25)#3,161 |
| 20. | Woodworth | 3.8% | 9.1%(-5.27)#20 | 10.0%(-6.11)#3,346 |
| 21. | Kindred | 4.0% | 9.1%(-5.12)#21 | 10.0%(-5.95)#3,538 |
| 22. | Steele | 4.1% | 9.1%(-5.06)#22 | 10.0%(-5.89)#3,628 |
| 23. | Grenora | 4.1% | 9.1%(-5.03)#23 | 10.0%(-5.87)#3,659 |
| 24. | Milton | 4.5% | 9.1%(-4.57)#24 | 10.0%(-5.41)#4,378 |
| 25. | Rolla | 4.6% | 9.1%(-4.53)#25 | 10.0%(-5.36)#4,421 |
| 26. | Westhope | 4.6% | 9.1%(-4.50)#26 | 10.0%(-5.34)#4,462 |
| 27. | Milnor | 4.7% | 9.1%(-4.47)#27 | 10.0%(-5.30)#4,507 |
| 28. | Sherwood | 4.7% | 9.1%(-4.43)#28 | 10.0%(-5.26)#4,562 |
| 29. | Medora | 4.9% | 9.1%(-4.20)#29 | 10.0%(-5.03)#4,885 |
| 30. | Hatton | 5.0% | 9.1%(-4.17)#30 | 10.0%(-5.00)#4,932 |
| 31. | Mandan | 5.0% | 9.1%(-4.15)#31 | 10.0%(-4.98)#4,955 |
| 32. | Amidon | 5.0% | 9.1%(-4.12)#32 | 10.0%(-4.95)#5,019 |
| 33. | West Fargo | 5.0% | 9.1%(-4.11)#33 | 10.0%(-4.95)#5,020 |
| 34. | Riverdale | 5.1% | 9.1%(-4.05)#34 | 10.0%(-4.89)#5,095 |
| 35. | Neche | 5.1% | 9.1%(-4.03)#35 | 10.0%(-4.87)#5,119 |
| 36. | Taylor | 5.4% | 9.1%(-3.71)#36 | 10.0%(-4.55)#5,622 |
| 37. | Fargo | 5.5% | 9.1%(-3.66)#37 | 10.0%(-4.50)#5,687 |
| 38. | Park River | 5.5% | 9.1%(-3.66)#38 | 10.0%(-4.50)#5,691 |
| 39. | Lankin | 5.6% | 9.1%(-3.56)#39 | 10.0%(-4.40)#5,888 |
| 40. | Towner | 5.6% | 9.1%(-3.50)#40 | 10.0%(-4.33)#5,988 |
| 41. | Washburn | 5.7% | 9.1%(-3.43)#41 | 10.0%(-4.26)#6,095 |
| 42. | Mohall | 5.9% | 9.1%(-3.23)#42 | 10.0%(-4.07)#6,415 |
| 43. | Rutland | 5.9% | 9.1%(-3.23)#43 | 10.0%(-4.07)#6,453 |
| 44. | Nome | 5.9% | 9.1%(-3.23)#44 | 10.0%(-4.07)#6,456 |
| 45. | Lidgerwood | 6.0% | 9.1%(-3.15)#45 | 10.0%(-3.98)#6,570 |
| 46. | Beulah | 6.0% | 9.1%(-3.12)#46 | 10.0%(-3.95)#6,609 |
| 47. | Hazen | 6.2% | 9.1%(-2.96)#47 | 10.0%(-3.79)#6,872 |
| 48. | Lincoln | 6.3% | 9.1%(-2.77)#48 | 10.0%(-3.61)#7,148 |
| 49. | Portland | 6.4% | 9.1%(-2.75)#49 | 10.0%(-3.59)#7,179 |
| 50. | Rolette | 6.4% | 9.1%(-2.73)#50 | 10.0%(-3.57)#7,203 |
| 51. | Dunseith | 6.5% | 9.1%(-2.66)#51 | 10.0%(-3.50)#7,282 |
| 52. | Hoople | 6.7% | 9.1%(-2.45)#52 | 10.0%(-3.29)#7,625 |
| 53. | Zap | 6.7% | 9.1%(-2.45)#53 | 10.0%(-3.29)#7,637 |
| 54. | Tower City | 6.8% | 9.1%(-2.34)#54 | 10.0%(-3.17)#7,806 |
| 55. | Zeeland | 7.0% | 9.1%(-2.10)#55 | 10.0%(-2.93)#8,146 |
| 56. | Shell Valley | 7.1% | 9.1%(-1.97)#56 | 10.0%(-2.81)#8,296 |
| 57. | Wyndmere | 7.1% | 9.1%(-1.97)#57 | 10.0%(-2.81)#8,317 |
| 58. | Martin | 7.1% | 9.1%(-1.97)#58 | 10.0%(-2.81)#8,355 |
| 59. | Northwood | 7.3% | 9.1%(-1.82)#59 | 10.0%(-2.66)#8,536 |
| 60. | Dodge | 7.4% | 9.1%(-1.71)#60 | 10.0%(-2.54)#8,688 |
| 61. | Bismarck | 7.4% | 9.1%(-1.67)#61 | 10.0%(-2.51)#8,730 |
| 62. | Burlington | 7.5% | 9.1%(-1.64)#62 | 10.0%(-2.48)#8,776 |
| 63. | Leonard | 7.5% | 9.1%(-1.57)#63 | 10.0%(-2.40)#8,881 |
| 64. | Ellendale | 7.6% | 9.1%(-1.52)#64 | 10.0%(-2.35)#8,949 |
| 65. | Ryder | 7.7% | 9.1%(-1.42)#65 | 10.0%(-2.26)#9,121 |
| 66. | Stanley | 7.8% | 9.1%(-1.35)#66 | 10.0%(-2.18)#9,221 |
| 67. | St Thomas | 7.8% | 9.1%(-1.27)#67 | 10.0%(-2.11)#9,316 |
| 68. | Petersburg | 7.8% | 9.1%(-1.27)#68 | 10.0%(-2.11)#9,319 |
| 69. | Richardton | 7.9% | 9.1%(-1.24)#69 | 10.0%(-2.08)#9,366 |
| 70. | Drayton | 7.9% | 9.1%(-1.21)#70 | 10.0%(-2.04)#9,418 |
| 71. | Forest River | 8.0% | 9.1%(-1.12)#71 | 10.0%(-1.95)#9,566 |
| 72. | Adams | 8.0% | 9.1%(-1.12)#72 | 10.0%(-1.95)#9,567 |
| 73. | Harvey | 8.0% | 9.1%(-1.11)#73 | 10.0%(-1.94)#9,574 |
| 74. | Enderlin | 8.1% | 9.1%(-1.05)#74 | 10.0%(-1.89)#9,647 |
| 75. | Underwood | 8.1% | 9.1%(-0.977)#75 | 10.0%(-1.81)#9,749 |
| 76. | Buxton | 8.2% | 9.1%(-0.897)#76 | 10.0%(-1.73)#9,861 |
| 77. | Glenfield | 8.3% | 9.1%(-0.783)#77 | 10.0%(-1.62)#10,046 |
| 78. | Bowbells | 8.5% | 9.1%(-0.642)#78 | 10.0%(-1.48)#10,209 |
| 79. | Leeds | 8.5% | 9.1%(-0.606)#79 | 10.0%(-1.44)#10,251 |
| 80. | New England | 8.6% | 9.1%(-0.545)#80 | 10.0%(-1.38)#10,325 |
| 81. | Palermo | 8.6% | 9.1%(-0.545)#81 | 10.0%(-1.38)#10,348 |
| 82. | Grand Forks | 8.6% | 9.1%(-0.539)#82 | 10.0%(-1.37)#10,356 |
| 83. | Edgeley | 8.6% | 9.1%(-0.487)#83 | 10.0%(-1.32)#10,434 |
| 84. | Sheldon | 8.7% | 9.1%(-0.421)#84 | 10.0%(-1.26)#10,539 |
| 85. | Mcville | 8.9% | 9.1%(-0.173)#85 | 10.0%(-1.01)#10,865 |
| 86. | Davenport | 9.1% | 9.1%(-0.026)#86 | 10.0%(-0.861)#11,053 |
| 87. | New Rockford | 9.3% | 9.1%(+0.221)#87 | 10.0%(-0.614)#11,357 |
| 88. | Rugby | 9.3% | 9.1%(+0.223)#88 | 10.0%(-0.612)#11,359 |
| 89. | Oakes | 9.4% | 9.1%(+0.326)#89 | 10.0%(-0.510)#11,475 |
| 90. | Fordville | 9.5% | 9.1%(+0.407)#90 | 10.0%(-0.428)#11,581 |
| 91. | Napoleon | 9.6% | 9.1%(+0.458)#91 | 10.0%(-0.377)#11,633 |
| 92. | Strasburg | 9.7% | 9.1%(+0.606)#92 | 10.0%(-0.229)#11,844 |
| 93. | Bowman | 9.7% | 9.1%(+0.611)#93 | 10.0%(-0.224)#11,854 |
| 94. | Bowdon | 9.8% | 9.1%(+0.687)#94 | 10.0%(-0.148)#11,962 |
| 95. | Thompson | 10.0% | 9.1%(+0.883)#95 | 10.0%(+0.048)#12,197 |
| 96. | Granville | 10.0% | 9.1%(+0.883)#96 | 10.0%(+0.048)#12,229 |
| 97. | Columbus | 10.0% | 9.1%(+0.883)#97 | 10.0%(+0.048)#12,276 |
| 98. | Hebron | 10.1% | 9.1%(+1.02)#98 | 10.0%(+0.183)#12,401 |
| 99. | Horace | 10.5% | 9.1%(+1.34)#99 | 10.0%(+0.503)#12,819 |
| 100. | Hillsboro | 10.5% | 9.1%(+1.36)#100 | 10.0%(+0.521)#12,841 |
Common Questions
What are the Top 10 Cities with the Lowest Poverty Level Among Seniors Over the Age of 65 in North Dakota?
Top 10 Cities with the Lowest Poverty Level Among Seniors Over the Age of 65 in North Dakota are:
What city has the Lowest Poverty Level Among Seniors Over the Age of 65 in North Dakota?
Minto has the Lowest Poverty Level Among Seniors Over the Age of 65 in North Dakota with 0.78%.
What is the Poverty Level Among Seniors Over the Age of 65 in the State of North Dakota?
Poverty Level Among Seniors Over the Age of 65 in North Dakota is 9.1%.
What is the Poverty Level Among Seniors Over the Age of 65 in the United States?
Poverty Level Among Seniors Over the Age of 65 in the United States is 10.0%.