Cities with the Lowest Poverty Level Among Seniors Over the Age of 65 in Massachusetts
RELATED REPORTS & OPTIONS
Lowest Poverty | Seniors 65+
Massachusetts
Compare Cities
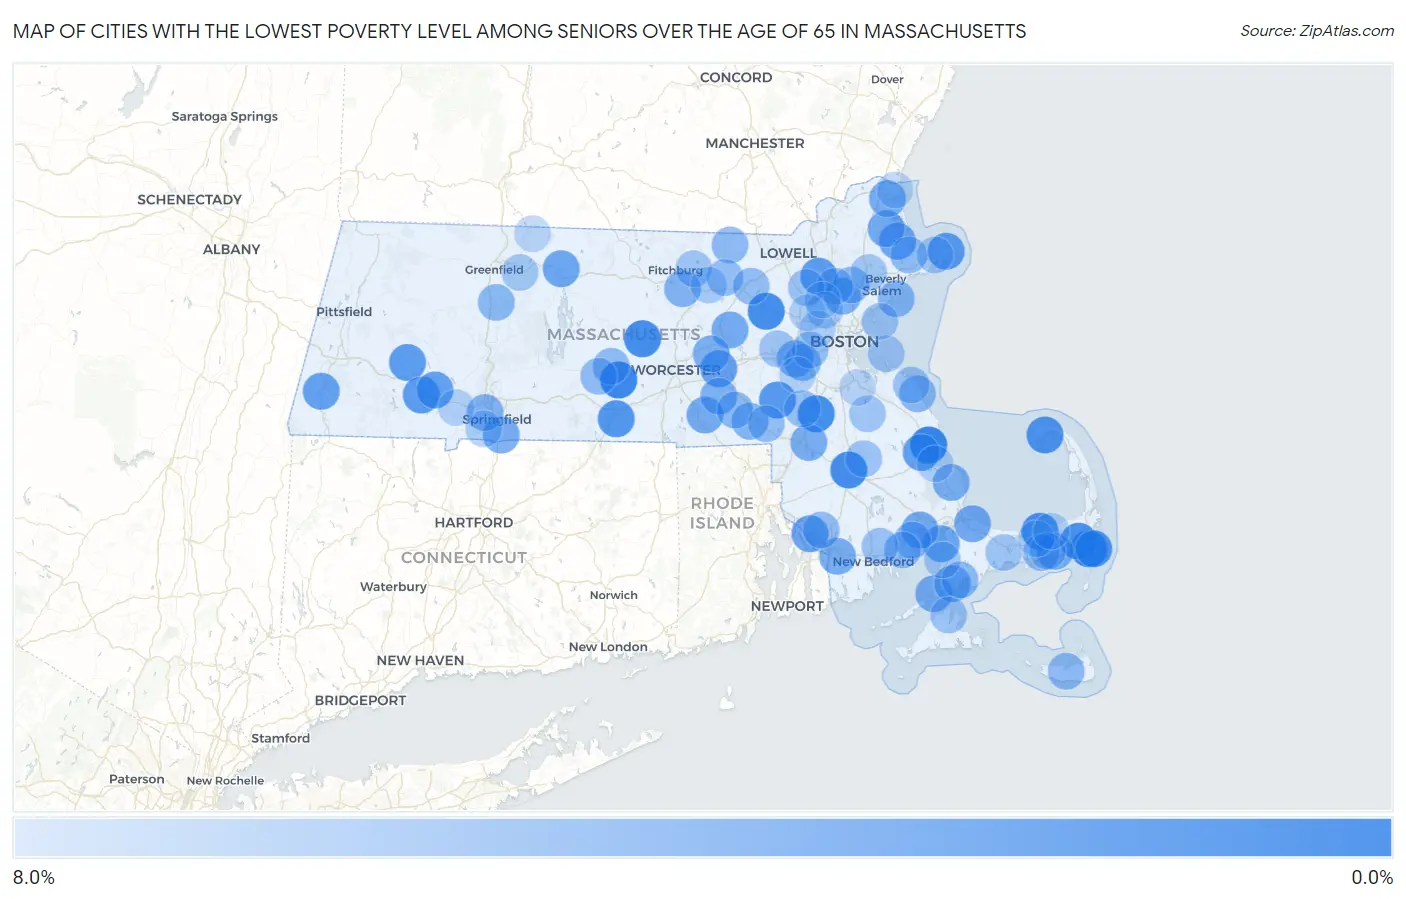
Map of Cities with the Lowest Poverty Level Among Seniors Over the Age of 65 in Massachusetts
8.0%
0.0%
Cities with the Lowest Poverty Level Among Seniors Over the Age of 65 in Massachusetts
| City | Senior Poverty | vs State | vs National | |
| 1. | West Warren | 1.1% | 9.9%(-8.84)#1 | 10.0%(-8.86)#330 |
| 2. | South Duxbury | 1.1% | 9.9%(-8.78)#2 | 10.0%(-8.81)#369 |
| 3. | East Brookfield | 1.3% | 9.9%(-8.66)#3 | 10.0%(-8.69)#458 |
| 4. | West Chatham | 1.4% | 9.9%(-8.57)#4 | 10.0%(-8.60)#545 |
| 5. | Rutland | 1.7% | 9.9%(-8.22)#5 | 10.0%(-8.25)#818 |
| 6. | West Concord | 1.7% | 9.9%(-8.18)#6 | 10.0%(-8.21)#855 |
| 7. | Sharon | 1.8% | 9.9%(-8.15)#7 | 10.0%(-8.18)#876 |
| 8. | Raynham Center | 1.9% | 9.9%(-8.07)#8 | 10.0%(-8.09)#953 |
| 9. | Dennis | 2.0% | 9.9%(-7.94)#9 | 10.0%(-7.97)#1,078 |
| 10. | East Harwich | 2.0% | 9.9%(-7.87)#10 | 10.0%(-7.90)#1,135 |
| 11. | Provincetown | 2.2% | 9.9%(-7.68)#11 | 10.0%(-7.71)#1,318 |
| 12. | Chatham | 2.4% | 9.9%(-7.54)#12 | 10.0%(-7.57)#1,457 |
| 13. | Sturbridge | 2.5% | 9.9%(-7.44)#13 | 10.0%(-7.47)#1,568 |
| 14. | Millis Clicquot | 2.7% | 9.9%(-7.26)#14 | 10.0%(-7.29)#1,782 |
| 15. | Chester | 2.9% | 9.9%(-6.98)#15 | 10.0%(-7.01)#2,100 |
| 16. | Blandford | 2.9% | 9.9%(-6.98)#16 | 10.0%(-7.01)#2,109 |
| 17. | Rockport | 3.0% | 9.9%(-6.95)#17 | 10.0%(-6.98)#2,148 |
| 18. | Wilmington | 3.0% | 9.9%(-6.90)#18 | 10.0%(-6.93)#2,200 |
| 19. | Kingston | 3.2% | 9.9%(-6.73)#19 | 10.0%(-6.76)#2,422 |
| 20. | Russell | 3.3% | 9.9%(-6.66)#20 | 10.0%(-6.69)#2,521 |
| 21. | Great Barrington | 3.4% | 9.9%(-6.56)#21 | 10.0%(-6.59)#2,672 |
| 22. | Ocean Grove | 3.4% | 9.9%(-6.49)#22 | 10.0%(-6.52)#2,763 |
| 23. | Westborough | 3.5% | 9.9%(-6.41)#23 | 10.0%(-6.44)#2,861 |
| 24. | Pocasset | 3.8% | 9.9%(-6.17)#24 | 10.0%(-6.19)#3,215 |
| 25. | Amherst | 3.8% | 9.9%(-6.12)#25 | 10.0%(-6.15)#3,262 |
| 26. | Ipswich | 3.8% | 9.9%(-6.11)#26 | 10.0%(-6.13)#3,293 |
| 27. | Orange | 3.8% | 9.9%(-6.10)#27 | 10.0%(-6.13)#3,297 |
| 28. | Sandwich | 4.0% | 9.9%(-5.93)#28 | 10.0%(-5.96)#3,527 |
| 29. | Weweantic | 4.0% | 9.9%(-5.92)#29 | 10.0%(-5.95)#3,534 |
| 30. | Rowley | 4.1% | 9.9%(-5.87)#30 | 10.0%(-5.90)#3,614 |
| 31. | Whitinsville | 4.1% | 9.9%(-5.87)#31 | 10.0%(-5.90)#3,621 |
| 32. | Hudson | 4.3% | 9.9%(-5.66)#32 | 10.0%(-5.69)#3,913 |
| 33. | Longmeadow | 4.4% | 9.9%(-5.55)#33 | 10.0%(-5.58)#4,082 |
| 34. | Newburyport | 4.4% | 9.9%(-5.55)#34 | 10.0%(-5.58)#4,083 |
| 35. | Woods Hole | 4.4% | 9.9%(-5.53)#35 | 10.0%(-5.56)#4,114 |
| 36. | North Westport | 4.4% | 9.9%(-5.52)#36 | 10.0%(-5.55)#4,136 |
| 37. | Mansfield Center | 4.4% | 9.9%(-5.52)#37 | 10.0%(-5.55)#4,138 |
| 38. | The Pinehills | 4.4% | 9.9%(-5.48)#38 | 10.0%(-5.51)#4,220 |
| 39. | Northborough | 4.5% | 9.9%(-5.41)#39 | 10.0%(-5.43)#4,307 |
| 40. | Wakefield | 4.6% | 9.9%(-5.31)#40 | 10.0%(-5.34)#4,448 |
| 41. | Dennis Port | 4.7% | 9.9%(-5.26)#41 | 10.0%(-5.29)#4,535 |
| 42. | Upton | 4.7% | 9.9%(-5.24)#42 | 10.0%(-5.26)#4,555 |
| 43. | West Springfield Town | 4.8% | 9.9%(-5.13)#43 | 10.0%(-5.16)#4,708 |
| 44. | Wellesley | 4.8% | 9.9%(-5.11)#44 | 10.0%(-5.14)#4,743 |
| 45. | Leominster | 4.9% | 9.9%(-5.04)#45 | 10.0%(-5.07)#4,830 |
| 46. | Teaticket | 4.9% | 9.9%(-5.01)#46 | 10.0%(-5.04)#4,867 |
| 47. | Bellingham | 5.0% | 9.9%(-4.91)#47 | 10.0%(-4.94)#5,025 |
| 48. | Needham | 5.0% | 9.9%(-4.89)#48 | 10.0%(-4.92)#5,049 |
| 49. | Marblehead | 5.1% | 9.9%(-4.86)#49 | 10.0%(-4.89)#5,081 |
| 50. | Scituate | 5.2% | 9.9%(-4.76)#50 | 10.0%(-4.79)#5,230 |
| 51. | South Deerfield | 5.3% | 9.9%(-4.66)#51 | 10.0%(-4.69)#5,373 |
| 52. | Marion Center | 5.3% | 9.9%(-4.66)#52 | 10.0%(-4.69)#5,378 |
| 53. | Hopedale | 5.4% | 9.9%(-4.48)#53 | 10.0%(-4.51)#5,672 |
| 54. | East Falmouth | 5.4% | 9.9%(-4.47)#54 | 10.0%(-4.50)#5,681 |
| 55. | Lynnfield | 5.5% | 9.9%(-4.43)#55 | 10.0%(-4.46)#5,757 |
| 56. | East Pepperell | 5.5% | 9.9%(-4.40)#56 | 10.0%(-4.43)#5,817 |
| 57. | Mattapoisett Center | 5.5% | 9.9%(-4.40)#57 | 10.0%(-4.43)#5,821 |
| 58. | Nantucket | 5.5% | 9.9%(-4.38)#58 | 10.0%(-4.41)#5,839 |
| 59. | North Brookfield | 5.6% | 9.9%(-4.34)#59 | 10.0%(-4.37)#5,925 |
| 60. | West Brookfield | 5.6% | 9.9%(-4.33)#60 | 10.0%(-4.36)#5,935 |
| 61. | Essex | 5.6% | 9.9%(-4.33)#61 | 10.0%(-4.35)#5,953 |
| 62. | South Yarmouth | 5.7% | 9.9%(-4.23)#62 | 10.0%(-4.26)#6,101 |
| 63. | Reading | 5.7% | 9.9%(-4.18)#63 | 10.0%(-4.20)#6,179 |
| 64. | Franklin Town | 5.7% | 9.9%(-4.17)#64 | 10.0%(-4.20)#6,182 |
| 65. | Somerset | 5.8% | 9.9%(-4.14)#65 | 10.0%(-4.17)#6,244 |
| 66. | Ayer | 5.8% | 9.9%(-4.10)#66 | 10.0%(-4.13)#6,296 |
| 67. | Littleton Common | 5.8% | 9.9%(-4.08)#67 | 10.0%(-4.11)#6,338 |
| 68. | Newton | 5.9% | 9.9%(-4.03)#68 | 10.0%(-4.06)#6,461 |
| 69. | Walpole | 5.9% | 9.9%(-3.98)#69 | 10.0%(-4.01)#6,524 |
| 70. | Acushnet Center | 6.1% | 9.9%(-3.86)#70 | 10.0%(-3.89)#6,689 |
| 71. | North Attleborough | 6.1% | 9.9%(-3.85)#71 | 10.0%(-3.88)#6,723 |
| 72. | Pinehurst | 6.1% | 9.9%(-3.79)#72 | 10.0%(-3.82)#6,825 |
| 73. | North Scituate | 6.1% | 9.9%(-3.78)#73 | 10.0%(-3.81)#6,844 |
| 74. | West Dennis | 6.2% | 9.9%(-3.67)#74 | 10.0%(-3.70)#6,984 |
| 75. | Bridgewater Town | 6.3% | 9.9%(-3.63)#75 | 10.0%(-3.66)#7,081 |
| 76. | Vineyard Haven | 6.3% | 9.9%(-3.63)#76 | 10.0%(-3.66)#7,082 |
| 77. | Barnstable Town | 6.3% | 9.9%(-3.60)#77 | 10.0%(-3.63)#7,119 |
| 78. | Cochituate | 6.4% | 9.9%(-3.56)#78 | 10.0%(-3.59)#7,180 |
| 79. | Lunenburg | 6.4% | 9.9%(-3.56)#79 | 10.0%(-3.59)#7,182 |
| 80. | Abington | 6.5% | 9.9%(-3.45)#80 | 10.0%(-3.48)#7,326 |
| 81. | Hull | 6.5% | 9.9%(-3.42)#81 | 10.0%(-3.44)#7,379 |
| 82. | Gloucester | 6.5% | 9.9%(-3.38)#82 | 10.0%(-3.41)#7,425 |
| 83. | Nahant | 6.6% | 9.9%(-3.37)#83 | 10.0%(-3.40)#7,444 |
| 84. | Millers Falls | 6.6% | 9.9%(-3.32)#84 | 10.0%(-3.35)#7,501 |
| 85. | Danvers | 6.6% | 9.9%(-3.30)#85 | 10.0%(-3.33)#7,535 |
| 86. | North Falmouth | 6.7% | 9.9%(-3.23)#86 | 10.0%(-3.26)#7,668 |
| 87. | Winchester | 6.8% | 9.9%(-3.10)#87 | 10.0%(-3.13)#7,868 |
| 88. | Shirley | 6.8% | 9.9%(-3.10)#88 | 10.0%(-3.12)#7,871 |
| 89. | Yarmouth Port | 7.0% | 9.9%(-2.90)#89 | 10.0%(-2.93)#8,149 |
| 90. | Agawam Town | 7.0% | 9.9%(-2.90)#90 | 10.0%(-2.93)#8,157 |
| 91. | Plymouth | 7.1% | 9.9%(-2.82)#91 | 10.0%(-2.85)#8,241 |
| 92. | Lexington | 7.2% | 9.9%(-2.76)#92 | 10.0%(-2.78)#8,381 |
| 93. | East Dennis | 7.2% | 9.9%(-2.72)#93 | 10.0%(-2.75)#8,414 |
| 94. | Belmont | 7.3% | 9.9%(-2.67)#94 | 10.0%(-2.70)#8,482 |
| 95. | Dover | 7.4% | 9.9%(-2.57)#95 | 10.0%(-2.60)#8,605 |
| 96. | Westfield | 7.4% | 9.9%(-2.56)#96 | 10.0%(-2.58)#8,624 |
| 97. | Woburn | 7.5% | 9.9%(-2.45)#97 | 10.0%(-2.48)#8,774 |
| 98. | Braintree Town | 7.5% | 9.9%(-2.39)#98 | 10.0%(-2.42)#8,850 |
| 99. | Salisbury | 7.6% | 9.9%(-2.37)#99 | 10.0%(-2.40)#8,888 |
| 100. | Northfield | 7.6% | 9.9%(-2.36)#100 | 10.0%(-2.39)#8,898 |
Common Questions
What are the Top 10 Cities with the Lowest Poverty Level Among Seniors Over the Age of 65 in Massachusetts?
Top 10 Cities with the Lowest Poverty Level Among Seniors Over the Age of 65 in Massachusetts are:
#1
1.1%
#2
1.3%
#3
1.4%
#4
1.7%
#5
1.7%
#6
1.8%
#7
1.9%
#8
2.0%
#9
2.0%
#10
2.2%
What city has the Lowest Poverty Level Among Seniors Over the Age of 65 in Massachusetts?
South Duxbury has the Lowest Poverty Level Among Seniors Over the Age of 65 in Massachusetts with 1.1%.
What is the Poverty Level Among Seniors Over the Age of 65 in the State of Massachusetts?
Poverty Level Among Seniors Over the Age of 65 in Massachusetts is 9.9%.
What is the Poverty Level Among Seniors Over the Age of 65 in the United States?
Poverty Level Among Seniors Over the Age of 65 in the United States is 10.0%.