San Juan Bautista, CA Map & Demographics
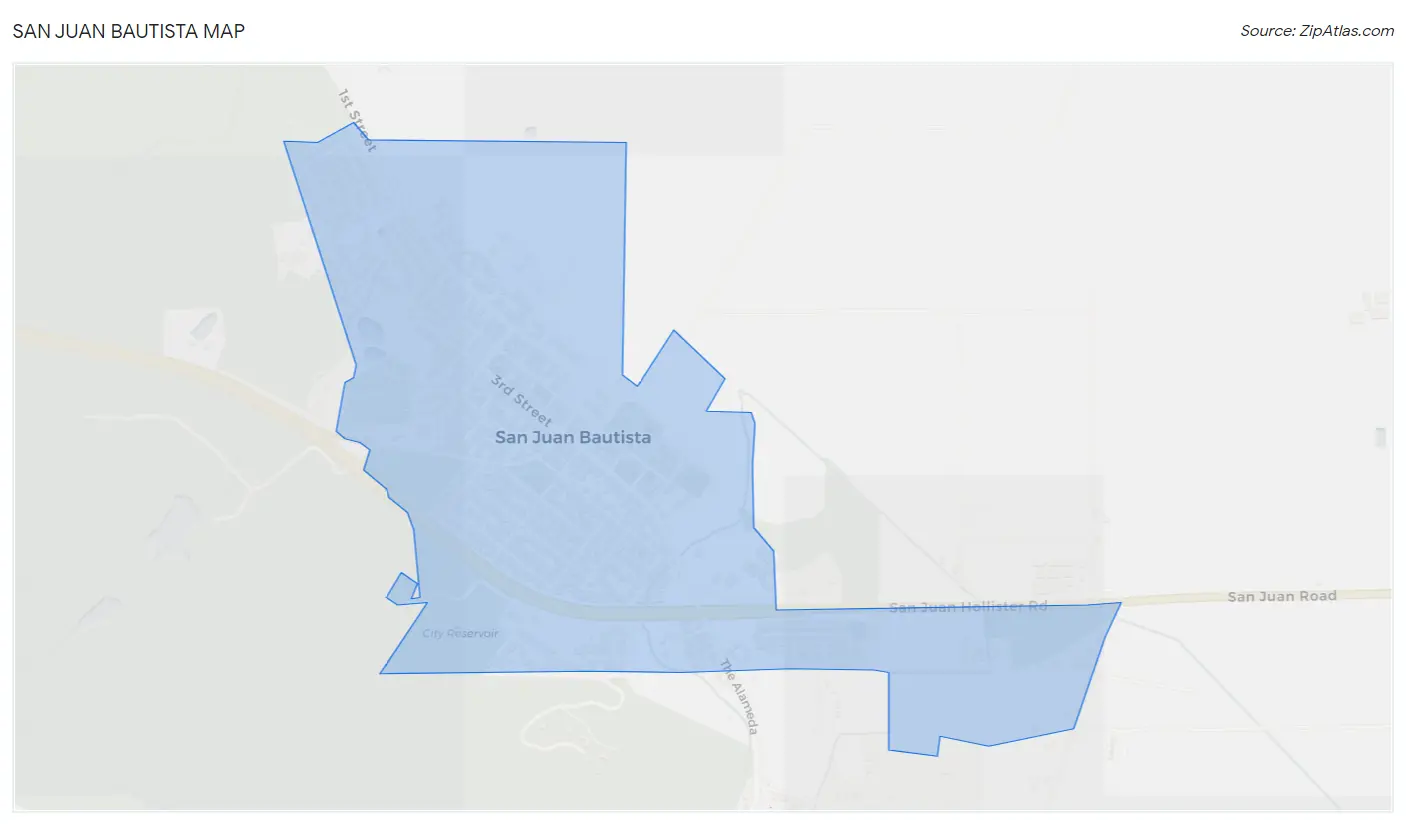
San Juan Bautista Map
San Juan Bautista Overview
$46,335
PER CAPITA INCOME
$122,639
AVG FAMILY INCOME
$103,036
AVG HOUSEHOLD INCOME
36.3%
WAGE / INCOME GAP [ % ]
63.7¢/ $1
WAGE / INCOME GAP [ $ ]
0.37
INEQUALITY / GINI INDEX
1,976
TOTAL POPULATION
1,017
MALE POPULATION
959
FEMALE POPULATION
106.05
MALES / 100 FEMALES
94.30
FEMALES / 100 MALES
40.2
MEDIAN AGE
3.1
AVG FAMILY SIZE
2.5
AVG HOUSEHOLD SIZE
1,029
LABOR FORCE [ PEOPLE ]
66.1%
PERCENT IN LABOR FORCE
2.3%
UNEMPLOYMENT RATE
San Juan Bautista Zip Codes
Income in San Juan Bautista
Income Overview in San Juan Bautista
Per Capita Income in San Juan Bautista is $46,335, while median incomes of families and households are $122,639 and $103,036 respectively.
| Characteristic | Number | Measure |
| Per Capita Income | 1,976 | $46,335 |
| Median Family Income | 515 | $122,639 |
| Mean Family Income | 515 | $139,959 |
| Median Household Income | 770 | $103,036 |
| Mean Household Income | 770 | $116,336 |
| Income Deficit | 515 | $0 |
| Wage / Income Gap (%) | 1,976 | 36.32% |
| Wage / Income Gap ($) | 1,976 | 63.68¢ per $1 |
| Gini / Inequality Index | 1,976 | 0.37 |
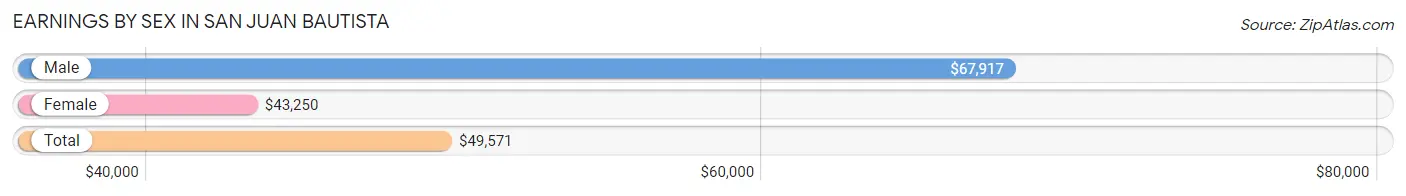
Earnings by Sex in San Juan Bautista
Average Earnings in San Juan Bautista are $49,571, $67,917 for men and $43,250 for women, a difference of 36.3%.
| Sex | Number | Average Earnings |
| Male | 590 (54.1%) | $67,917 |
| Female | 500 (45.9%) | $43,250 |
| Total | 1,090 (100.0%) | $49,571 |
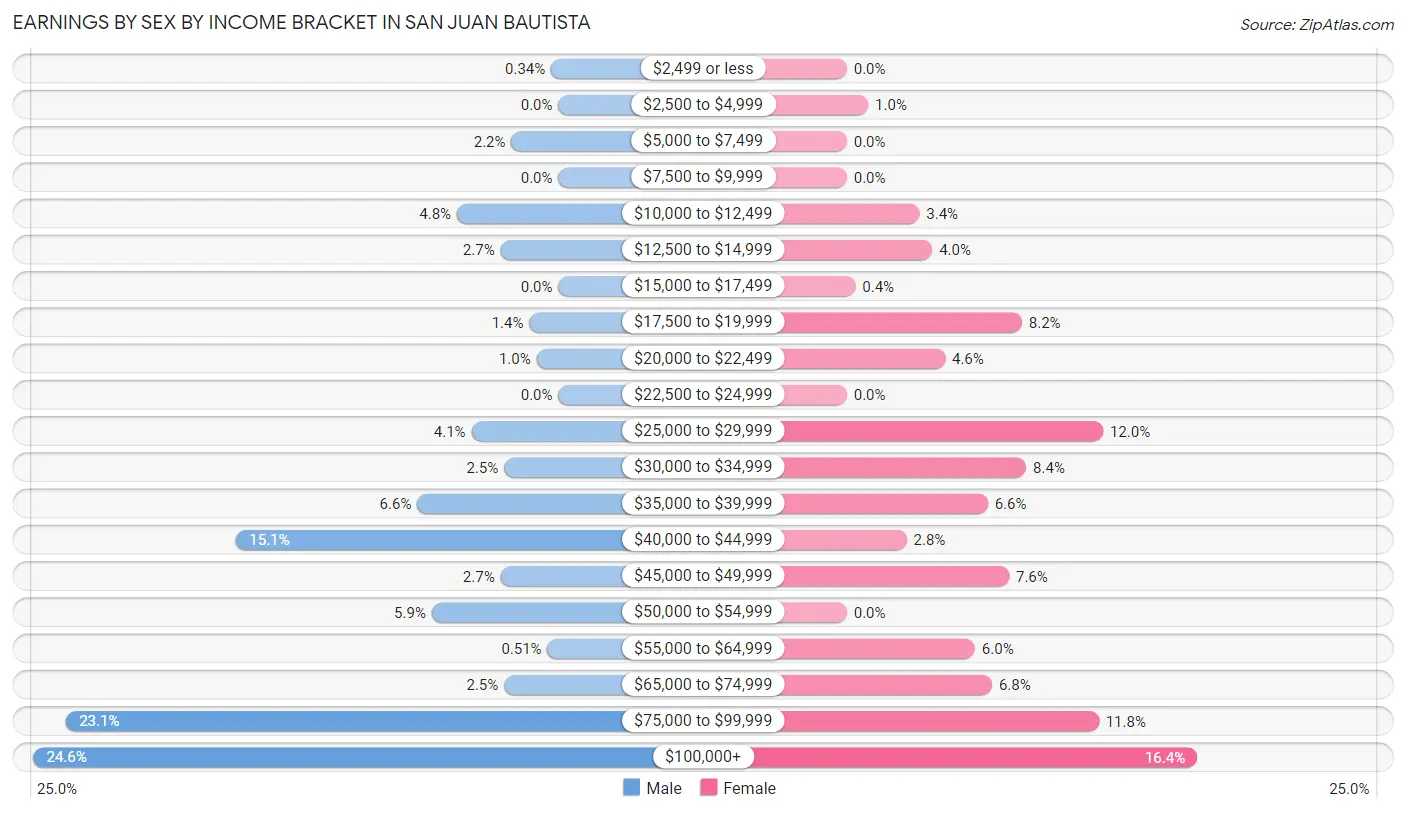
Earnings by Sex by Income Bracket in San Juan Bautista
The most common earnings brackets in San Juan Bautista are $100,000+ for men (145 | 24.6%) and $100,000+ for women (82 | 16.4%).
| Income | Male | Female |
| $2,499 or less | 2 (0.3%) | 0 (0.0%) |
| $2,500 to $4,999 | 0 (0.0%) | 5 (1.0%) |
| $5,000 to $7,499 | 13 (2.2%) | 0 (0.0%) |
| $7,500 to $9,999 | 0 (0.0%) | 0 (0.0%) |
| $10,000 to $12,499 | 28 (4.8%) | 17 (3.4%) |
| $12,500 to $14,999 | 16 (2.7%) | 20 (4.0%) |
| $15,000 to $17,499 | 0 (0.0%) | 2 (0.4%) |
| $17,500 to $19,999 | 8 (1.4%) | 41 (8.2%) |
| $20,000 to $22,499 | 6 (1.0%) | 23 (4.6%) |
| $22,500 to $24,999 | 0 (0.0%) | 0 (0.0%) |
| $25,000 to $29,999 | 24 (4.1%) | 60 (12.0%) |
| $30,000 to $34,999 | 15 (2.5%) | 42 (8.4%) |
| $35,000 to $39,999 | 39 (6.6%) | 33 (6.6%) |
| $40,000 to $44,999 | 89 (15.1%) | 14 (2.8%) |
| $45,000 to $49,999 | 16 (2.7%) | 38 (7.6%) |
| $50,000 to $54,999 | 35 (5.9%) | 0 (0.0%) |
| $55,000 to $64,999 | 3 (0.5%) | 30 (6.0%) |
| $65,000 to $74,999 | 15 (2.5%) | 34 (6.8%) |
| $75,000 to $99,999 | 136 (23.1%) | 59 (11.8%) |
| $100,000+ | 145 (24.6%) | 82 (16.4%) |
| Total | 590 (100.0%) | 500 (100.0%) |
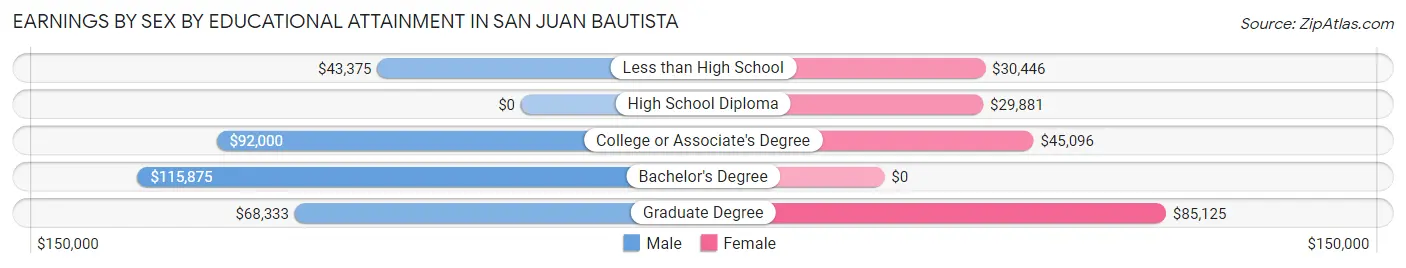
Earnings by Sex by Educational Attainment in San Juan Bautista
Average earnings in San Juan Bautista are $76,750 for men and $43,375 for women, a difference of 43.5%. Men with an educational attainment of bachelor's degree enjoy the highest average annual earnings of $115,875, while those with less than high school education earn the least with $43,375. Women with an educational attainment of graduate degree earn the most with the average annual earnings of $85,125, while those with high school diploma education have the smallest earnings of $29,881.
| Educational Attainment | Male Income | Female Income |
| Less than High School | $43,375 | $30,446 |
| High School Diploma | - | - |
| College or Associate's Degree | $92,000 | $45,096 |
| Bachelor's Degree | $115,875 | $0 |
| Graduate Degree | $68,333 | $85,125 |
| Total | $76,750 | $43,375 |
Family Income in San Juan Bautista
Family Income Brackets in San Juan Bautista
According to the San Juan Bautista family income data, there are 176 families falling into the $100,000 to $149,999 income range, which is the most common income bracket and makes up 34.2% of all families.
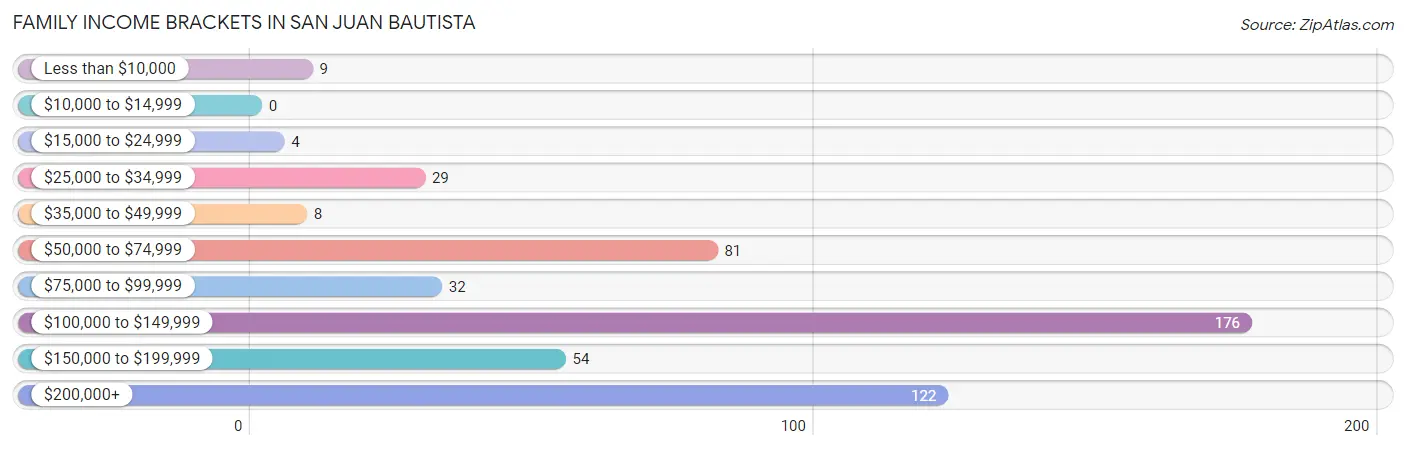
| Income Bracket | # Families | % Families |
| Less than $10,000 | 9 | 1.7% |
| $10,000 to $14,999 | 0 | 0.0% |
| $15,000 to $24,999 | 4 | 0.8% |
| $25,000 to $34,999 | 29 | 5.6% |
| $35,000 to $49,999 | 8 | 1.6% |
| $50,000 to $74,999 | 81 | 15.7% |
| $75,000 to $99,999 | 32 | 6.2% |
| $100,000 to $149,999 | 176 | 34.2% |
| $150,000 to $199,999 | 54 | 10.5% |
| $200,000+ | 122 | 23.7% |
Family Income by Famaliy Size in San Juan Bautista
4-person families (111 | 21.5%) account for the highest median family income in San Juan Bautista with $189,625 per family, while 3-person families (89 | 17.3%) have the highest median income of $48,523 per family member.
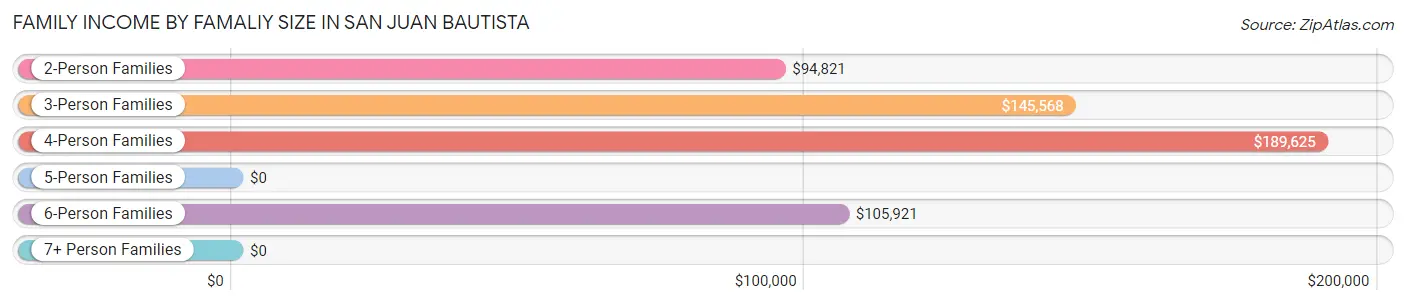
| Income Bracket | # Families | Median Income |
| 2-Person Families | 253 (49.1%) | $94,821 |
| 3-Person Families | 89 (17.3%) | $145,568 |
| 4-Person Families | 111 (21.5%) | $189,625 |
| 5-Person Families | 28 (5.4%) | $0 |
| 6-Person Families | 34 (6.6%) | $105,921 |
| 7+ Person Families | 0 (0.0%) | $0 |
| Total | 515 (100.0%) | $122,639 |
Family Income by Number of Earners in San Juan Bautista
The median family income in San Juan Bautista is $122,639, with families comprising 3+ earners (50) having the highest median family income of $250,001, while families with no earners (47) have the lowest median family income of $50,781, accounting for 9.7% and 9.1% of families, respectively.
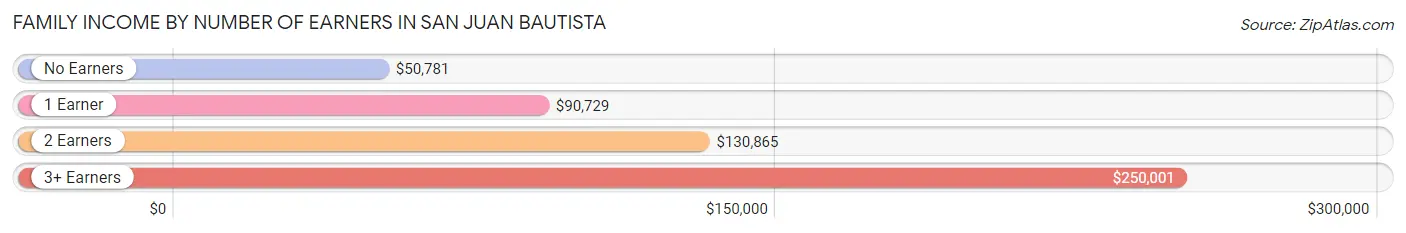
| Number of Earners | # Families | Median Income |
| No Earners | 47 (9.1%) | $50,781 |
| 1 Earner | 173 (33.6%) | $90,729 |
| 2 Earners | 245 (47.6%) | $130,865 |
| 3+ Earners | 50 (9.7%) | $250,001 |
| Total | 515 (100.0%) | $122,639 |
Household Income in San Juan Bautista
Household Income Brackets in San Juan Bautista
With 224 households falling in the category, the $100,000 to $149,999 income range is the most frequent in San Juan Bautista, accounting for 29.1% of all households. In contrast, only 7 households (0.9%) fall into the less than $10,000 income bracket, making it the least populous group.
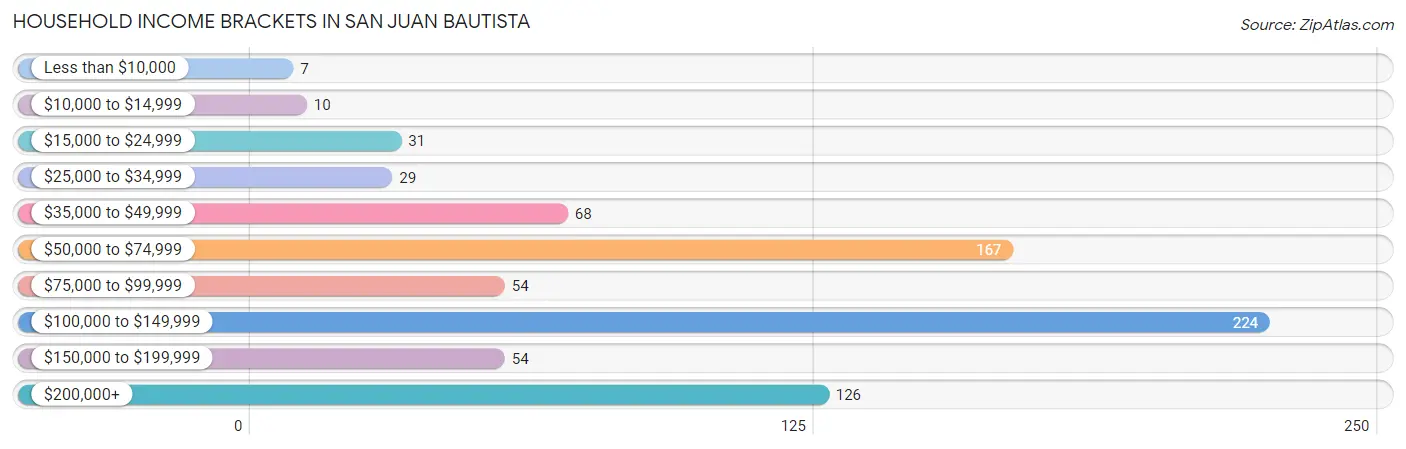
| Income Bracket | # Households | % Households |
| Less than $10,000 | 7 | 0.9% |
| $10,000 to $14,999 | 10 | 1.3% |
| $15,000 to $24,999 | 31 | 4.0% |
| $25,000 to $34,999 | 29 | 3.8% |
| $35,000 to $49,999 | 68 | 8.8% |
| $50,000 to $74,999 | 167 | 21.7% |
| $75,000 to $99,999 | 54 | 7.0% |
| $100,000 to $149,999 | 224 | 29.1% |
| $150,000 to $199,999 | 54 | 7.0% |
| $200,000+ | 126 | 16.4% |
Household Income by Householder Age in San Juan Bautista
The median household income in San Juan Bautista is $103,036, with the highest median household income of $113,088 found in the 25 to 44 years age bracket for the primary householder. A total of 272 households (35.3%) fall into this category. Meanwhile, the 15 to 24 years age bracket for the primary householder has the lowest median household income of $0, with 19 households (2.5%) in this group.
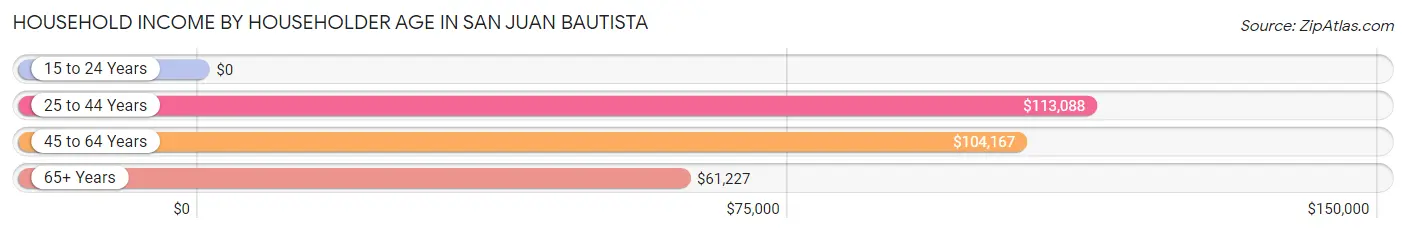
| Income Bracket | # Households | Median Income |
| 15 to 24 Years | 19 (2.5%) | $0 |
| 25 to 44 Years | 272 (35.3%) | $113,088 |
| 45 to 64 Years | 234 (30.4%) | $104,167 |
| 65+ Years | 245 (31.8%) | $61,227 |
| Total | 770 (100.0%) | $103,036 |
Poverty in San Juan Bautista
Income Below Poverty by Sex and Age in San Juan Bautista
With 4.3% poverty level for males and 9.7% for females among the residents of San Juan Bautista, 16 and 17 year old males and 18 to 24 year old females are the most vulnerable to poverty, with 9 males (24.3%) and 28 females (38.4%) in their respective age groups living below the poverty level.
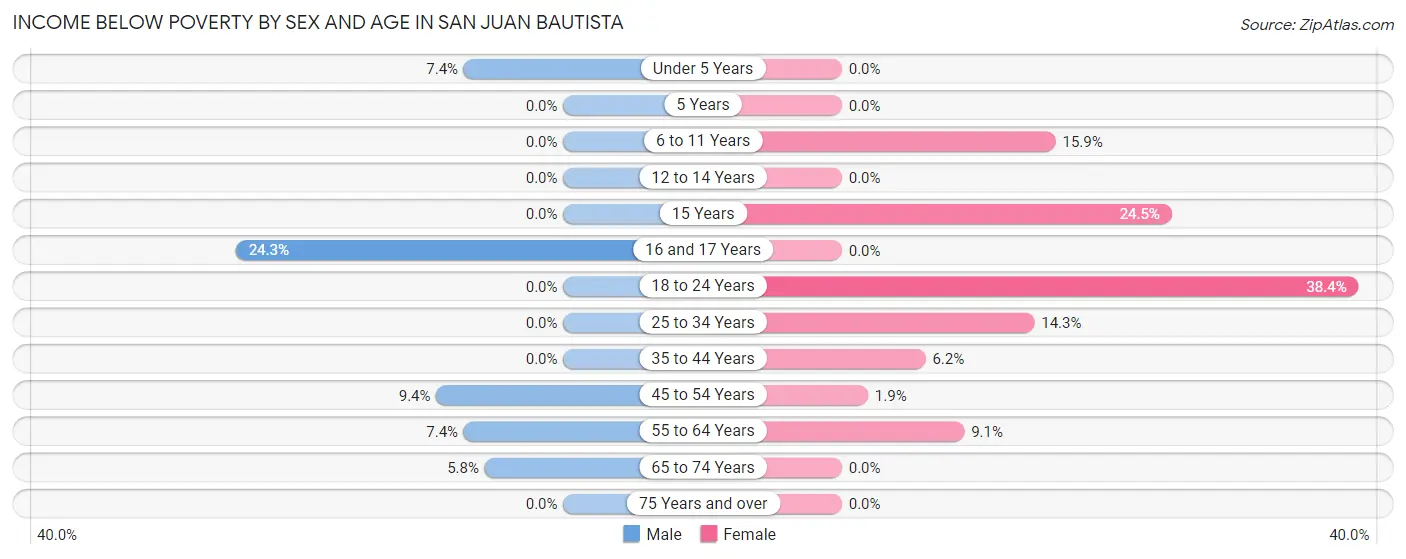
| Age Bracket | Male | Female |
| Under 5 Years | 9 (7.4%) | 0 (0.0%) |
| 5 Years | 0 (0.0%) | 0 (0.0%) |
| 6 to 11 Years | 0 (0.0%) | 10 (15.9%) |
| 12 to 14 Years | 0 (0.0%) | 0 (0.0%) |
| 15 Years | 0 (0.0%) | 12 (24.5%) |
| 16 and 17 Years | 9 (24.3%) | 0 (0.0%) |
| 18 to 24 Years | 0 (0.0%) | 28 (38.4%) |
| 25 to 34 Years | 0 (0.0%) | 21 (14.3%) |
| 35 to 44 Years | 0 (0.0%) | 10 (6.2%) |
| 45 to 54 Years | 10 (9.4%) | 2 (1.9%) |
| 55 to 64 Years | 9 (7.4%) | 10 (9.1%) |
| 65 to 74 Years | 7 (5.8%) | 0 (0.0%) |
| 75 Years and over | 0 (0.0%) | 0 (0.0%) |
| Total | 44 (4.3%) | 93 (9.7%) |
Income Above Poverty by Sex and Age in San Juan Bautista
According to the poverty statistics in San Juan Bautista, males aged 5 years and females aged under 5 years are the age groups that are most secure financially, with 100.0% of males and 100.0% of females in these age groups living above the poverty line.
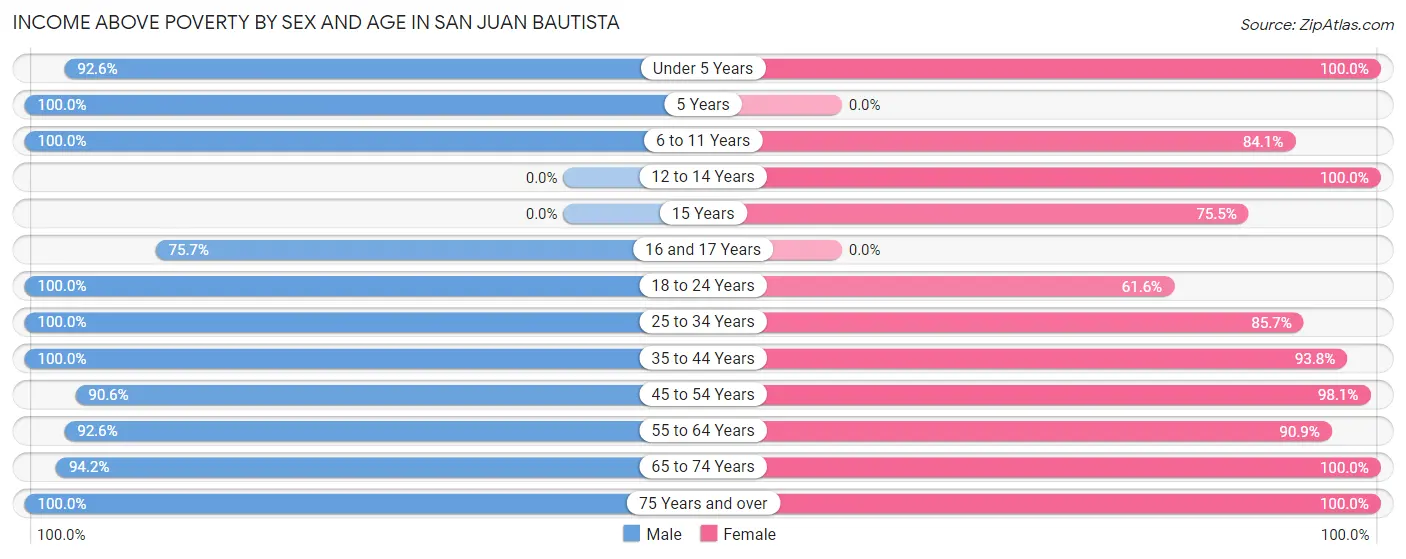
| Age Bracket | Male | Female |
| Under 5 Years | 113 (92.6%) | 55 (100.0%) |
| 5 Years | 33 (100.0%) | 0 (0.0%) |
| 6 to 11 Years | 87 (100.0%) | 53 (84.1%) |
| 12 to 14 Years | 0 (0.0%) | 11 (100.0%) |
| 15 Years | 0 (0.0%) | 37 (75.5%) |
| 16 and 17 Years | 28 (75.7%) | 0 (0.0%) |
| 18 to 24 Years | 33 (100.0%) | 45 (61.6%) |
| 25 to 34 Years | 136 (100.0%) | 126 (85.7%) |
| 35 to 44 Years | 147 (100.0%) | 151 (93.8%) |
| 45 to 54 Years | 96 (90.6%) | 101 (98.1%) |
| 55 to 64 Years | 113 (92.6%) | 100 (90.9%) |
| 65 to 74 Years | 113 (94.2%) | 61 (100.0%) |
| 75 Years and over | 74 (100.0%) | 126 (100.0%) |
| Total | 973 (95.7%) | 866 (90.3%) |
Income Below Poverty Among Married-Couple Families in San Juan Bautista
The poverty statistics for married-couple families in San Juan Bautista show that 2.2% or 10 of the total 455 families live below the poverty line. Families with 1 or 2 children have the highest poverty rate of 6.9%, comprising of 10 families. On the other hand, families with no children have the lowest poverty rate of 0.0%, which includes 0 families.
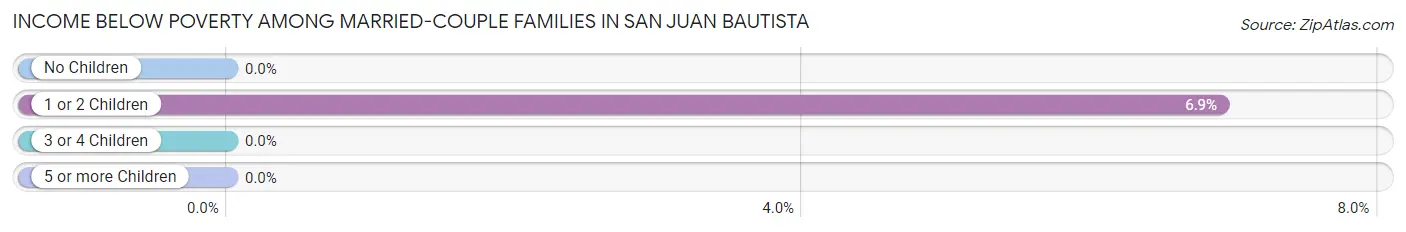
| Children | Above Poverty | Below Poverty |
| No Children | 267 (100.0%) | 0 (0.0%) |
| 1 or 2 Children | 135 (93.1%) | 10 (6.9%) |
| 3 or 4 Children | 43 (100.0%) | 0 (0.0%) |
| 5 or more Children | 0 (0.0%) | 0 (0.0%) |
| Total | 445 (97.8%) | 10 (2.2%) |
Income Below Poverty Among Single-Parent Households in San Juan Bautista
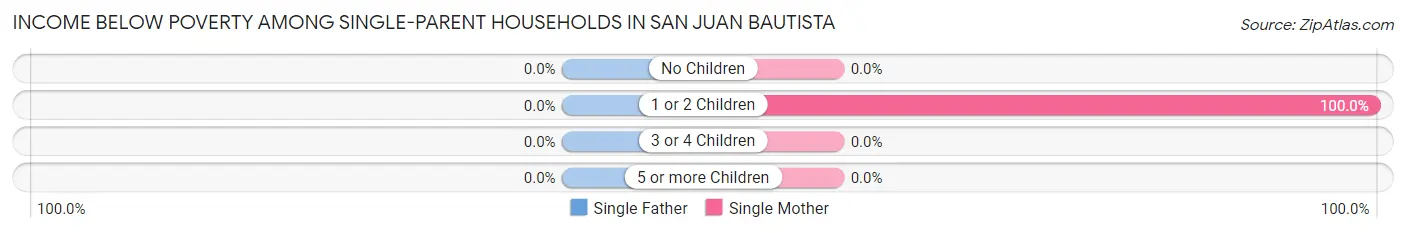
| Children | Single Father | Single Mother |
| No Children | 0 (0.0%) | 0 (0.0%) |
| 1 or 2 Children | 0 (0.0%) | 19 (100.0%) |
| 3 or 4 Children | 0 (0.0%) | 0 (0.0%) |
| 5 or more Children | 0 (0.0%) | 0 (0.0%) |
| Total | 0 (0.0%) | 19 (55.9%) |
Income Below Poverty Among Married-Couple vs Single-Parent Households in San Juan Bautista
The poverty data for San Juan Bautista shows that 10 of the married-couple family households (2.2%) and 19 of the single-parent households (31.7%) are living below the poverty level. Within the married-couple family households, those with 1 or 2 children have the highest poverty rate, with 10 households (6.9%) falling below the poverty line. Among the single-parent households, those with 1 or 2 children have the highest poverty rate, with 19 household (73.1%) living below poverty.
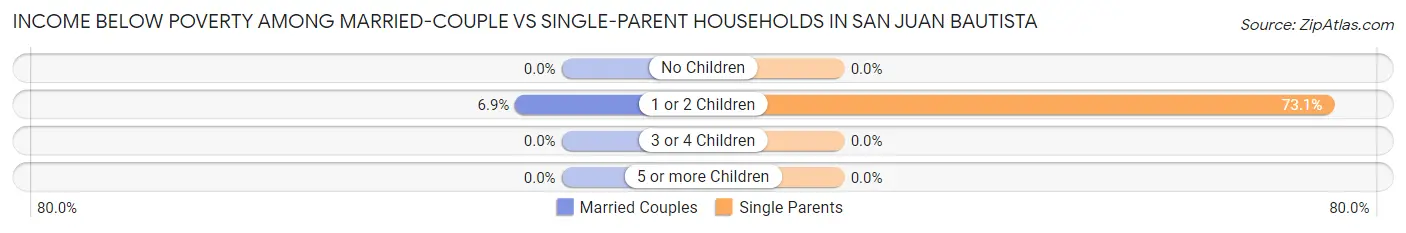
| Children | Married-Couple Families | Single-Parent Households |
| No Children | 0 (0.0%) | 0 (0.0%) |
| 1 or 2 Children | 10 (6.9%) | 19 (73.1%) |
| 3 or 4 Children | 0 (0.0%) | 0 (0.0%) |
| 5 or more Children | 0 (0.0%) | 0 (0.0%) |
| Total | 10 (2.2%) | 19 (31.7%) |
Race in San Juan Bautista
The most populous races in San Juan Bautista are White / Caucasian (1,125 | 56.9%), Hispanic or Latino (1,073 | 54.3%), and Two or more Races (558 | 28.2%).
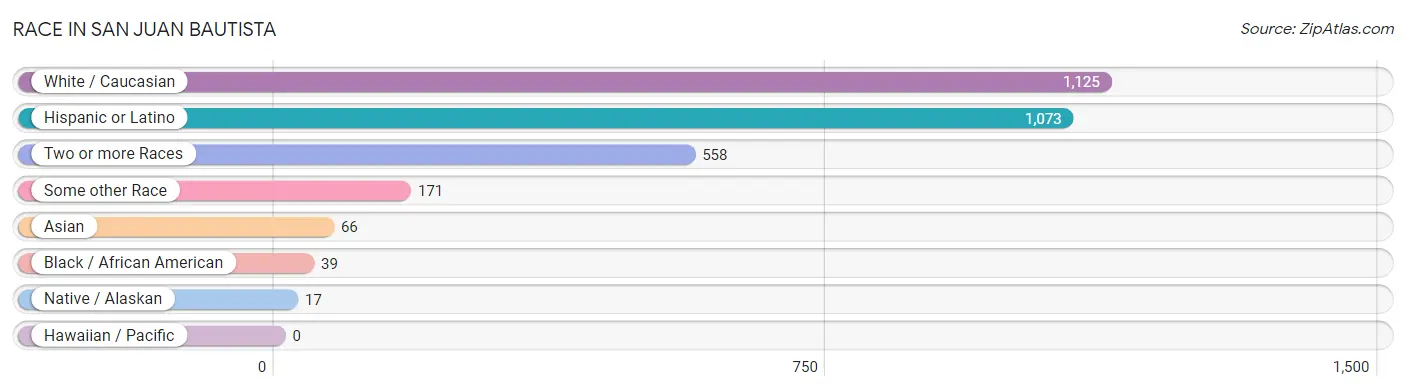
| Race | # Population | % Population |
| Asian | 66 | 3.3% |
| Black / African American | 39 | 2.0% |
| Hawaiian / Pacific | 0 | 0.0% |
| Hispanic or Latino | 1,073 | 54.3% |
| Native / Alaskan | 17 | 0.9% |
| White / Caucasian | 1,125 | 56.9% |
| Two or more Races | 558 | 28.2% |
| Some other Race | 171 | 8.6% |
| Total | 1,976 | 100.0% |
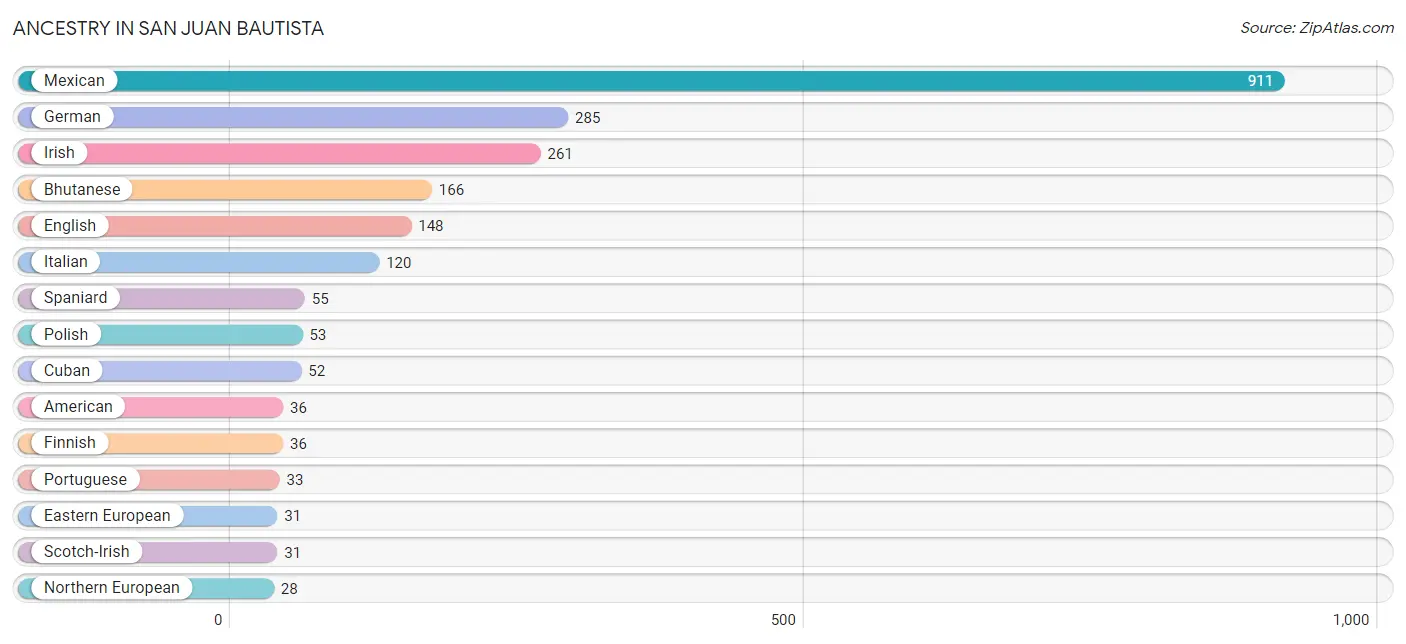
Ancestry in San Juan Bautista
The most populous ancestries reported in San Juan Bautista are Mexican (911 | 46.1%), German (285 | 14.4%), Irish (261 | 13.2%), Bhutanese (166 | 8.4%), and English (148 | 7.5%), together accounting for 89.6% of all San Juan Bautista residents.
| Ancestry | # Population | % Population |
| American | 36 | 1.8% |
| Austrian | 20 | 1.0% |
| Basque | 8 | 0.4% |
| Belgian | 9 | 0.5% |
| Bhutanese | 166 | 8.4% |
| British | 2 | 0.1% |
| Central American | 23 | 1.2% |
| Cherokee | 10 | 0.5% |
| Cuban | 52 | 2.6% |
| Danish | 24 | 1.2% |
| Dominican | 9 | 0.5% |
| Eastern European | 31 | 1.6% |
| English | 148 | 7.5% |
| Finnish | 36 | 1.8% |
| French | 24 | 1.2% |
| German | 285 | 14.4% |
| Greek | 9 | 0.5% |
| Hungarian | 8 | 0.4% |
| Indian (Asian) | 5 | 0.3% |
| Irish | 261 | 13.2% |
| Italian | 120 | 6.1% |
| Korean | 26 | 1.3% |
| Lithuanian | 25 | 1.3% |
| Mexican | 911 | 46.1% |
| Mexican American Indian | 8 | 0.4% |
| Native Hawaiian | 2 | 0.1% |
| Nigerian | 16 | 0.8% |
| Northern European | 28 | 1.4% |
| Panamanian | 15 | 0.8% |
| Polish | 53 | 2.7% |
| Portuguese | 33 | 1.7% |
| Russian | 18 | 0.9% |
| Salvadoran | 8 | 0.4% |
| Scandinavian | 8 | 0.4% |
| Scotch-Irish | 31 | 1.6% |
| Scottish | 28 | 1.4% |
| Sierra Leonean | 2 | 0.1% |
| Slovak | 2 | 0.1% |
| Spaniard | 55 | 2.8% |
| Subsaharan African | 18 | 0.9% |
| Swedish | 9 | 0.5% | View All 41 Rows |
Immigrants in San Juan Bautista
The most numerous immigrant groups reported in San Juan Bautista came from Central America (151 | 7.6%), Latin America (151 | 7.6%), Mexico (147 | 7.4%), Asia (24 | 1.2%), and Eastern Asia (24 | 1.2%), together accounting for 25.1% of all San Juan Bautista residents.
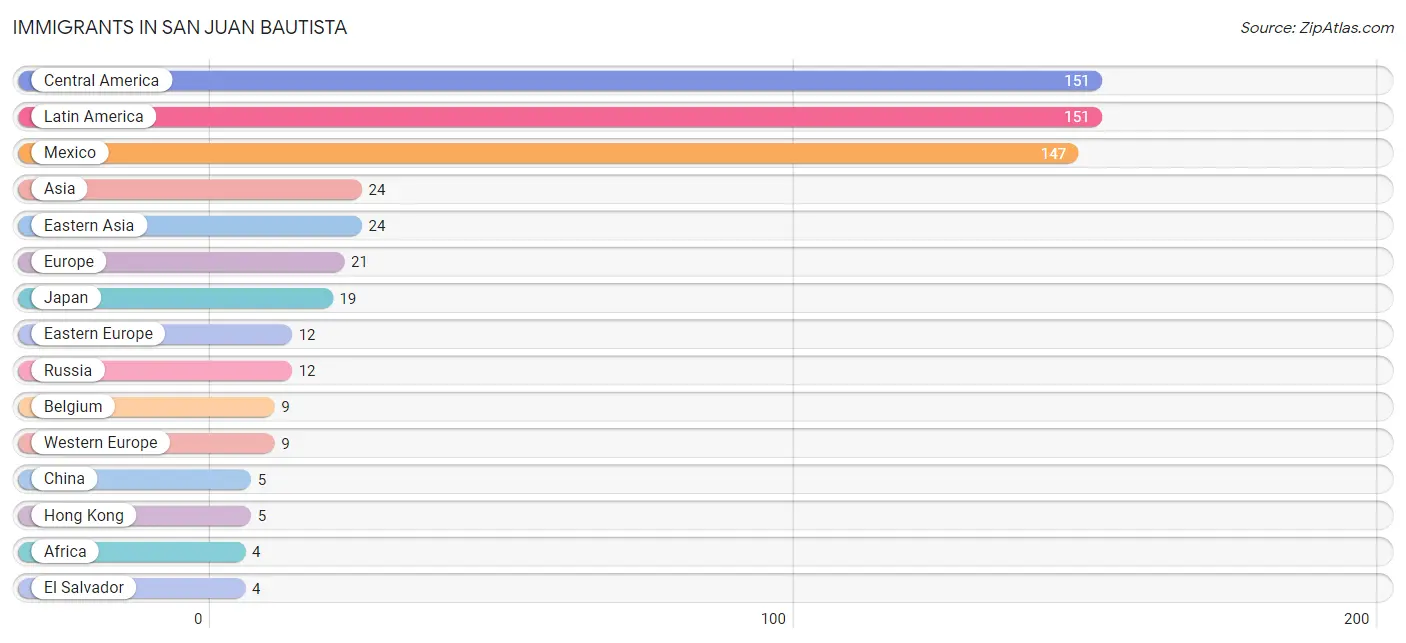
| Immigration Origin | # Population | % Population |
| Africa | 4 | 0.2% |
| Asia | 24 | 1.2% |
| Belgium | 9 | 0.5% |
| Central America | 151 | 7.6% |
| China | 5 | 0.3% |
| Eastern Asia | 24 | 1.2% |
| Eastern Europe | 12 | 0.6% |
| El Salvador | 4 | 0.2% |
| Europe | 21 | 1.1% |
| Ghana | 4 | 0.2% |
| Hong Kong | 5 | 0.3% |
| Japan | 19 | 1.0% |
| Latin America | 151 | 7.6% |
| Mexico | 147 | 7.4% |
| Russia | 12 | 0.6% |
| Western Africa | 4 | 0.2% |
| Western Europe | 9 | 0.5% | View All 17 Rows |
Sex and Age in San Juan Bautista
Sex and Age in San Juan Bautista
The most populous age groups in San Juan Bautista are Under 5 Years (122 | 12.0%) for men and 35 to 39 Years (102 | 10.6%) for women.
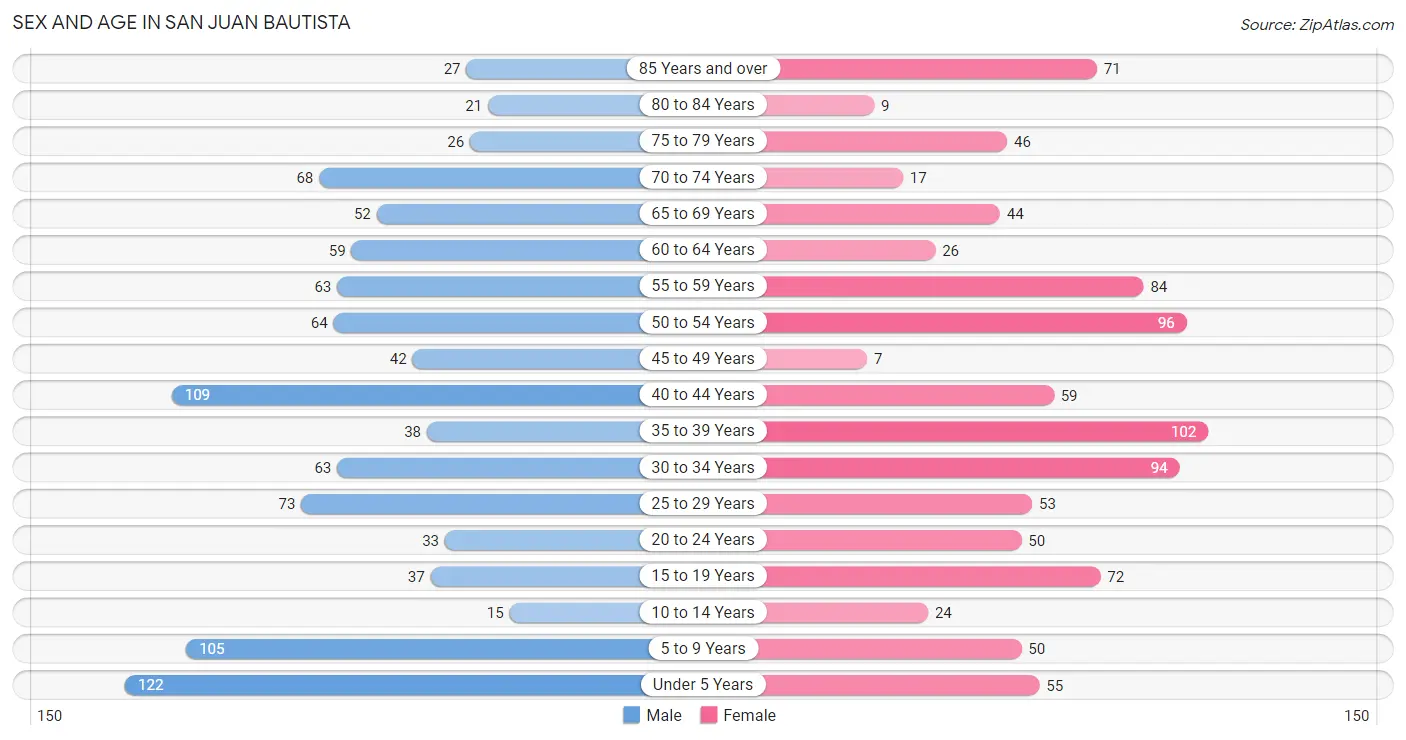
| Age Bracket | Male | Female |
| Under 5 Years | 122 (12.0%) | 55 (5.7%) |
| 5 to 9 Years | 105 (10.3%) | 50 (5.2%) |
| 10 to 14 Years | 15 (1.5%) | 24 (2.5%) |
| 15 to 19 Years | 37 (3.6%) | 72 (7.5%) |
| 20 to 24 Years | 33 (3.2%) | 50 (5.2%) |
| 25 to 29 Years | 73 (7.2%) | 53 (5.5%) |
| 30 to 34 Years | 63 (6.2%) | 94 (9.8%) |
| 35 to 39 Years | 38 (3.7%) | 102 (10.6%) |
| 40 to 44 Years | 109 (10.7%) | 59 (6.1%) |
| 45 to 49 Years | 42 (4.1%) | 7 (0.7%) |
| 50 to 54 Years | 64 (6.3%) | 96 (10.0%) |
| 55 to 59 Years | 63 (6.2%) | 84 (8.8%) |
| 60 to 64 Years | 59 (5.8%) | 26 (2.7%) |
| 65 to 69 Years | 52 (5.1%) | 44 (4.6%) |
| 70 to 74 Years | 68 (6.7%) | 17 (1.8%) |
| 75 to 79 Years | 26 (2.6%) | 46 (4.8%) |
| 80 to 84 Years | 21 (2.1%) | 9 (0.9%) |
| 85 Years and over | 27 (2.6%) | 71 (7.4%) |
| Total | 1,017 (100.0%) | 959 (100.0%) |
Families and Households in San Juan Bautista
Median Family Size in San Juan Bautista
The median family size in San Juan Bautista is 3.13 persons per family, with married-couple families (455 | 88.3%) accounting for the largest median family size of 3.22 persons per family. On the other hand, single male/father families (26 | 5.1%) represent the smallest median family size with 2.23 persons per family.
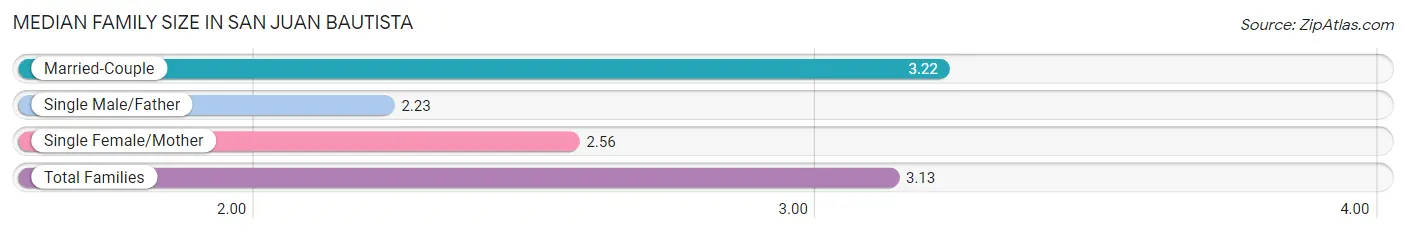
| Family Type | # Families | Family Size |
| Married-Couple | 455 (88.3%) | 3.22 |
| Single Male/Father | 26 (5.1%) | 2.23 |
| Single Female/Mother | 34 (6.6%) | 2.56 |
| Total Families | 515 (100.0%) | 3.13 |
Median Household Size in San Juan Bautista
The median household size in San Juan Bautista is 2.52 persons per household, with married-couple households (455 | 59.1%) accounting for the largest median household size of 3.22 persons per household. non-family households (255 | 33.1%) represent the smallest median household size with 1.18 persons per household.
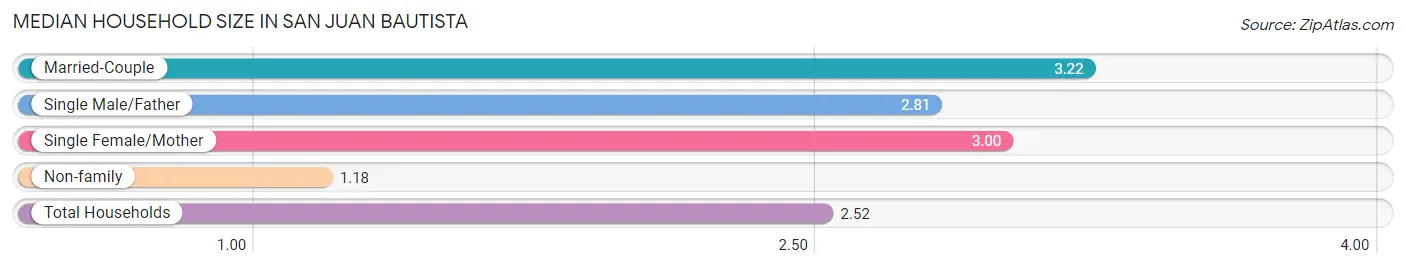
| Household Type | # Households | Household Size |
| Married-Couple | 455 (59.1%) | 3.22 |
| Single Male/Father | 26 (3.4%) | 2.81 |
| Single Female/Mother | 34 (4.4%) | 3.00 |
| Non-family | 255 (33.1%) | 1.18 |
| Total Households | 770 (100.0%) | 2.52 |
Household Size by Marriage Status in San Juan Bautista
Out of a total of 770 households in San Juan Bautista, 515 (66.9%) are family households, while 255 (33.1%) are nonfamily households. The most numerous type of family households are 2-person households, comprising 220, and the most common type of nonfamily households are 1-person households, comprising 224.
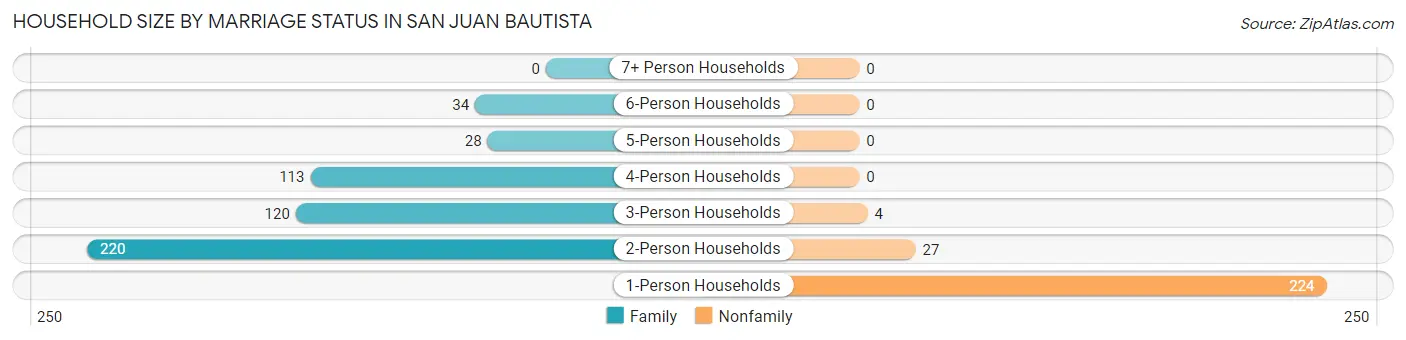
| Household Size | Family Households | Nonfamily Households |
| 1-Person Households | - | 224 (29.1%) |
| 2-Person Households | 220 (28.6%) | 27 (3.5%) |
| 3-Person Households | 120 (15.6%) | 4 (0.5%) |
| 4-Person Households | 113 (14.7%) | 0 (0.0%) |
| 5-Person Households | 28 (3.6%) | 0 (0.0%) |
| 6-Person Households | 34 (4.4%) | 0 (0.0%) |
| 7+ Person Households | 0 (0.0%) | 0 (0.0%) |
| Total | 515 (66.9%) | 255 (33.1%) |
Female Fertility in San Juan Bautista
Fertility by Age in San Juan Bautista
Average fertility rate in San Juan Bautista is 88.0 births per 1,000 women. Women in the age bracket of 20 to 34 years have the highest fertility rate with 208.0 births per 1,000 women. Women in the age bracket of 20 to 34 years acount for 100.0% of all women with births.
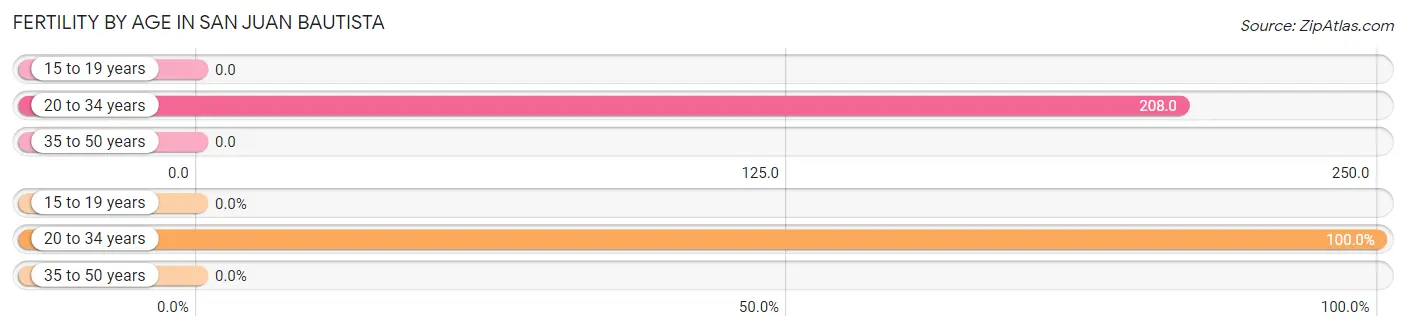
| Age Bracket | Women with Births | Births / 1,000 Women |
| 15 to 19 years | 0 (0.0%) | 0.0 |
| 20 to 34 years | 41 (100.0%) | 208.0 |
| 35 to 50 years | 0 (0.0%) | 0.0 |
| Total | 41 (100.0%) | 88.0 |
Fertility by Age by Marriage Status in San Juan Bautista
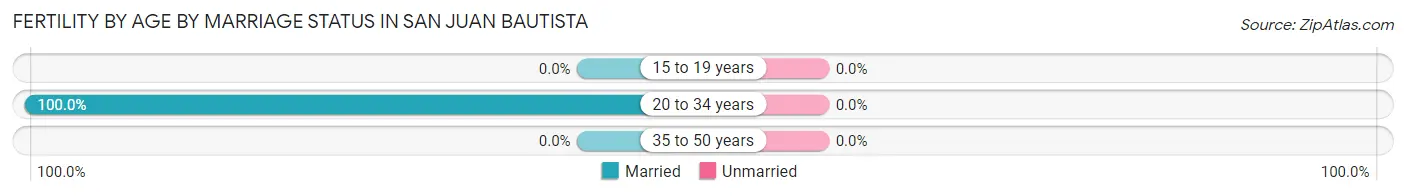
| Age Bracket | Married | Unmarried |
| 15 to 19 years | 0 (0.0%) | 0 (0.0%) |
| 20 to 34 years | 41 (100.0%) | 0 (0.0%) |
| 35 to 50 years | 0 (0.0%) | 0 (0.0%) |
| Total | 41 (100.0%) | 0 (0.0%) |
Fertility by Education in San Juan Bautista
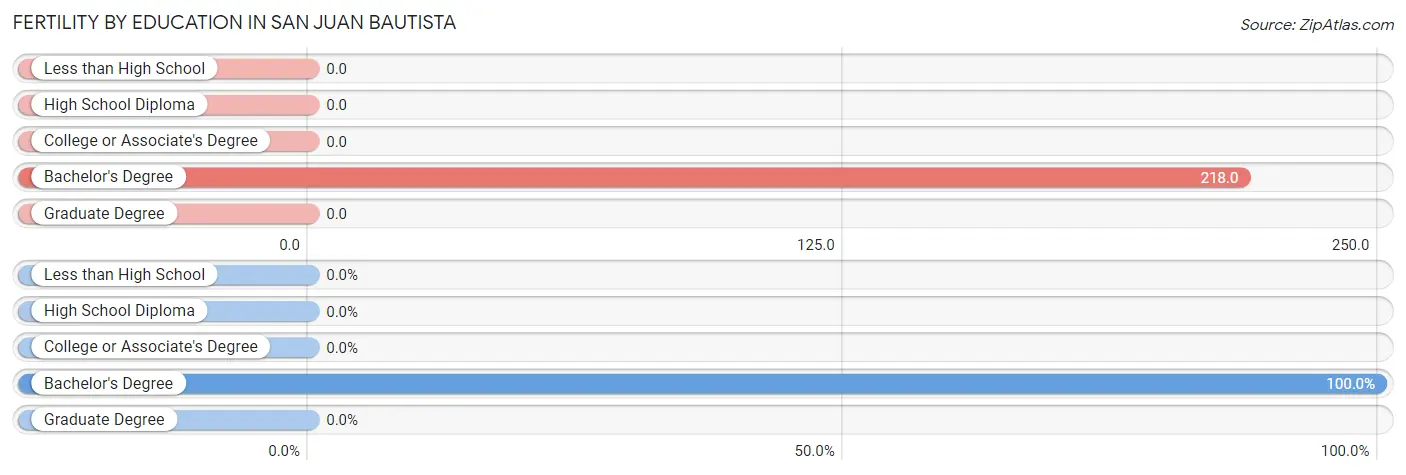
| Educational Attainment | Women with Births | Births / 1,000 Women |
| Less than High School | 0 (0.0%) | 0.0 |
| High School Diploma | 0 (0.0%) | 0.0 |
| College or Associate's Degree | 0 (0.0%) | 0.0 |
| Bachelor's Degree | 41 (100.0%) | 218.0 |
| Graduate Degree | 0 (0.0%) | 0.0 |
| Total | 41 (100.0%) | 88.0 |
Fertility by Education by Marriage Status in San Juan Bautista
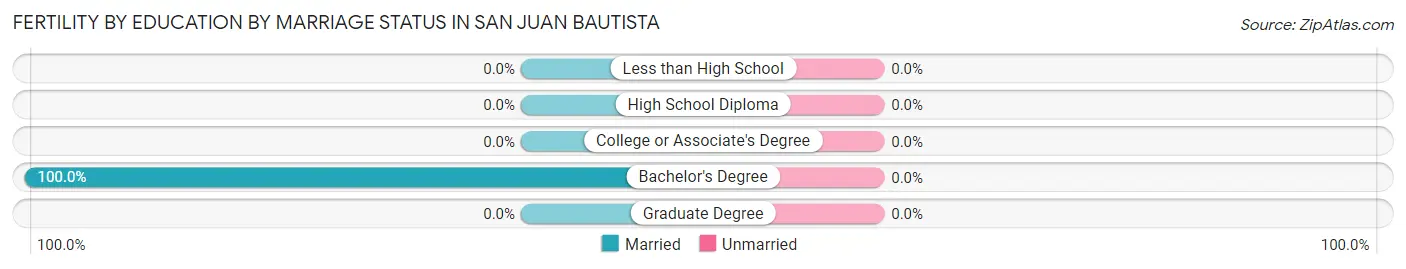
| Educational Attainment | Married | Unmarried |
| Less than High School | 0 (0.0%) | 0 (0.0%) |
| High School Diploma | 0 (0.0%) | 0 (0.0%) |
| College or Associate's Degree | 0 (0.0%) | 0 (0.0%) |
| Bachelor's Degree | 41 (100.0%) | 0 (0.0%) |
| Graduate Degree | 0 (0.0%) | 0 (0.0%) |
| Total | 41 (100.0%) | 0 (0.0%) |
Employment Characteristics in San Juan Bautista
Employment by Class of Employer in San Juan Bautista
Among the 959 employed individuals in San Juan Bautista, private company employees (615 | 64.1%), local government employees (225 | 23.5%), and state government employees (54 | 5.6%) make up the most common classes of employment.
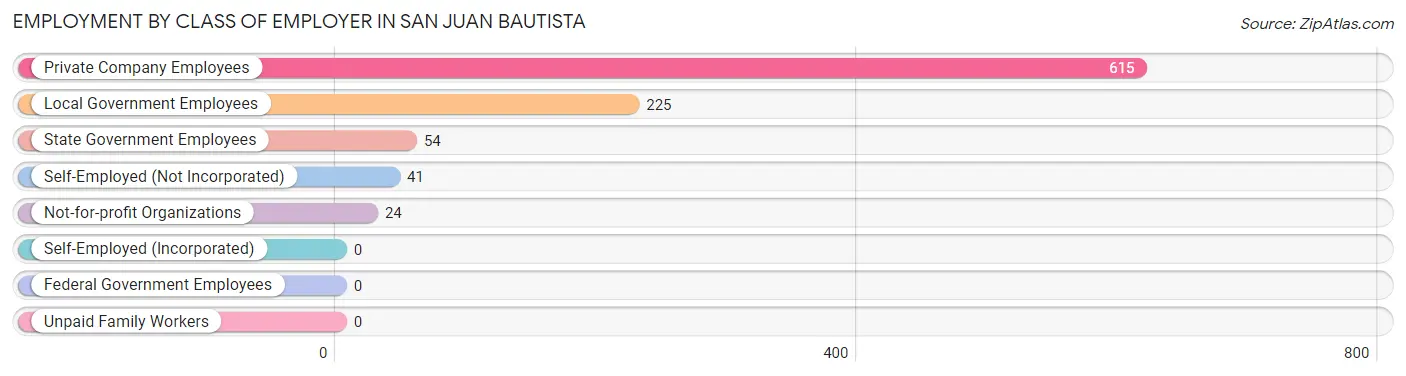
| Employer Class | # Employees | % Employees |
| Private Company Employees | 615 | 64.1% |
| Self-Employed (Incorporated) | 0 | 0.0% |
| Self-Employed (Not Incorporated) | 41 | 4.3% |
| Not-for-profit Organizations | 24 | 2.5% |
| Local Government Employees | 225 | 23.5% |
| State Government Employees | 54 | 5.6% |
| Federal Government Employees | 0 | 0.0% |
| Unpaid Family Workers | 0 | 0.0% |
| Total | 959 | 100.0% |
Employment Status by Age in San Juan Bautista
According to the labor force statistics for San Juan Bautista, out of the total population over 16 years of age (1,556), 66.1% or 1,029 individuals are in the labor force, with 2.3% or 24 of them unemployed. The age group with the highest labor force participation rate is 20 to 24 years, with 100.0% or 83 individuals in the labor force. Within the labor force, the 20 to 24 years age range has the highest percentage of unemployed individuals, with 16.9% or 14 of them being unemployed.
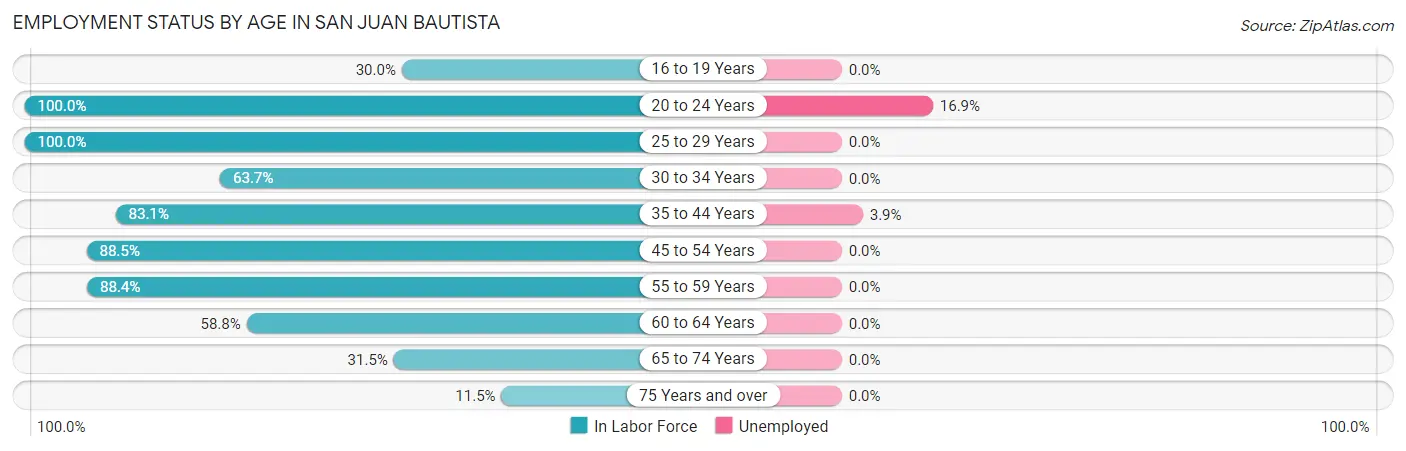
| Age Bracket | In Labor Force | Unemployed |
| 16 to 19 Years | 18 (30.0%) | 0 (0.0%) |
| 20 to 24 Years | 83 (100.0%) | 14 (16.9%) |
| 25 to 29 Years | 126 (100.0%) | 0 (0.0%) |
| 30 to 34 Years | 100 (63.7%) | 0 (0.0%) |
| 35 to 44 Years | 256 (83.1%) | 10 (3.9%) |
| 45 to 54 Years | 185 (88.5%) | 0 (0.0%) |
| 55 to 59 Years | 130 (88.4%) | 0 (0.0%) |
| 60 to 64 Years | 50 (58.8%) | 0 (0.0%) |
| 65 to 74 Years | 57 (31.5%) | 0 (0.0%) |
| 75 Years and over | 23 (11.5%) | 0 (0.0%) |
| Total | 1,029 (66.1%) | 24 (2.3%) |
Employment Status by Educational Attainment in San Juan Bautista
According to labor force statistics for San Juan Bautista, 82.1% of individuals (847) out of the total population between 25 and 64 years of age (1,032) are in the labor force, with 1.2% or 10 of them being unemployed. The group with the highest labor force participation rate are those with the educational attainment of high school diploma, with 85.8% or 133 individuals in the labor force. Within the labor force, individuals with high school diploma education have the highest percentage of unemployment, with 7.5% or 10 of them being unemployed.
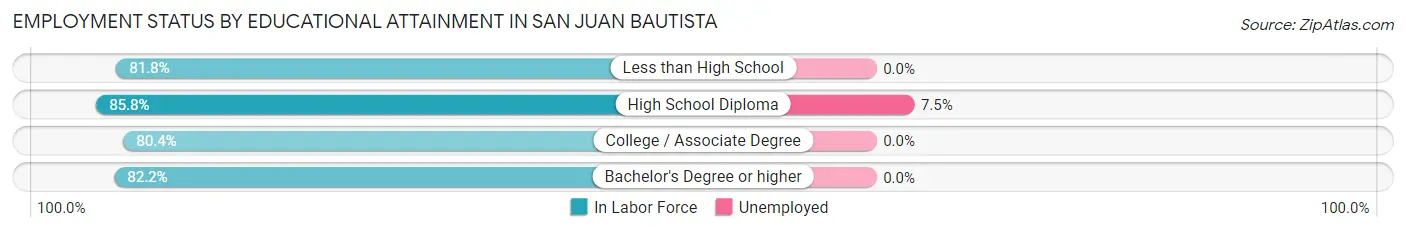
| Educational Attainment | In Labor Force | Unemployed |
| Less than High School | 108 (81.8%) | 0 (0.0%) |
| High School Diploma | 133 (85.8%) | 12 (7.5%) |
| College / Associate Degree | 292 (80.4%) | 0 (0.0%) |
| Bachelor's Degree or higher | 314 (82.2%) | 0 (0.0%) |
| Total | 847 (82.1%) | 12 (1.2%) |
Employment Occupations by Sex in San Juan Bautista
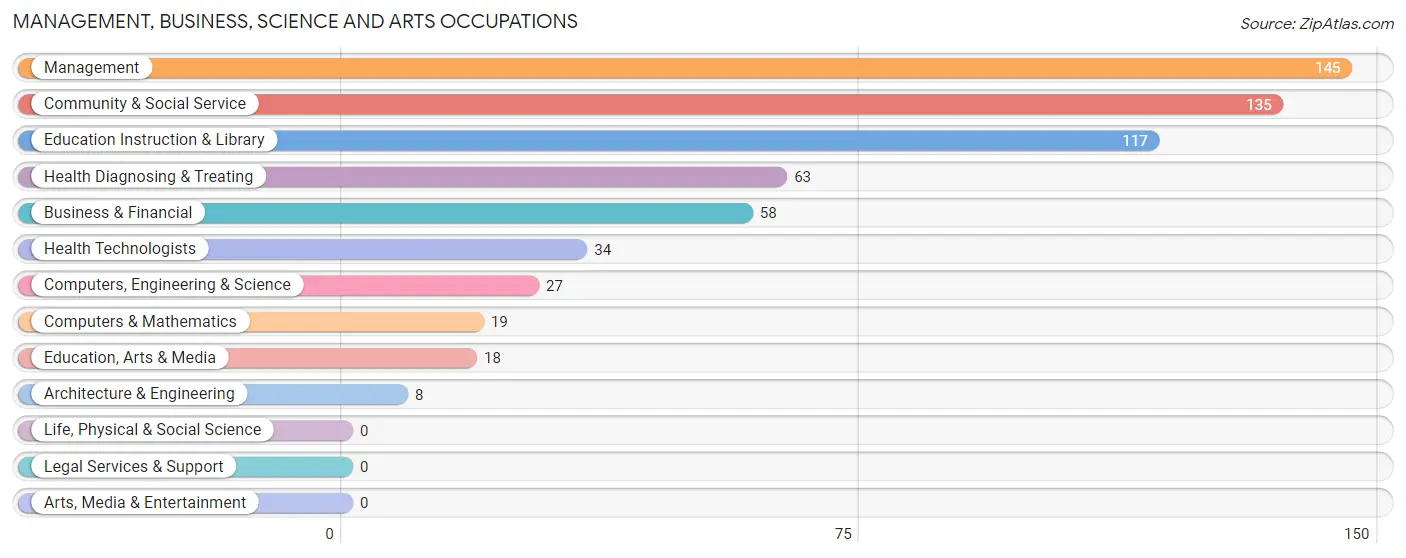
Management, Business, Science and Arts Occupations
The most common Management, Business, Science and Arts occupations in San Juan Bautista are Management (145 | 14.4%), Community & Social Service (135 | 13.5%), Education Instruction & Library (117 | 11.7%), Health Diagnosing & Treating (63 | 6.3%), and Business & Financial (58 | 5.8%).
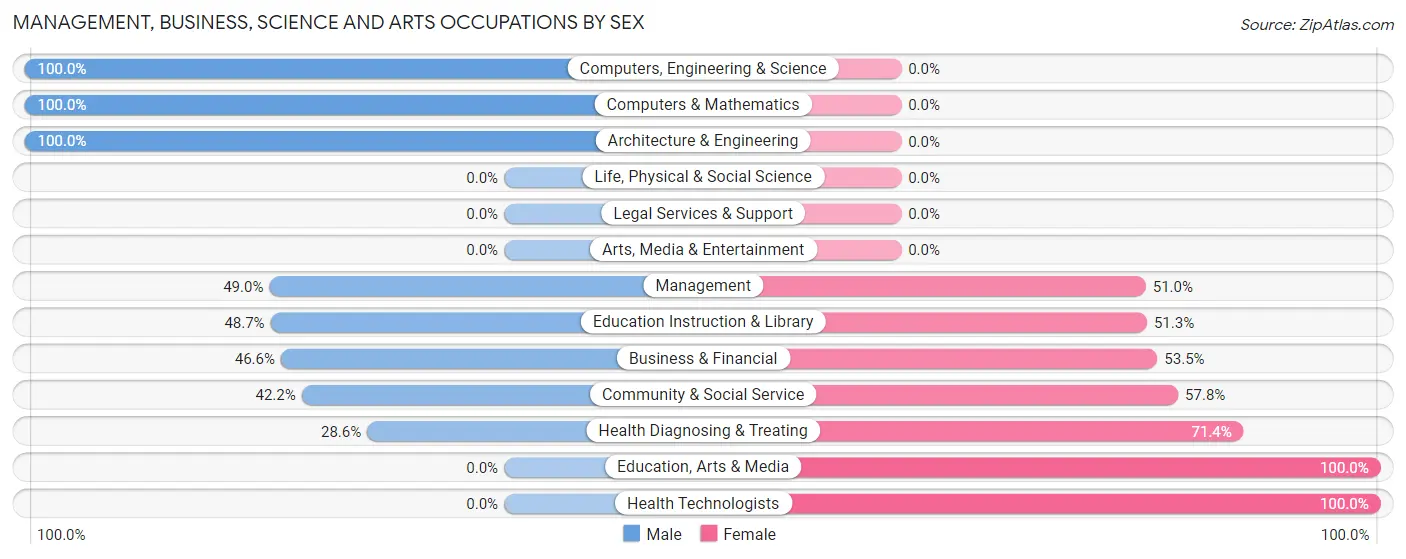
Management, Business, Science and Arts Occupations by Sex
Within the Management, Business, Science and Arts occupations in San Juan Bautista, the most male-oriented occupations are Computers, Engineering & Science (100.0%), Computers & Mathematics (100.0%), and Architecture & Engineering (100.0%), while the most female-oriented occupations are Education, Arts & Media (100.0%), Health Technologists (100.0%), and Health Diagnosing & Treating (71.4%).
| Occupation | Male | Female |
| Management | 71 (49.0%) | 74 (51.0%) |
| Business & Financial | 27 (46.6%) | 31 (53.4%) |
| Computers, Engineering & Science | 27 (100.0%) | 0 (0.0%) |
| Computers & Mathematics | 19 (100.0%) | 0 (0.0%) |
| Architecture & Engineering | 8 (100.0%) | 0 (0.0%) |
| Life, Physical & Social Science | 0 (0.0%) | 0 (0.0%) |
| Community & Social Service | 57 (42.2%) | 78 (57.8%) |
| Education, Arts & Media | 0 (0.0%) | 18 (100.0%) |
| Legal Services & Support | 0 (0.0%) | 0 (0.0%) |
| Education Instruction & Library | 57 (48.7%) | 60 (51.3%) |
| Arts, Media & Entertainment | 0 (0.0%) | 0 (0.0%) |
| Health Diagnosing & Treating | 18 (28.6%) | 45 (71.4%) |
| Health Technologists | 0 (0.0%) | 34 (100.0%) |
| Total (Category) | 200 (46.7%) | 228 (53.3%) |
| Total (Overall) | 548 (54.6%) | 456 (45.4%) |
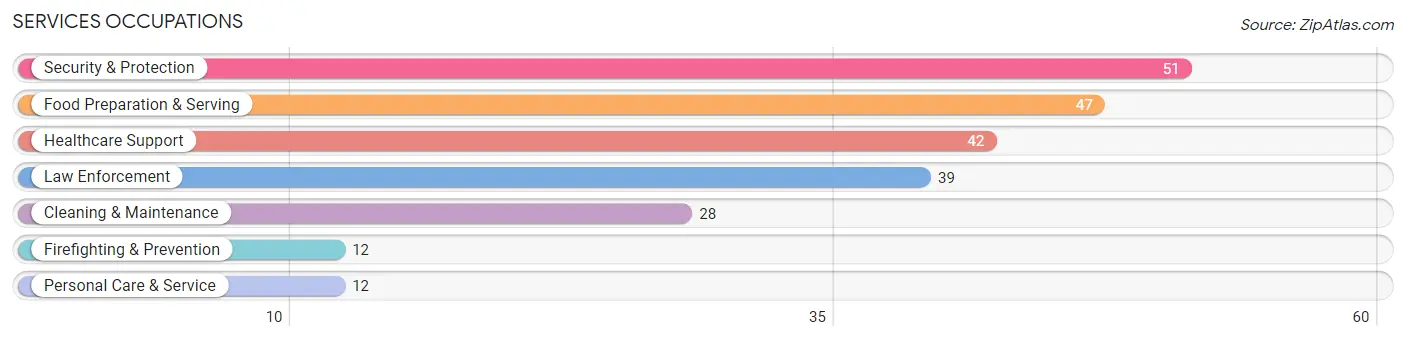
Services Occupations
The most common Services occupations in San Juan Bautista are Security & Protection (51 | 5.1%), Food Preparation & Serving (47 | 4.7%), Healthcare Support (42 | 4.2%), Law Enforcement (39 | 3.9%), and Cleaning & Maintenance (28 | 2.8%).
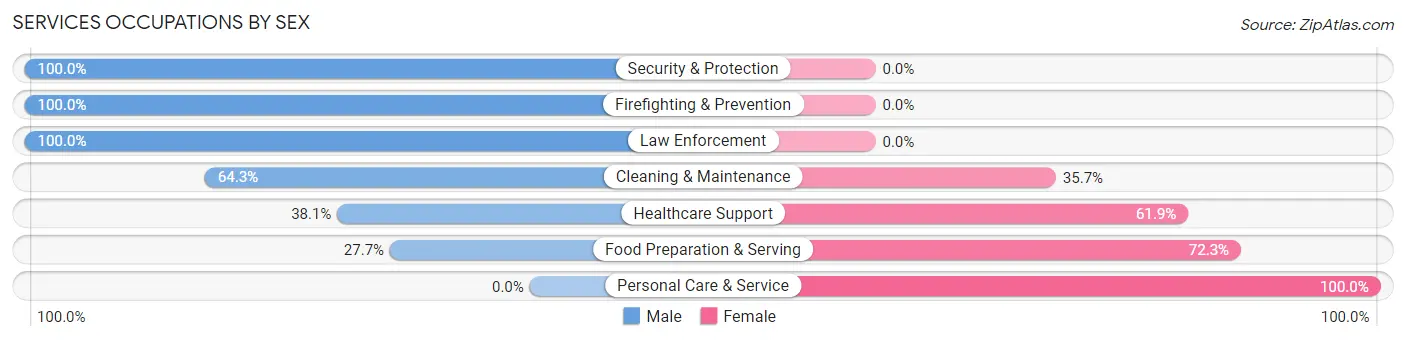
Services Occupations by Sex
Within the Services occupations in San Juan Bautista, the most male-oriented occupations are Security & Protection (100.0%), Firefighting & Prevention (100.0%), and Law Enforcement (100.0%), while the most female-oriented occupations are Personal Care & Service (100.0%), Food Preparation & Serving (72.3%), and Healthcare Support (61.9%).
| Occupation | Male | Female |
| Healthcare Support | 16 (38.1%) | 26 (61.9%) |
| Security & Protection | 51 (100.0%) | 0 (0.0%) |
| Firefighting & Prevention | 12 (100.0%) | 0 (0.0%) |
| Law Enforcement | 39 (100.0%) | 0 (0.0%) |
| Food Preparation & Serving | 13 (27.7%) | 34 (72.3%) |
| Cleaning & Maintenance | 18 (64.3%) | 10 (35.7%) |
| Personal Care & Service | 0 (0.0%) | 12 (100.0%) |
| Total (Category) | 98 (54.4%) | 82 (45.6%) |
| Total (Overall) | 548 (54.6%) | 456 (45.4%) |
Sales and Office Occupations
The most common Sales and Office occupations in San Juan Bautista are Office & Administration (76 | 7.6%), and Sales & Related (43 | 4.3%).
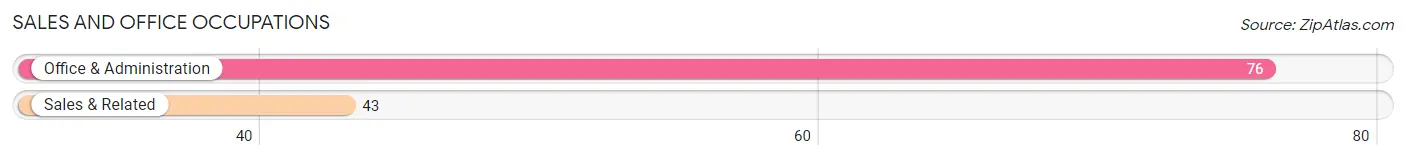
Sales and Office Occupations by Sex
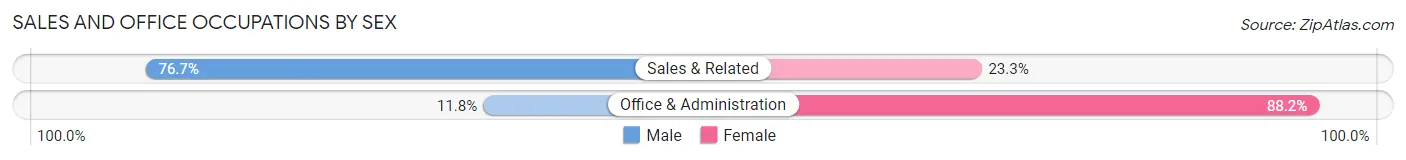
| Occupation | Male | Female |
| Sales & Related | 33 (76.7%) | 10 (23.3%) |
| Office & Administration | 9 (11.8%) | 67 (88.2%) |
| Total (Category) | 42 (35.3%) | 77 (64.7%) |
| Total (Overall) | 548 (54.6%) | 456 (45.4%) |
Natural Resources, Construction and Maintenance Occupations
The most common Natural Resources, Construction and Maintenance occupations in San Juan Bautista are Construction & Extraction (94 | 9.4%), Farming, Fishing & Forestry (19 | 1.9%), and Installation, Maintenance & Repair (15 | 1.5%).
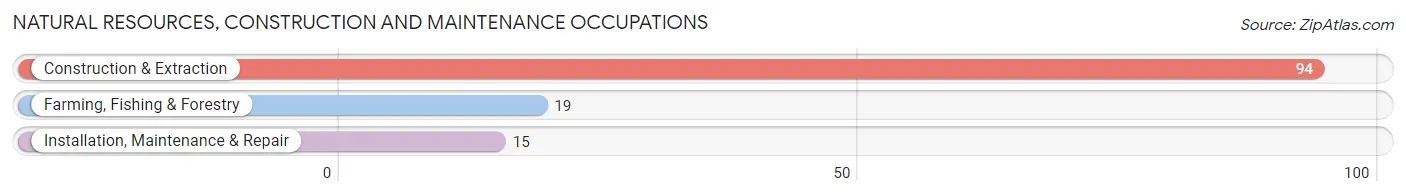
Natural Resources, Construction and Maintenance Occupations by Sex
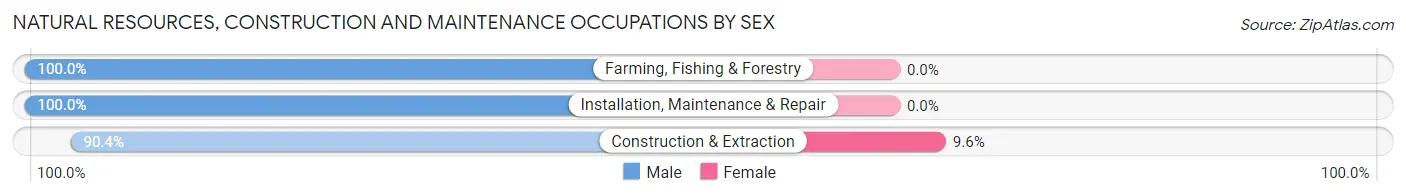
| Occupation | Male | Female |
| Farming, Fishing & Forestry | 19 (100.0%) | 0 (0.0%) |
| Construction & Extraction | 85 (90.4%) | 9 (9.6%) |
| Installation, Maintenance & Repair | 15 (100.0%) | 0 (0.0%) |
| Total (Category) | 119 (93.0%) | 9 (7.0%) |
| Total (Overall) | 548 (54.6%) | 456 (45.4%) |
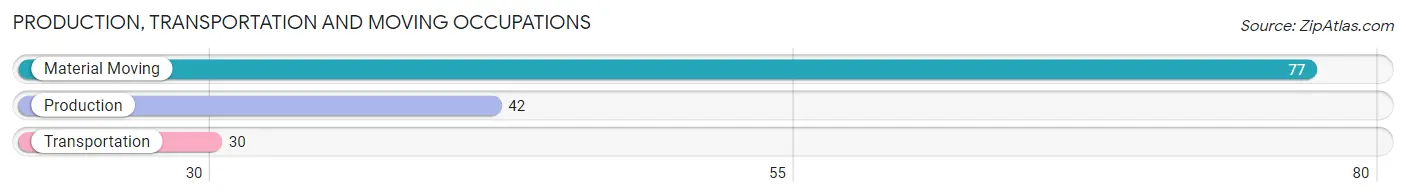
Production, Transportation and Moving Occupations
The most common Production, Transportation and Moving occupations in San Juan Bautista are Material Moving (77 | 7.7%), Production (42 | 4.2%), and Transportation (30 | 3.0%).
Production, Transportation and Moving Occupations by Sex
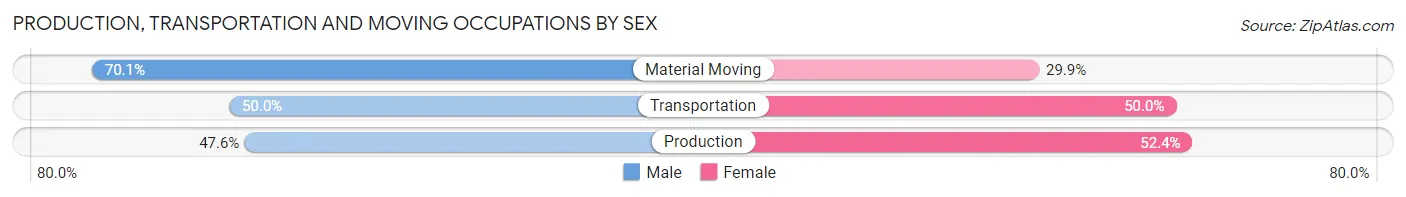
| Occupation | Male | Female |
| Production | 20 (47.6%) | 22 (52.4%) |
| Transportation | 15 (50.0%) | 15 (50.0%) |
| Material Moving | 54 (70.1%) | 23 (29.9%) |
| Total (Category) | 89 (59.7%) | 60 (40.3%) |
| Total (Overall) | 548 (54.6%) | 456 (45.4%) |
Employment Industries by Sex in San Juan Bautista
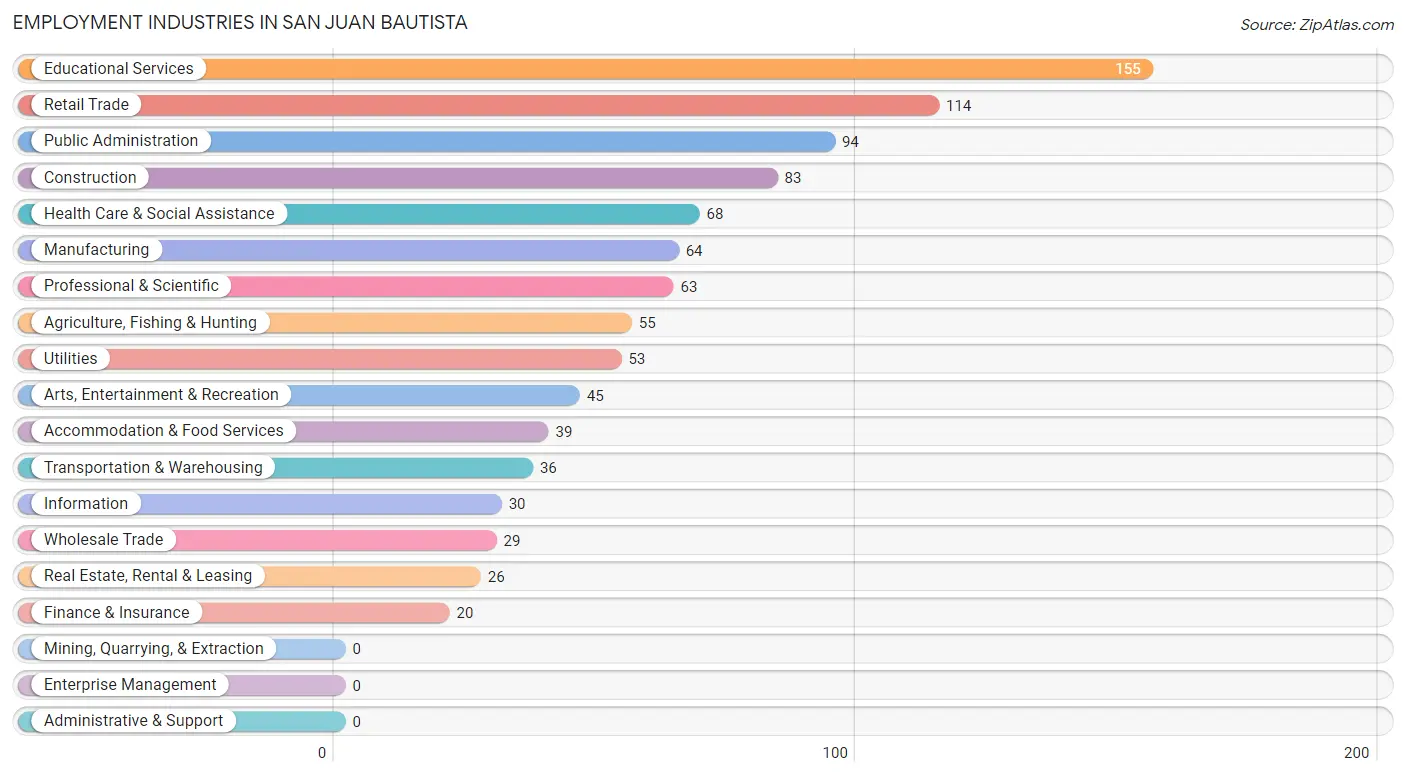
Employment Industries in San Juan Bautista
The major employment industries in San Juan Bautista include Educational Services (155 | 15.4%), Retail Trade (114 | 11.4%), Public Administration (94 | 9.4%), Construction (83 | 8.3%), and Health Care & Social Assistance (68 | 6.8%).
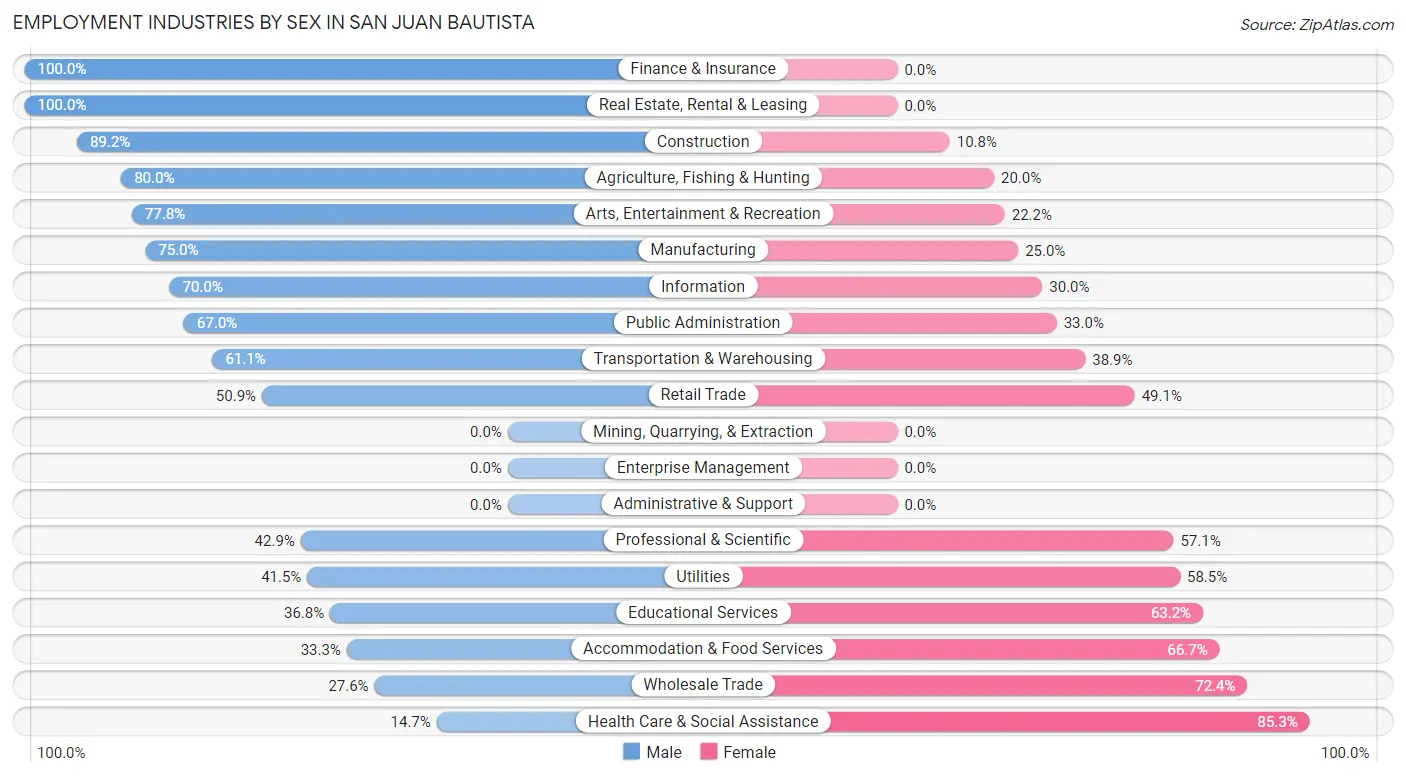
Employment Industries by Sex in San Juan Bautista
The San Juan Bautista industries that see more men than women are Finance & Insurance (100.0%), Real Estate, Rental & Leasing (100.0%), and Construction (89.2%), whereas the industries that tend to have a higher number of women are Health Care & Social Assistance (85.3%), Wholesale Trade (72.4%), and Accommodation & Food Services (66.7%).
| Industry | Male | Female |
| Agriculture, Fishing & Hunting | 44 (80.0%) | 11 (20.0%) |
| Mining, Quarrying, & Extraction | 0 (0.0%) | 0 (0.0%) |
| Construction | 74 (89.2%) | 9 (10.8%) |
| Manufacturing | 48 (75.0%) | 16 (25.0%) |
| Wholesale Trade | 8 (27.6%) | 21 (72.4%) |
| Retail Trade | 58 (50.9%) | 56 (49.1%) |
| Transportation & Warehousing | 22 (61.1%) | 14 (38.9%) |
| Utilities | 22 (41.5%) | 31 (58.5%) |
| Information | 21 (70.0%) | 9 (30.0%) |
| Finance & Insurance | 20 (100.0%) | 0 (0.0%) |
| Real Estate, Rental & Leasing | 26 (100.0%) | 0 (0.0%) |
| Professional & Scientific | 27 (42.9%) | 36 (57.1%) |
| Enterprise Management | 0 (0.0%) | 0 (0.0%) |
| Administrative & Support | 0 (0.0%) | 0 (0.0%) |
| Educational Services | 57 (36.8%) | 98 (63.2%) |
| Health Care & Social Assistance | 10 (14.7%) | 58 (85.3%) |
| Arts, Entertainment & Recreation | 35 (77.8%) | 10 (22.2%) |
| Accommodation & Food Services | 13 (33.3%) | 26 (66.7%) |
| Public Administration | 63 (67.0%) | 31 (33.0%) |
| Total | 548 (54.6%) | 456 (45.4%) |
Education in San Juan Bautista
School Enrollment in San Juan Bautista
The most common levels of schooling among the 431 students in San Juan Bautista are college / undergraduate (128 | 29.7%), elementary school (121 | 28.1%), and high school (111 | 25.8%).
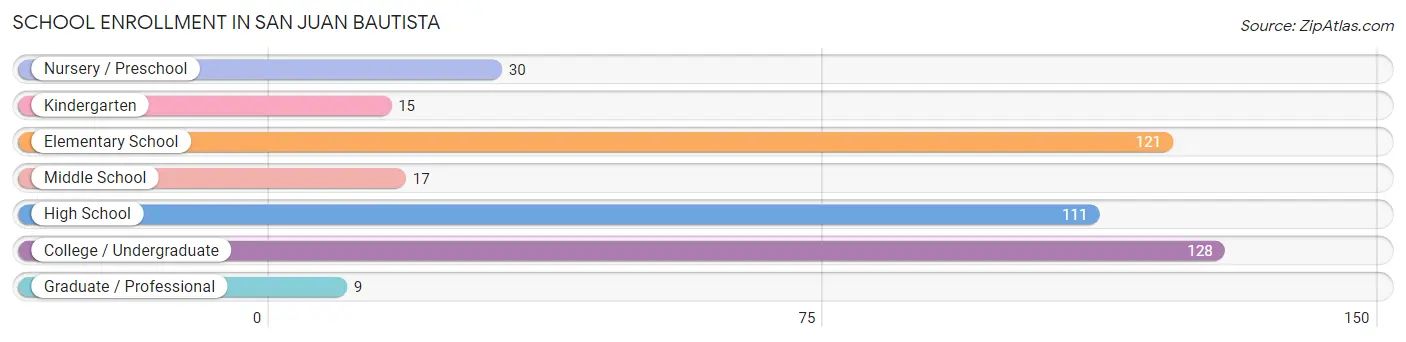
| School Level | # Students | % Students |
| Nursery / Preschool | 30 | 7.0% |
| Kindergarten | 15 | 3.5% |
| Elementary School | 121 | 28.1% |
| Middle School | 17 | 3.9% |
| High School | 111 | 25.8% |
| College / Undergraduate | 128 | 29.7% |
| Graduate / Professional | 9 | 2.1% |
| Total | 431 | 100.0% |
School Enrollment by Age by Funding Source in San Juan Bautista
Out of a total of 431 students who are enrolled in schools in San Juan Bautista, 59 (13.7%) attend a private institution, while the remaining 372 (86.3%) are enrolled in public schools. The age group of 15 to 17 year olds has the highest likelihood of being enrolled in private schools, with 21 (24.4% in the age bracket) enrolled. Conversely, the age group of 3 to 4 year olds has the lowest likelihood of being enrolled in a private school, with 12 (100.0% in the age bracket) attending a public institution.
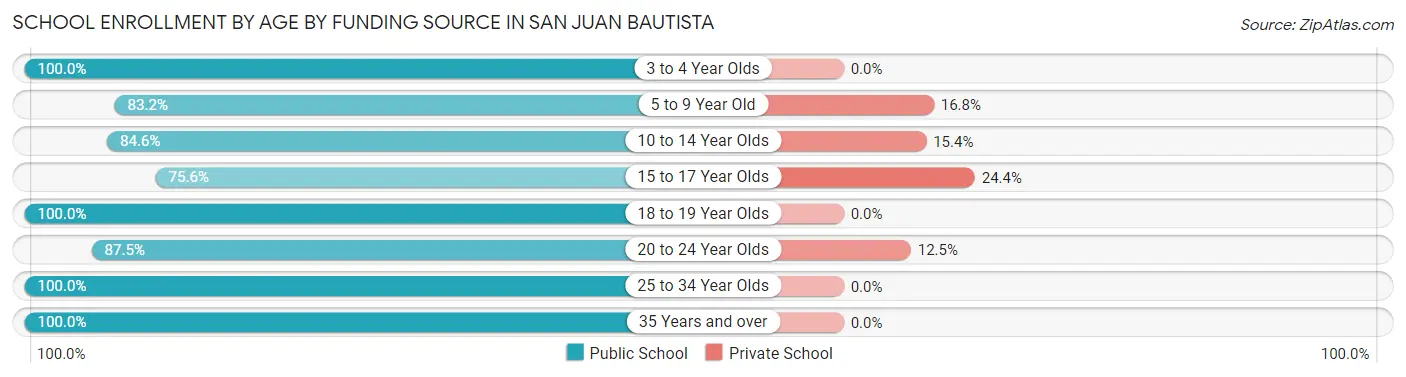
| Age Bracket | Public School | Private School |
| 3 to 4 Year Olds | 12 (100.0%) | 0 (0.0%) |
| 5 to 9 Year Old | 119 (83.2%) | 24 (16.8%) |
| 10 to 14 Year Olds | 33 (84.6%) | 6 (15.4%) |
| 15 to 17 Year Olds | 65 (75.6%) | 21 (24.4%) |
| 18 to 19 Year Olds | 23 (100.0%) | 0 (0.0%) |
| 20 to 24 Year Olds | 56 (87.5%) | 8 (12.5%) |
| 25 to 34 Year Olds | 43 (100.0%) | 0 (0.0%) |
| 35 Years and over | 21 (100.0%) | 0 (0.0%) |
| Total | 372 (86.3%) | 59 (13.7%) |
Educational Attainment by Field of Study in San Juan Bautista
Business (104 | 17.1%), education (98 | 16.1%), psychology (72 | 11.8%), liberal arts & history (65 | 10.7%), and literature & languages (61 | 10.0%) are the most common fields of study among 609 individuals in San Juan Bautista who have obtained a bachelor's degree or higher.
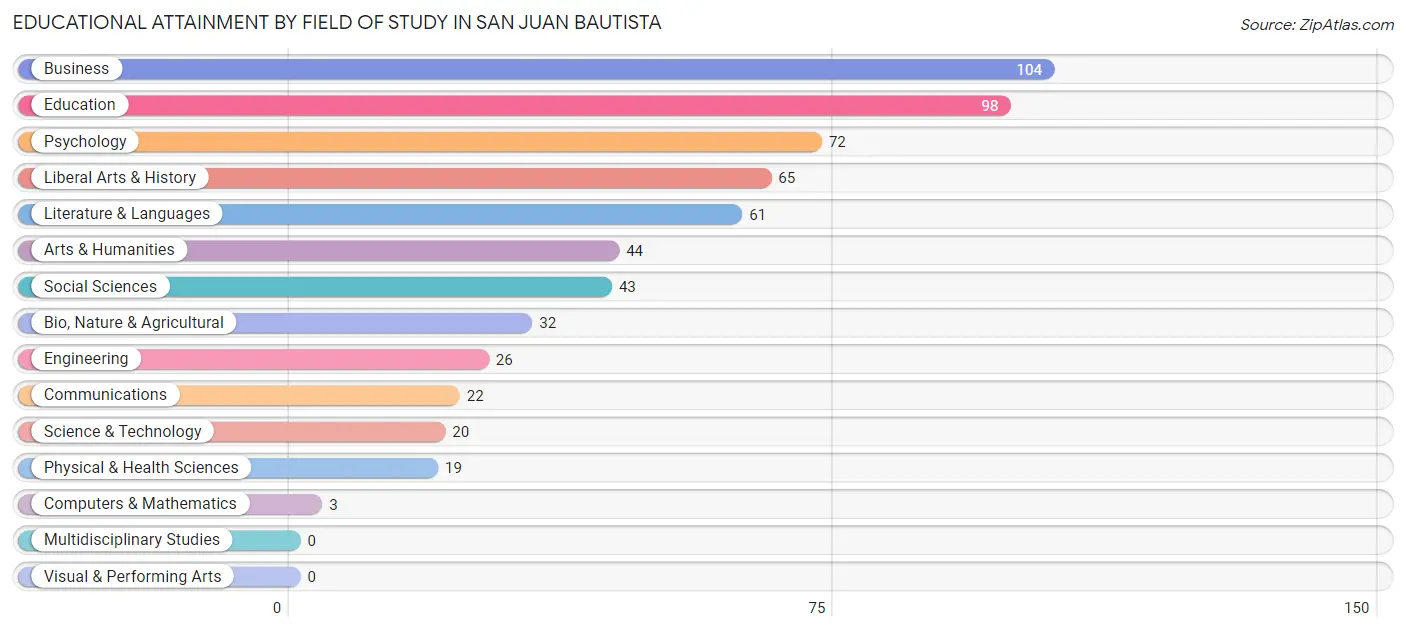
| Field of Study | # Graduates | % Graduates |
| Computers & Mathematics | 3 | 0.5% |
| Bio, Nature & Agricultural | 32 | 5.2% |
| Physical & Health Sciences | 19 | 3.1% |
| Psychology | 72 | 11.8% |
| Social Sciences | 43 | 7.1% |
| Engineering | 26 | 4.3% |
| Multidisciplinary Studies | 0 | 0.0% |
| Science & Technology | 20 | 3.3% |
| Business | 104 | 17.1% |
| Education | 98 | 16.1% |
| Literature & Languages | 61 | 10.0% |
| Liberal Arts & History | 65 | 10.7% |
| Visual & Performing Arts | 0 | 0.0% |
| Communications | 22 | 3.6% |
| Arts & Humanities | 44 | 7.2% |
| Total | 609 | 100.0% |
Transportation & Commute in San Juan Bautista
Vehicle Availability by Sex in San Juan Bautista
The most prevalent vehicle ownership categories in San Juan Bautista are males with 2 vehicles (221, accounting for 43.0%) and females with 2 vehicles (179, making up 52.4%).
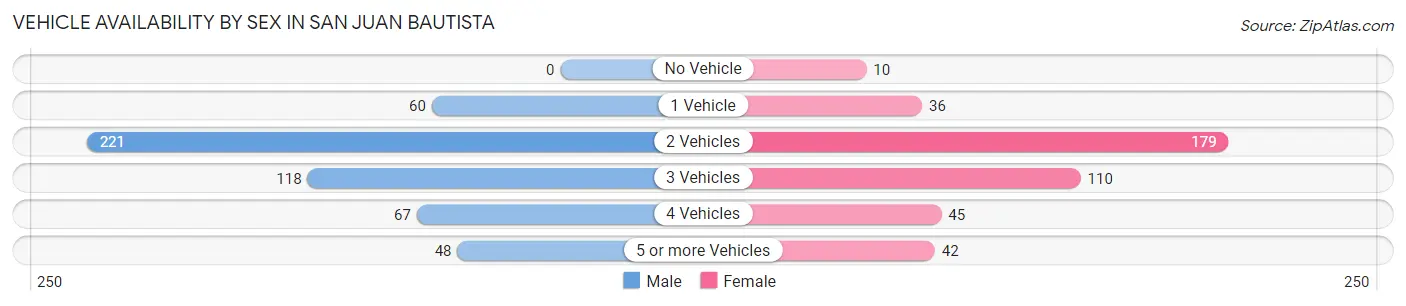
| Vehicles Available | Male | Female |
| No Vehicle | 0 (0.0%) | 10 (2.4%) |
| 1 Vehicle | 60 (11.7%) | 36 (8.5%) |
| 2 Vehicles | 221 (43.0%) | 179 (42.4%) |
| 3 Vehicles | 118 (23.0%) | 110 (26.1%) |
| 4 Vehicles | 67 (13.0%) | 45 (10.7%) |
| 5 or more Vehicles | 48 (9.3%) | 42 (10.0%) |
| Total | 514 (100.0%) | 422 (100.0%) |
Commute Time in San Juan Bautista
The most frequently occuring commute durations in San Juan Bautista are 90 or more minutes (153 commuters, 18.2%), 20 to 24 minutes (117 commuters, 13.9%), and 60 to 89 minutes (104 commuters, 12.3%).
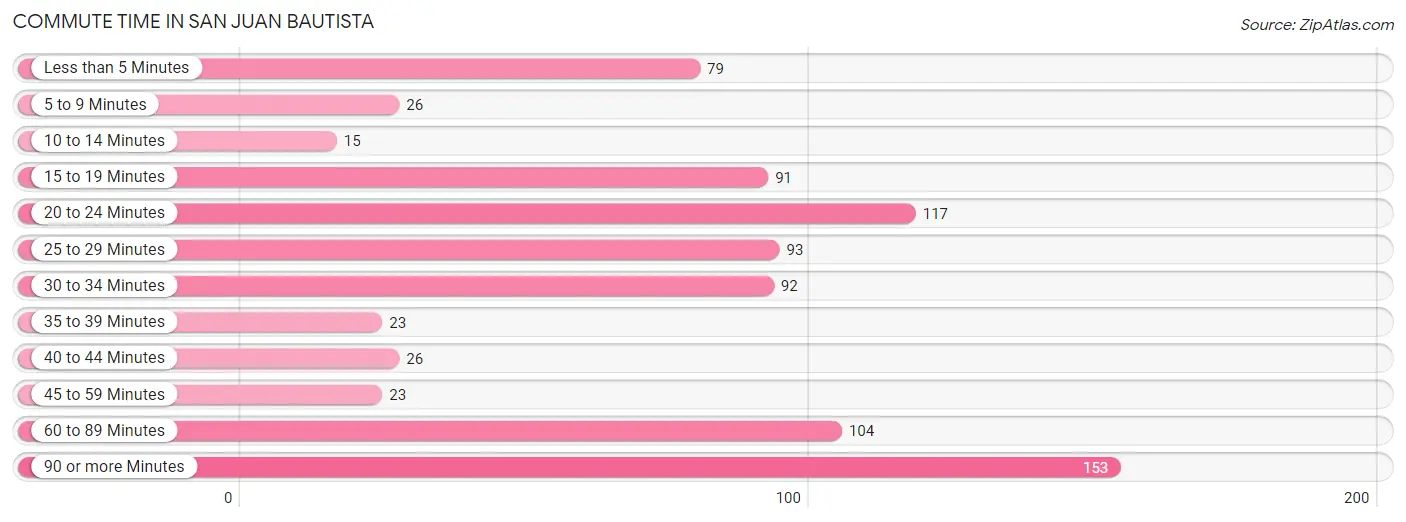
| Commute Time | # Commuters | % Commuters |
| Less than 5 Minutes | 79 | 9.4% |
| 5 to 9 Minutes | 26 | 3.1% |
| 10 to 14 Minutes | 15 | 1.8% |
| 15 to 19 Minutes | 91 | 10.8% |
| 20 to 24 Minutes | 117 | 13.9% |
| 25 to 29 Minutes | 93 | 11.1% |
| 30 to 34 Minutes | 92 | 10.9% |
| 35 to 39 Minutes | 23 | 2.7% |
| 40 to 44 Minutes | 26 | 3.1% |
| 45 to 59 Minutes | 23 | 2.7% |
| 60 to 89 Minutes | 104 | 12.3% |
| 90 or more Minutes | 153 | 18.2% |
Commute Time by Sex in San Juan Bautista
The most common commute times in San Juan Bautista are 90 or more minutes (118 commuters, 24.5%) for males and less than 5 minutes (67 commuters, 18.6%) for females.
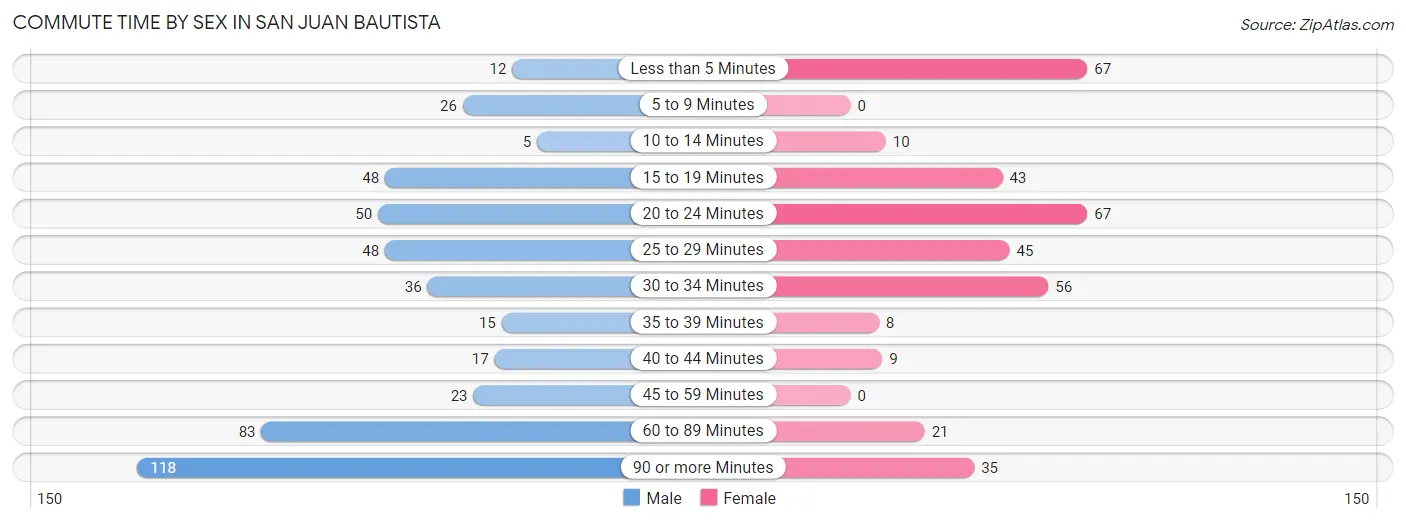
| Commute Time | Male | Female |
| Less than 5 Minutes | 12 (2.5%) | 67 (18.6%) |
| 5 to 9 Minutes | 26 (5.4%) | 0 (0.0%) |
| 10 to 14 Minutes | 5 (1.0%) | 10 (2.8%) |
| 15 to 19 Minutes | 48 (10.0%) | 43 (11.9%) |
| 20 to 24 Minutes | 50 (10.4%) | 67 (18.6%) |
| 25 to 29 Minutes | 48 (10.0%) | 45 (12.5%) |
| 30 to 34 Minutes | 36 (7.5%) | 56 (15.5%) |
| 35 to 39 Minutes | 15 (3.1%) | 8 (2.2%) |
| 40 to 44 Minutes | 17 (3.5%) | 9 (2.5%) |
| 45 to 59 Minutes | 23 (4.8%) | 0 (0.0%) |
| 60 to 89 Minutes | 83 (17.3%) | 21 (5.8%) |
| 90 or more Minutes | 118 (24.5%) | 35 (9.7%) |
Time of Departure to Work by Sex in San Juan Bautista
The most frequent times of departure to work in San Juan Bautista are 7:00 AM to 7:29 AM (75, 15.6%) for males and 7:30 AM to 7:59 AM (99, 27.4%) for females.
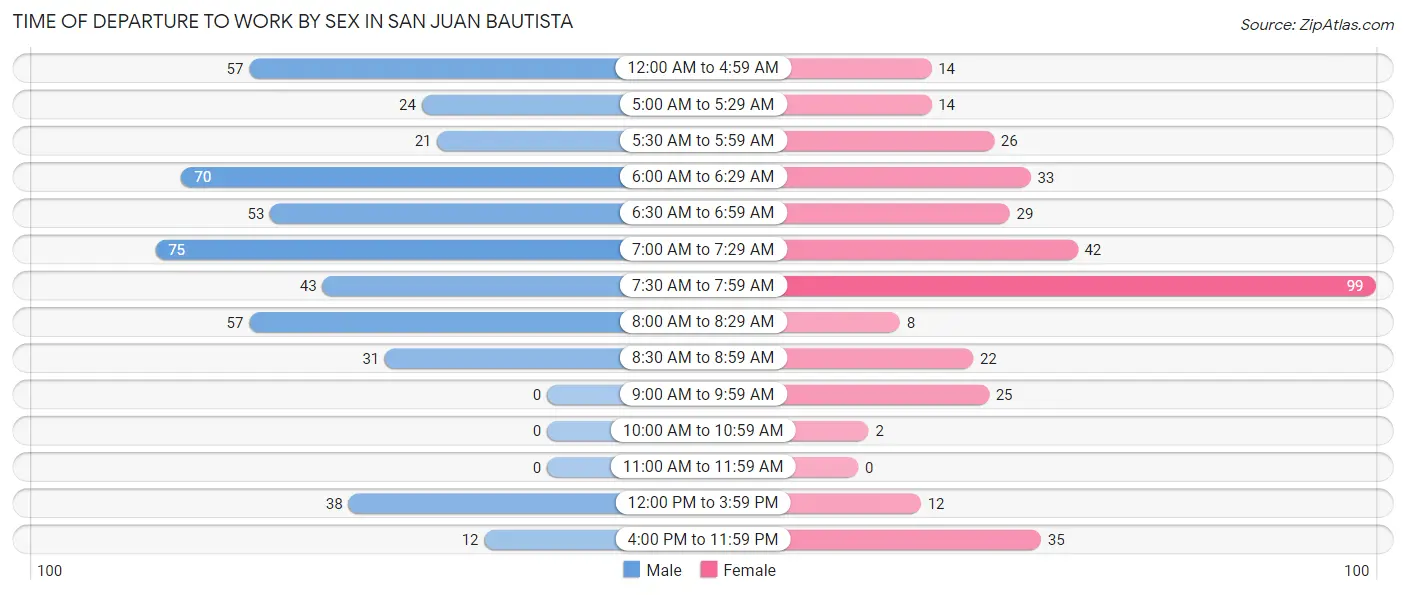
| Time of Departure | Male | Female |
| 12:00 AM to 4:59 AM | 57 (11.8%) | 14 (3.9%) |
| 5:00 AM to 5:29 AM | 24 (5.0%) | 14 (3.9%) |
| 5:30 AM to 5:59 AM | 21 (4.4%) | 26 (7.2%) |
| 6:00 AM to 6:29 AM | 70 (14.5%) | 33 (9.1%) |
| 6:30 AM to 6:59 AM | 53 (11.0%) | 29 (8.0%) |
| 7:00 AM to 7:29 AM | 75 (15.6%) | 42 (11.6%) |
| 7:30 AM to 7:59 AM | 43 (8.9%) | 99 (27.4%) |
| 8:00 AM to 8:29 AM | 57 (11.8%) | 8 (2.2%) |
| 8:30 AM to 8:59 AM | 31 (6.4%) | 22 (6.1%) |
| 9:00 AM to 9:59 AM | 0 (0.0%) | 25 (6.9%) |
| 10:00 AM to 10:59 AM | 0 (0.0%) | 2 (0.5%) |
| 11:00 AM to 11:59 AM | 0 (0.0%) | 0 (0.0%) |
| 12:00 PM to 3:59 PM | 38 (7.9%) | 12 (3.3%) |
| 4:00 PM to 11:59 PM | 12 (2.5%) | 35 (9.7%) |
| Total | 481 (100.0%) | 361 (100.0%) |
Housing Occupancy in San Juan Bautista
Occupancy by Ownership in San Juan Bautista
Of the total 770 dwellings in San Juan Bautista, owner-occupied units account for 475 (61.7%), while renter-occupied units make up 295 (38.3%).
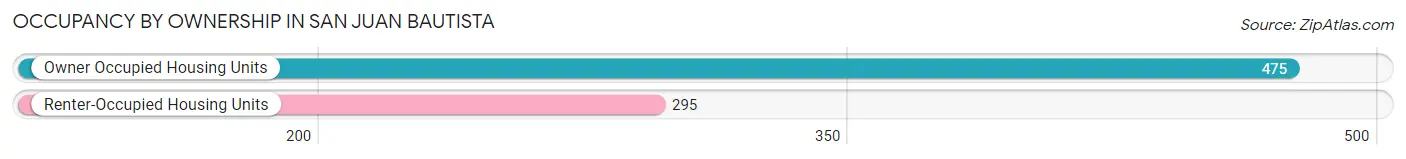
| Occupancy | # Housing Units | % Housing Units |
| Owner Occupied Housing Units | 475 | 61.7% |
| Renter-Occupied Housing Units | 295 | 38.3% |
| Total Occupied Housing Units | 770 | 100.0% |
Occupancy by Household Size in San Juan Bautista
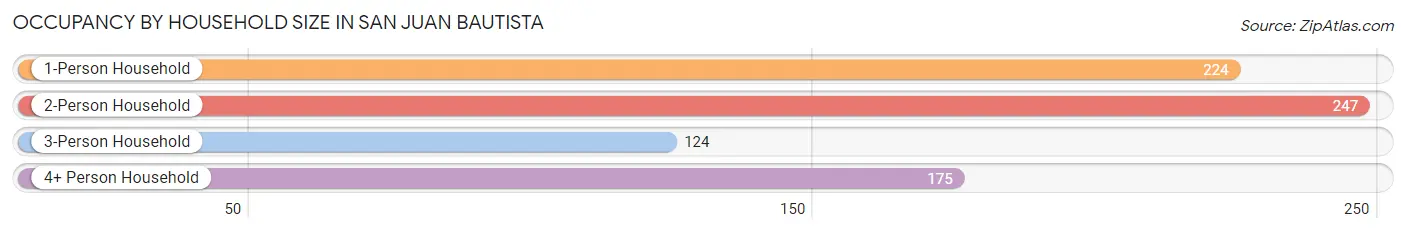
| Household Size | # Housing Units | % Housing Units |
| 1-Person Household | 224 | 29.1% |
| 2-Person Household | 247 | 32.1% |
| 3-Person Household | 124 | 16.1% |
| 4+ Person Household | 175 | 22.7% |
| Total Housing Units | 770 | 100.0% |
Occupancy by Ownership by Household Size in San Juan Bautista
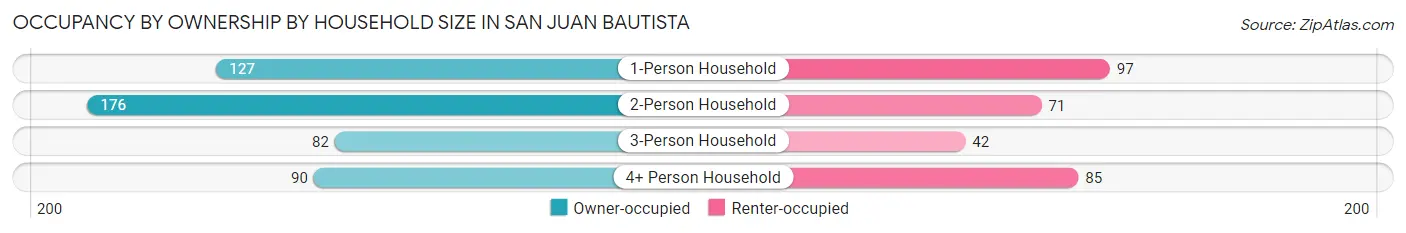
| Household Size | Owner-occupied | Renter-occupied |
| 1-Person Household | 127 (56.7%) | 97 (43.3%) |
| 2-Person Household | 176 (71.3%) | 71 (28.7%) |
| 3-Person Household | 82 (66.1%) | 42 (33.9%) |
| 4+ Person Household | 90 (51.4%) | 85 (48.6%) |
| Total Housing Units | 475 (61.7%) | 295 (38.3%) |
Occupancy by Educational Attainment in San Juan Bautista
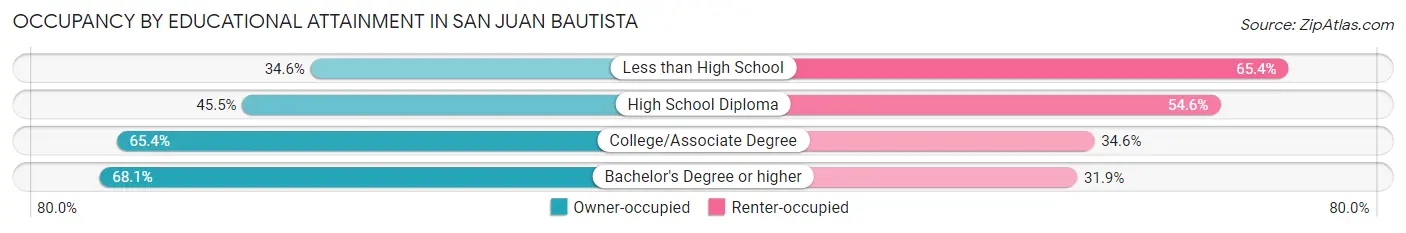
| Household Size | Owner-occupied | Renter-occupied |
| Less than High School | 18 (34.6%) | 34 (65.4%) |
| High School Diploma | 50 (45.5%) | 60 (54.5%) |
| College/Associate Degree | 174 (65.4%) | 92 (34.6%) |
| Bachelor's Degree or higher | 233 (68.1%) | 109 (31.9%) |
Occupancy by Age of Householder in San Juan Bautista
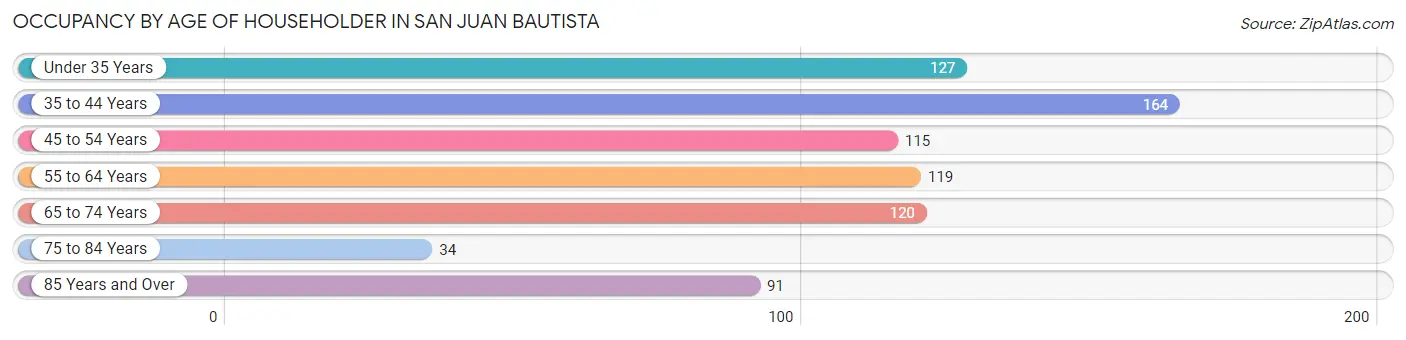
| Age Bracket | # Households | % Households |
| Under 35 Years | 127 | 16.5% |
| 35 to 44 Years | 164 | 21.3% |
| 45 to 54 Years | 115 | 14.9% |
| 55 to 64 Years | 119 | 15.4% |
| 65 to 74 Years | 120 | 15.6% |
| 75 to 84 Years | 34 | 4.4% |
| 85 Years and Over | 91 | 11.8% |
| Total | 770 | 100.0% |
Housing Finances in San Juan Bautista
Median Income by Occupancy in San Juan Bautista
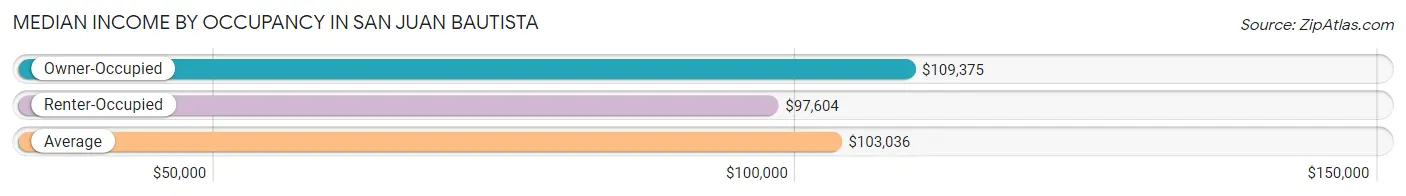
| Occupancy Type | # Households | Median Income |
| Owner-Occupied | 475 (61.7%) | $109,375 |
| Renter-Occupied | 295 (38.3%) | $97,604 |
| Average | 770 (100.0%) | $103,036 |
Occupancy by Householder Income Bracket in San Juan Bautista
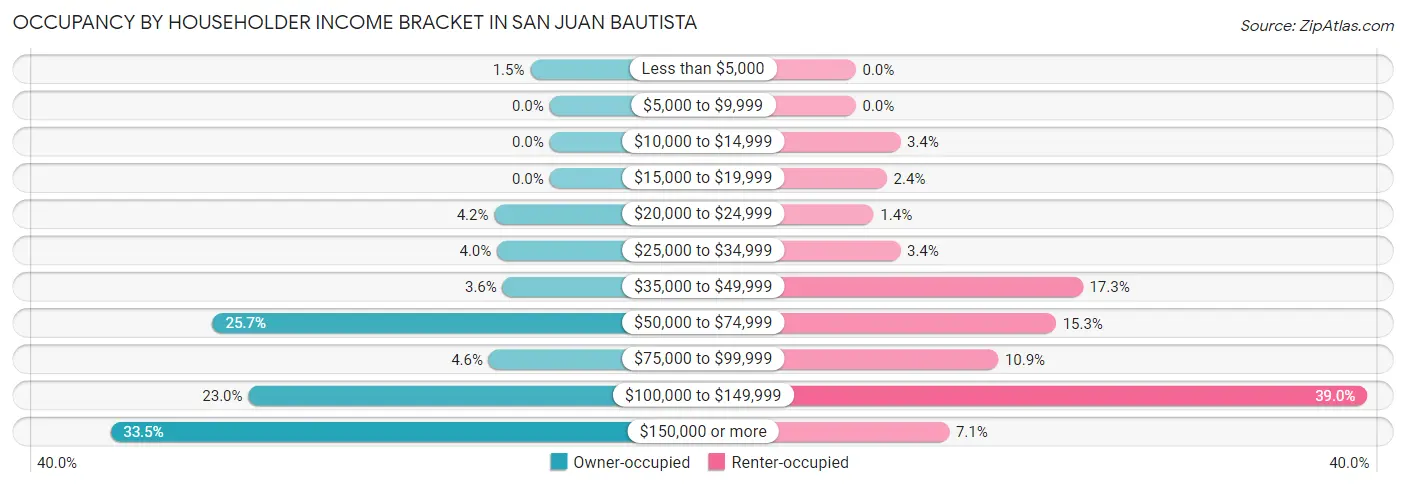
| Income Bracket | Owner-occupied | Renter-occupied |
| Less than $5,000 | 7 (1.5%) | 0 (0.0%) |
| $5,000 to $9,999 | 0 (0.0%) | 0 (0.0%) |
| $10,000 to $14,999 | 0 (0.0%) | 10 (3.4%) |
| $15,000 to $19,999 | 0 (0.0%) | 7 (2.4%) |
| $20,000 to $24,999 | 20 (4.2%) | 4 (1.4%) |
| $25,000 to $34,999 | 19 (4.0%) | 10 (3.4%) |
| $35,000 to $49,999 | 17 (3.6%) | 51 (17.3%) |
| $50,000 to $74,999 | 122 (25.7%) | 45 (15.2%) |
| $75,000 to $99,999 | 22 (4.6%) | 32 (10.8%) |
| $100,000 to $149,999 | 109 (23.0%) | 115 (39.0%) |
| $150,000 or more | 159 (33.5%) | 21 (7.1%) |
| Total | 475 (100.0%) | 295 (100.0%) |
Monthly Housing Cost Tiers in San Juan Bautista
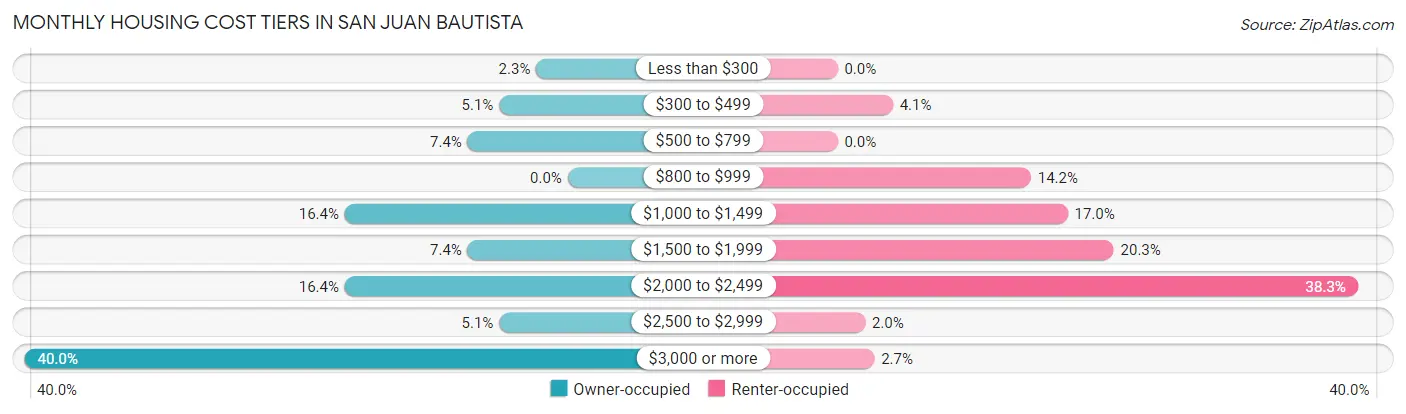
| Monthly Cost | Owner-occupied | Renter-occupied |
| Less than $300 | 11 (2.3%) | 0 (0.0%) |
| $300 to $499 | 24 (5.1%) | 12 (4.1%) |
| $500 to $799 | 35 (7.4%) | 0 (0.0%) |
| $800 to $999 | 0 (0.0%) | 42 (14.2%) |
| $1,000 to $1,499 | 78 (16.4%) | 50 (17.0%) |
| $1,500 to $1,999 | 35 (7.4%) | 60 (20.3%) |
| $2,000 to $2,499 | 78 (16.4%) | 113 (38.3%) |
| $2,500 to $2,999 | 24 (5.1%) | 6 (2.0%) |
| $3,000 or more | 190 (40.0%) | 8 (2.7%) |
| Total | 475 (100.0%) | 295 (100.0%) |
Physical Housing Characteristics in San Juan Bautista
Housing Structures in San Juan Bautista
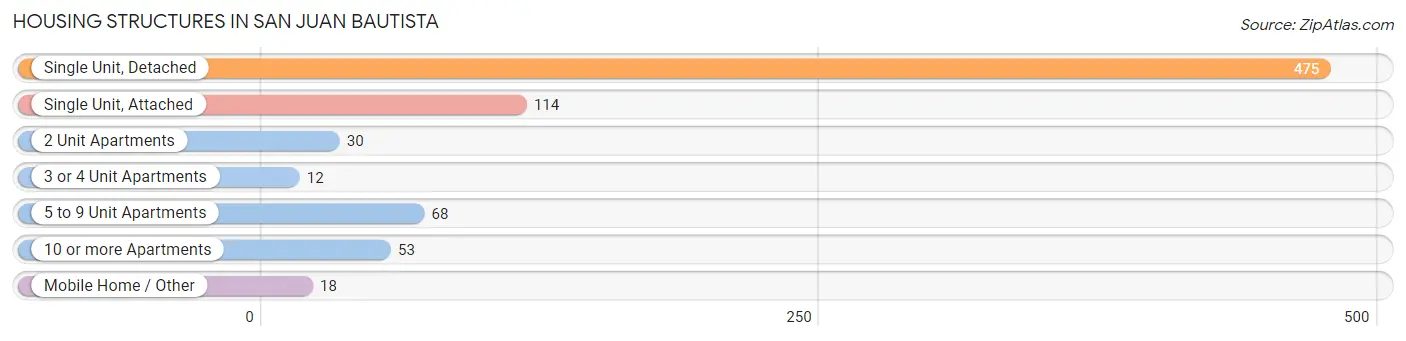
| Structure Type | # Housing Units | % Housing Units |
| Single Unit, Detached | 475 | 61.7% |
| Single Unit, Attached | 114 | 14.8% |
| 2 Unit Apartments | 30 | 3.9% |
| 3 or 4 Unit Apartments | 12 | 1.6% |
| 5 to 9 Unit Apartments | 68 | 8.8% |
| 10 or more Apartments | 53 | 6.9% |
| Mobile Home / Other | 18 | 2.3% |
| Total | 770 | 100.0% |
Housing Structures by Occupancy in San Juan Bautista
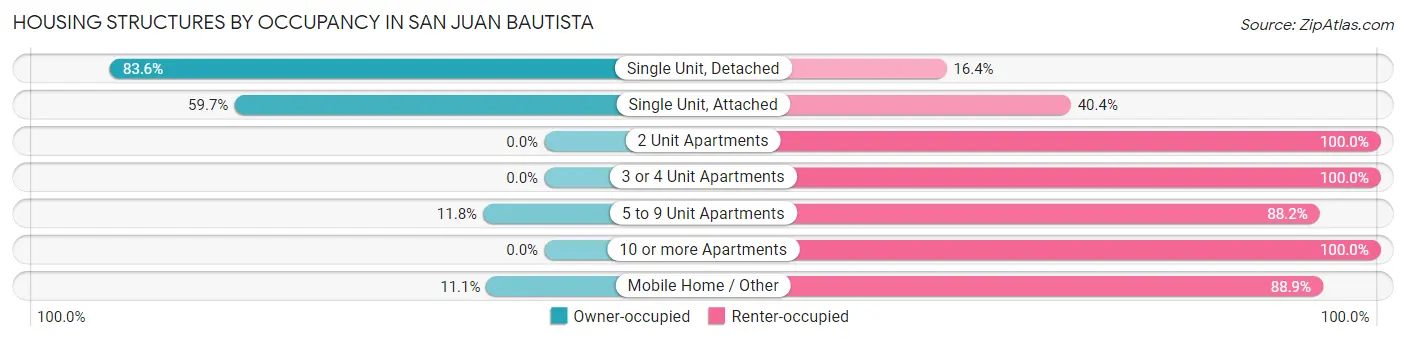
| Structure Type | Owner-occupied | Renter-occupied |
| Single Unit, Detached | 397 (83.6%) | 78 (16.4%) |
| Single Unit, Attached | 68 (59.7%) | 46 (40.4%) |
| 2 Unit Apartments | 0 (0.0%) | 30 (100.0%) |
| 3 or 4 Unit Apartments | 0 (0.0%) | 12 (100.0%) |
| 5 to 9 Unit Apartments | 8 (11.8%) | 60 (88.2%) |
| 10 or more Apartments | 0 (0.0%) | 53 (100.0%) |
| Mobile Home / Other | 2 (11.1%) | 16 (88.9%) |
| Total | 475 (61.7%) | 295 (38.3%) |
Housing Structures by Number of Rooms in San Juan Bautista
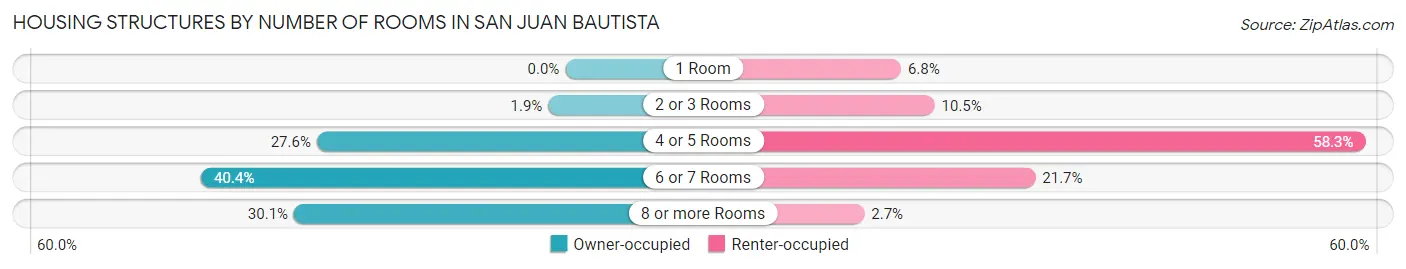
| Number of Rooms | Owner-occupied | Renter-occupied |
| 1 Room | 0 (0.0%) | 20 (6.8%) |
| 2 or 3 Rooms | 9 (1.9%) | 31 (10.5%) |
| 4 or 5 Rooms | 131 (27.6%) | 172 (58.3%) |
| 6 or 7 Rooms | 192 (40.4%) | 64 (21.7%) |
| 8 or more Rooms | 143 (30.1%) | 8 (2.7%) |
| Total | 475 (100.0%) | 295 (100.0%) |
Housing Structure by Heating Type in San Juan Bautista
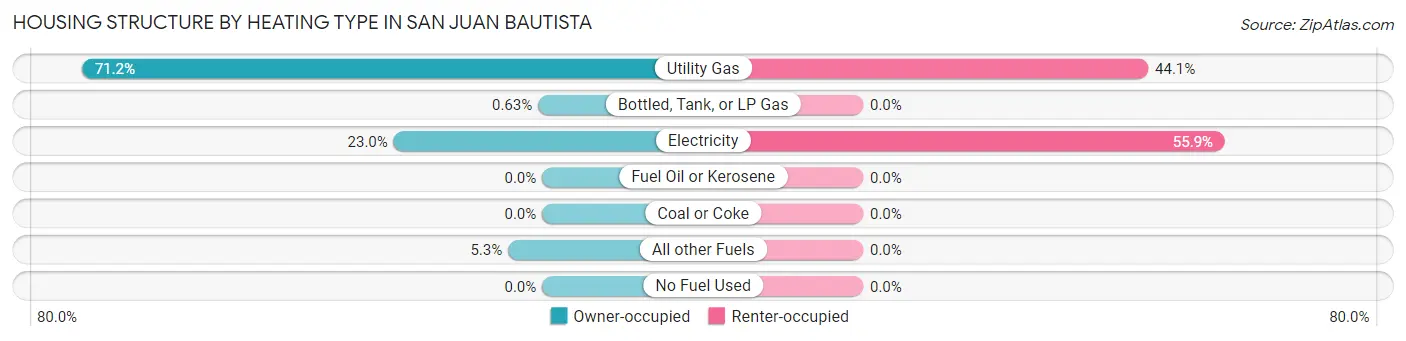
| Heating Type | Owner-occupied | Renter-occupied |
| Utility Gas | 338 (71.2%) | 130 (44.1%) |
| Bottled, Tank, or LP Gas | 3 (0.6%) | 0 (0.0%) |
| Electricity | 109 (23.0%) | 165 (55.9%) |
| Fuel Oil or Kerosene | 0 (0.0%) | 0 (0.0%) |
| Coal or Coke | 0 (0.0%) | 0 (0.0%) |
| All other Fuels | 25 (5.3%) | 0 (0.0%) |
| No Fuel Used | 0 (0.0%) | 0 (0.0%) |
| Total | 475 (100.0%) | 295 (100.0%) |
Household Vehicle Usage in San Juan Bautista
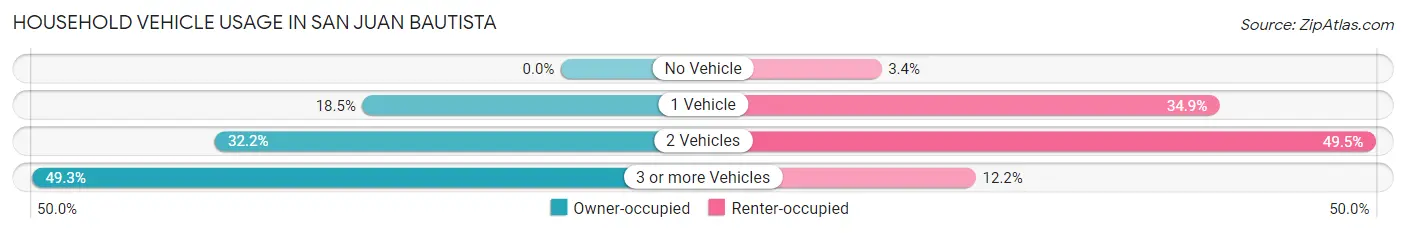
| Vehicles per Household | Owner-occupied | Renter-occupied |
| No Vehicle | 0 (0.0%) | 10 (3.4%) |
| 1 Vehicle | 88 (18.5%) | 103 (34.9%) |
| 2 Vehicles | 153 (32.2%) | 146 (49.5%) |
| 3 or more Vehicles | 234 (49.3%) | 36 (12.2%) |
| Total | 475 (100.0%) | 295 (100.0%) |
Real Estate & Mortgages in San Juan Bautista
Real Estate and Mortgage Overview in San Juan Bautista
| Characteristic | Without Mortgage | With Mortgage |
| Housing Units | 130 | 345 |
| Median Property Value | $587,300 | $685,400 |
| Median Household Income | - | - |
| Monthly Housing Costs | $791 | $190 |
| Real Estate Taxes | $3,407 | $2 |
Property Value by Mortgage Status in San Juan Bautista
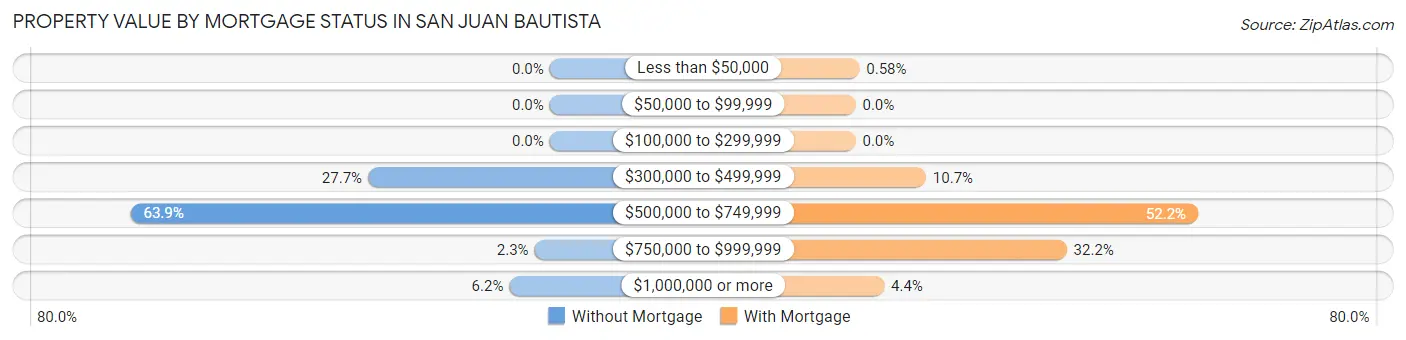
| Property Value | Without Mortgage | With Mortgage |
| Less than $50,000 | 0 (0.0%) | 2 (0.6%) |
| $50,000 to $99,999 | 0 (0.0%) | 0 (0.0%) |
| $100,000 to $299,999 | 0 (0.0%) | 0 (0.0%) |
| $300,000 to $499,999 | 36 (27.7%) | 37 (10.7%) |
| $500,000 to $749,999 | 83 (63.8%) | 180 (52.2%) |
| $750,000 to $999,999 | 3 (2.3%) | 111 (32.2%) |
| $1,000,000 or more | 8 (6.1%) | 15 (4.3%) |
| Total | 130 (100.0%) | 345 (100.0%) |
Household Income by Mortgage Status in San Juan Bautista
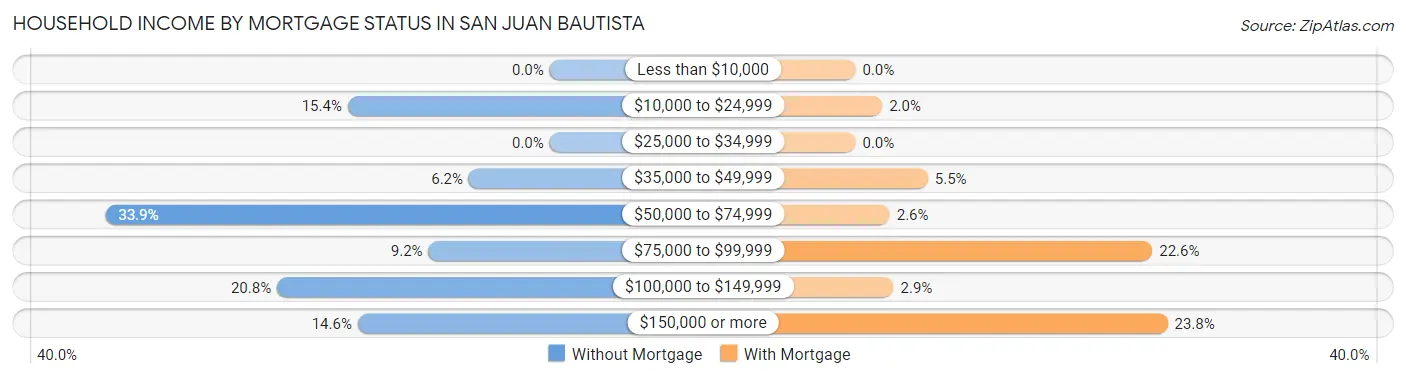
| Household Income | Without Mortgage | With Mortgage |
| Less than $10,000 | 0 (0.0%) | 0 (0.0%) |
| $10,000 to $24,999 | 20 (15.4%) | 7 (2.0%) |
| $25,000 to $34,999 | 0 (0.0%) | 0 (0.0%) |
| $35,000 to $49,999 | 8 (6.1%) | 19 (5.5%) |
| $50,000 to $74,999 | 44 (33.9%) | 9 (2.6%) |
| $75,000 to $99,999 | 12 (9.2%) | 78 (22.6%) |
| $100,000 to $149,999 | 27 (20.8%) | 10 (2.9%) |
| $150,000 or more | 19 (14.6%) | 82 (23.8%) |
| Total | 130 (100.0%) | 345 (100.0%) |
Property Value to Household Income Ratio in San Juan Bautista
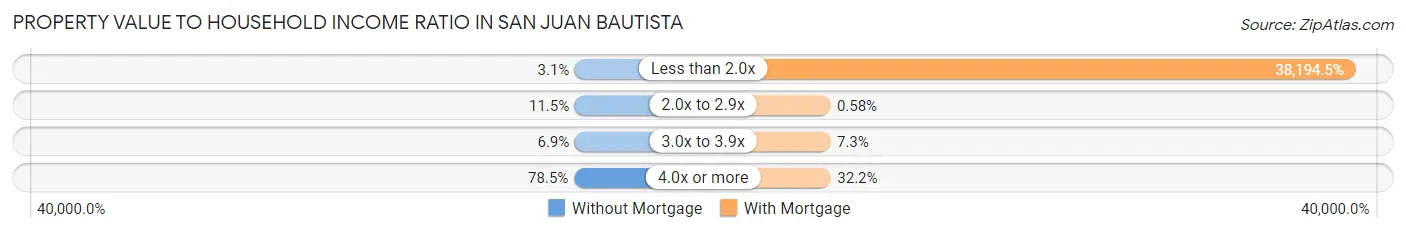
| Value-to-Income Ratio | Without Mortgage | With Mortgage |
| Less than 2.0x | 4 (3.1%) | 131,771 (38,194.5%) |
| 2.0x to 2.9x | 15 (11.5%) | 2 (0.6%) |
| 3.0x to 3.9x | 9 (6.9%) | 25 (7.2%) |
| 4.0x or more | 102 (78.5%) | 111 (32.2%) |
| Total | 130 (100.0%) | 345 (100.0%) |
Real Estate Taxes by Mortgage Status in San Juan Bautista
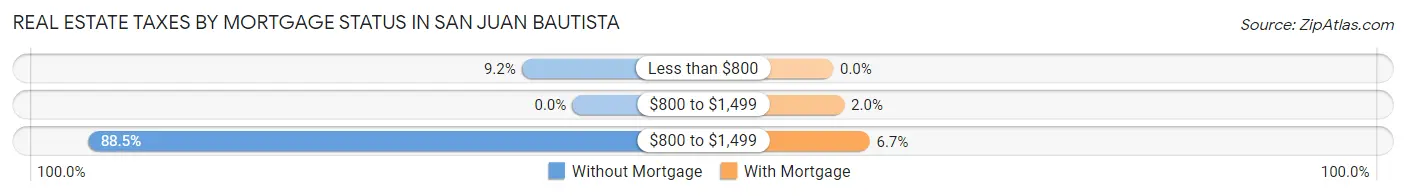
| Property Taxes | Without Mortgage | With Mortgage |
| Less than $800 | 12 (9.2%) | 0 (0.0%) |
| $800 to $1,499 | 0 (0.0%) | 7 (2.0%) |
| $800 to $1,499 | 115 (88.5%) | 23 (6.7%) |
| Total | 130 (100.0%) | 345 (100.0%) |
Health & Disability in San Juan Bautista
Health Insurance Coverage by Age in San Juan Bautista
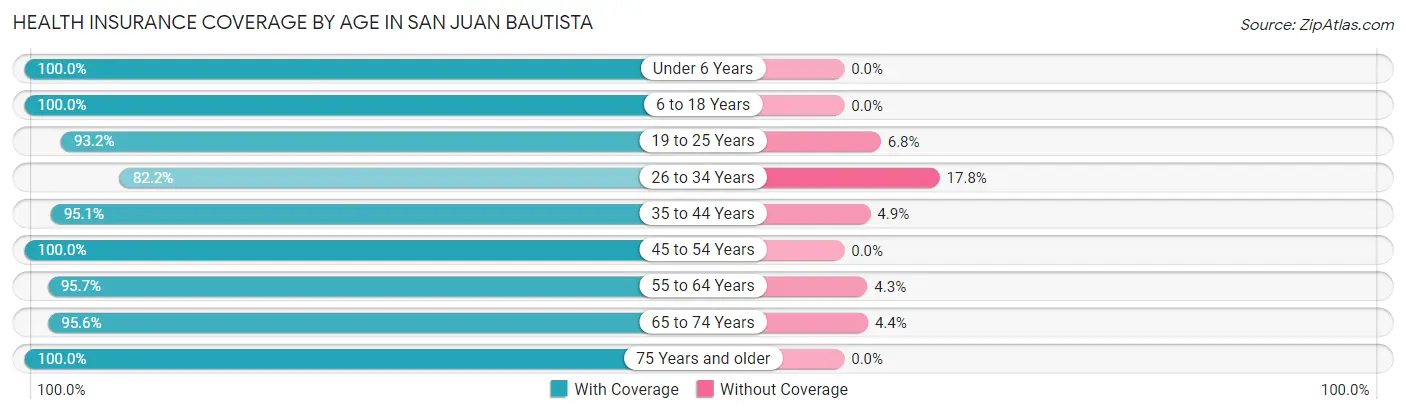
| Age Bracket | With Coverage | Without Coverage |
| Under 6 Years | 210 (100.0%) | 0 (0.0%) |
| 6 to 18 Years | 263 (100.0%) | 0 (0.0%) |
| 19 to 25 Years | 96 (93.2%) | 7 (6.8%) |
| 26 to 34 Years | 222 (82.2%) | 48 (17.8%) |
| 35 to 44 Years | 293 (95.1%) | 15 (4.9%) |
| 45 to 54 Years | 209 (100.0%) | 0 (0.0%) |
| 55 to 64 Years | 222 (95.7%) | 10 (4.3%) |
| 65 to 74 Years | 173 (95.6%) | 8 (4.4%) |
| 75 Years and older | 200 (100.0%) | 0 (0.0%) |
| Total | 1,888 (95.6%) | 88 (4.4%) |
Health Insurance Coverage by Citizenship Status in San Juan Bautista
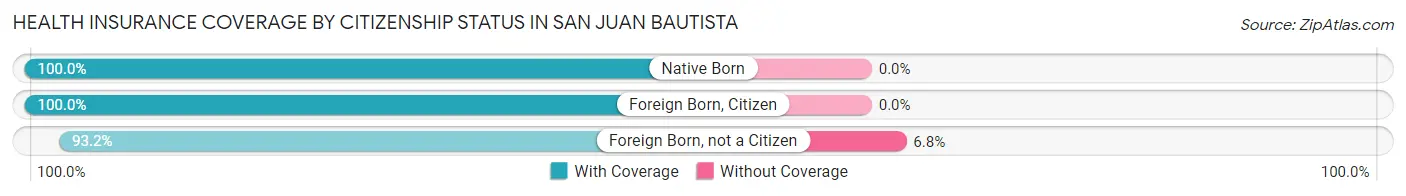
| Citizenship Status | With Coverage | Without Coverage |
| Native Born | 210 (100.0%) | 0 (0.0%) |
| Foreign Born, Citizen | 263 (100.0%) | 0 (0.0%) |
| Foreign Born, not a Citizen | 96 (93.2%) | 7 (6.8%) |
Health Insurance Coverage by Household Income in San Juan Bautista
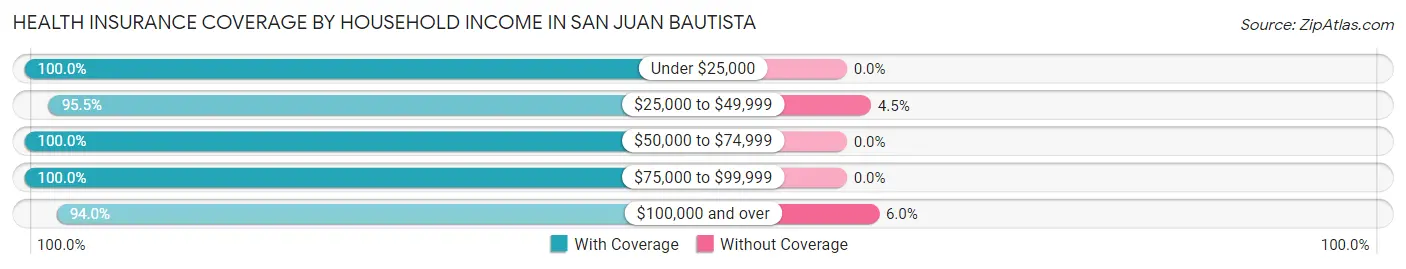
| Household Income | With Coverage | Without Coverage |
| Under $25,000 | 53 (100.0%) | 0 (0.0%) |
| $25,000 to $49,999 | 211 (95.5%) | 10 (4.5%) |
| $50,000 to $74,999 | 225 (100.0%) | 0 (0.0%) |
| $75,000 to $99,999 | 145 (100.0%) | 0 (0.0%) |
| $100,000 and over | 1,218 (94.0%) | 78 (6.0%) |
Public vs Private Health Insurance Coverage by Age in San Juan Bautista
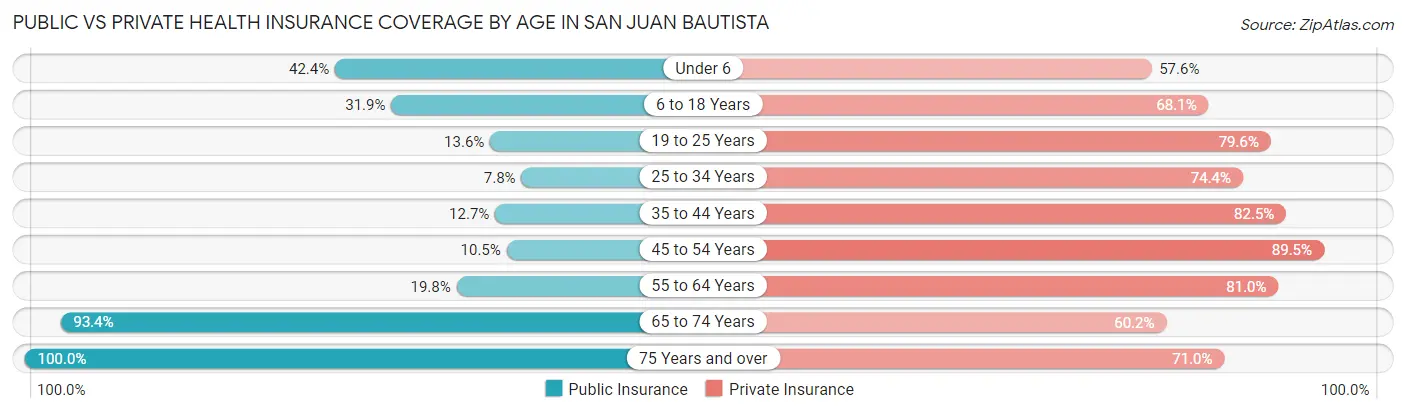
| Age Bracket | Public Insurance | Private Insurance |
| Under 6 | 89 (42.4%) | 121 (57.6%) |
| 6 to 18 Years | 84 (31.9%) | 179 (68.1%) |
| 19 to 25 Years | 14 (13.6%) | 82 (79.6%) |
| 25 to 34 Years | 21 (7.8%) | 201 (74.4%) |
| 35 to 44 Years | 39 (12.7%) | 254 (82.5%) |
| 45 to 54 Years | 22 (10.5%) | 187 (89.5%) |
| 55 to 64 Years | 46 (19.8%) | 188 (81.0%) |
| 65 to 74 Years | 169 (93.4%) | 109 (60.2%) |
| 75 Years and over | 200 (100.0%) | 142 (71.0%) |
| Total | 684 (34.6%) | 1,463 (74.0%) |
Disability Status by Sex by Age in San Juan Bautista
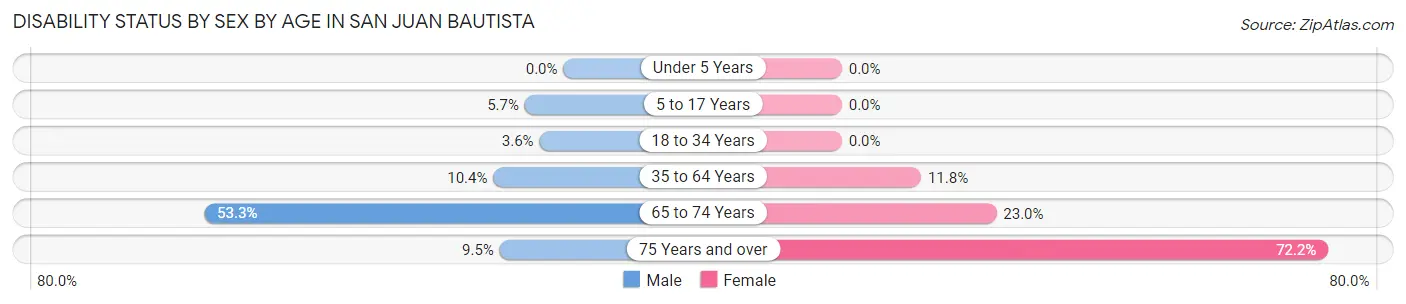
| Age Bracket | Male | Female |
| Under 5 Years | 0 (0.0%) | 0 (0.0%) |
| 5 to 17 Years | 9 (5.7%) | 0 (0.0%) |
| 18 to 34 Years | 6 (3.5%) | 0 (0.0%) |
| 35 to 64 Years | 39 (10.4%) | 44 (11.8%) |
| 65 to 74 Years | 64 (53.3%) | 14 (23.0%) |
| 75 Years and over | 7 (9.5%) | 91 (72.2%) |
Disability Class by Sex by Age in San Juan Bautista
Disability Class: Hearing Difficulty
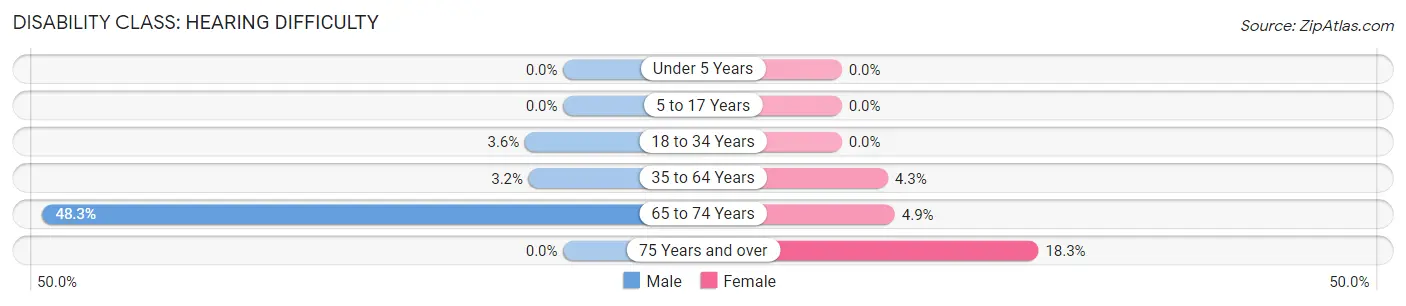
| Age Bracket | Male | Female |
| Under 5 Years | 0 (0.0%) | 0 (0.0%) |
| 5 to 17 Years | 0 (0.0%) | 0 (0.0%) |
| 18 to 34 Years | 6 (3.5%) | 0 (0.0%) |
| 35 to 64 Years | 12 (3.2%) | 16 (4.3%) |
| 65 to 74 Years | 58 (48.3%) | 3 (4.9%) |
| 75 Years and over | 0 (0.0%) | 23 (18.2%) |
Disability Class: Vision Difficulty
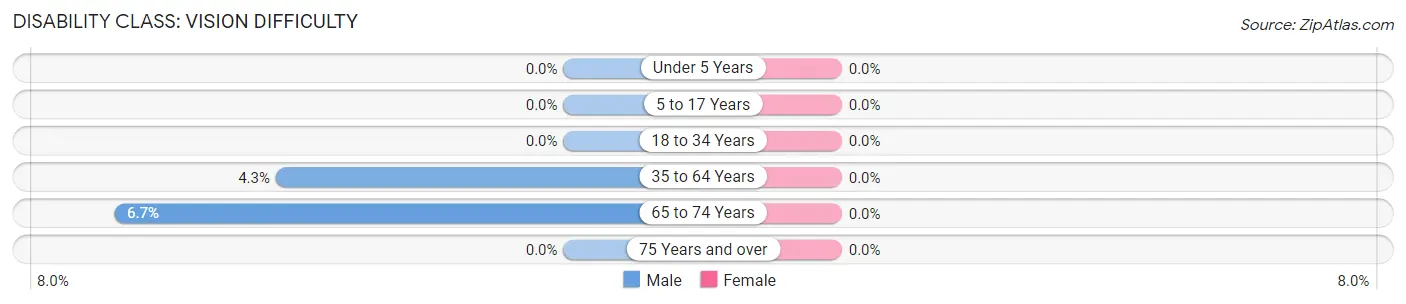
| Age Bracket | Male | Female |
| Under 5 Years | 0 (0.0%) | 0 (0.0%) |
| 5 to 17 Years | 0 (0.0%) | 0 (0.0%) |
| 18 to 34 Years | 0 (0.0%) | 0 (0.0%) |
| 35 to 64 Years | 16 (4.3%) | 0 (0.0%) |
| 65 to 74 Years | 8 (6.7%) | 0 (0.0%) |
| 75 Years and over | 0 (0.0%) | 0 (0.0%) |
Disability Class: Cognitive Difficulty
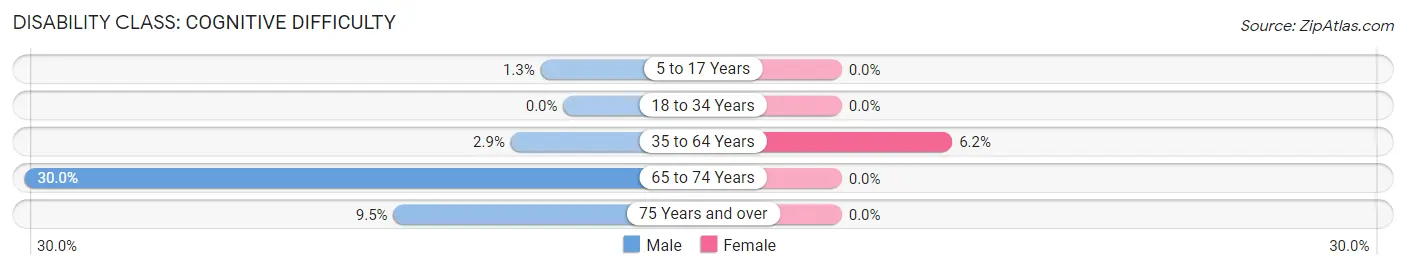
| Age Bracket | Male | Female |
| 5 to 17 Years | 2 (1.3%) | 0 (0.0%) |
| 18 to 34 Years | 0 (0.0%) | 0 (0.0%) |
| 35 to 64 Years | 11 (2.9%) | 23 (6.1%) |
| 65 to 74 Years | 36 (30.0%) | 0 (0.0%) |
| 75 Years and over | 7 (9.5%) | 0 (0.0%) |
Disability Class: Ambulatory Difficulty
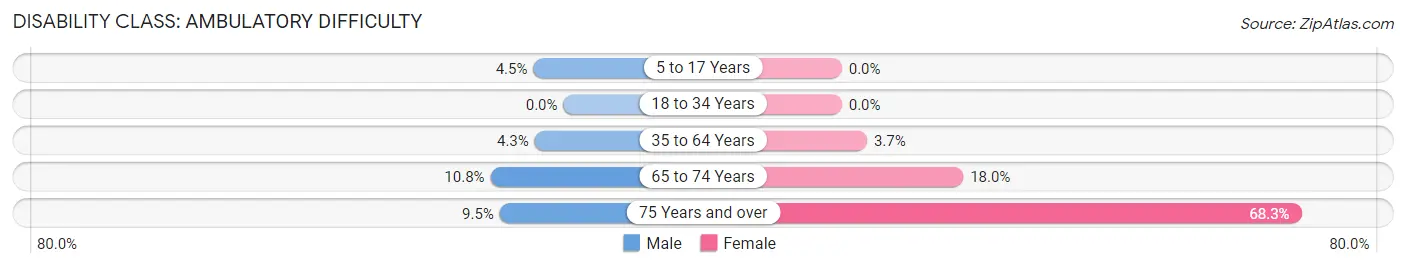
| Age Bracket | Male | Female |
| 5 to 17 Years | 7 (4.5%) | 0 (0.0%) |
| 18 to 34 Years | 0 (0.0%) | 0 (0.0%) |
| 35 to 64 Years | 16 (4.3%) | 14 (3.7%) |
| 65 to 74 Years | 13 (10.8%) | 11 (18.0%) |
| 75 Years and over | 7 (9.5%) | 86 (68.2%) |
Disability Class: Self-Care Difficulty
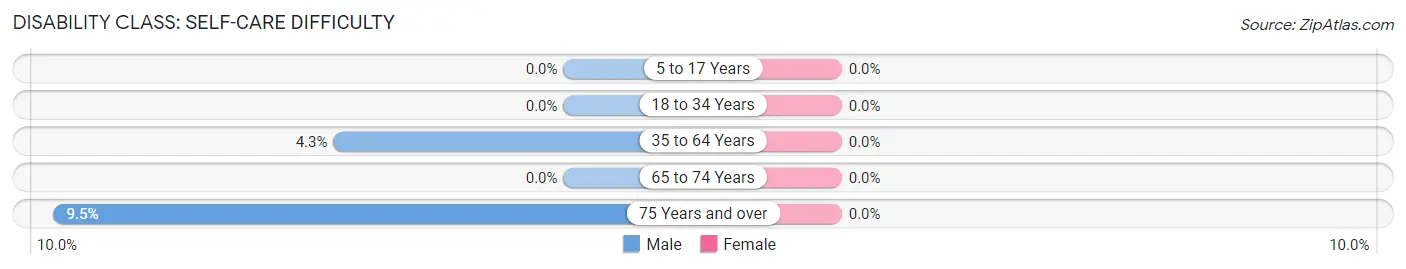
| Age Bracket | Male | Female |
| 5 to 17 Years | 0 (0.0%) | 0 (0.0%) |
| 18 to 34 Years | 0 (0.0%) | 0 (0.0%) |
| 35 to 64 Years | 16 (4.3%) | 0 (0.0%) |
| 65 to 74 Years | 0 (0.0%) | 0 (0.0%) |
| 75 Years and over | 7 (9.5%) | 0 (0.0%) |
Technology Access in San Juan Bautista
Computing Device Access in San Juan Bautista
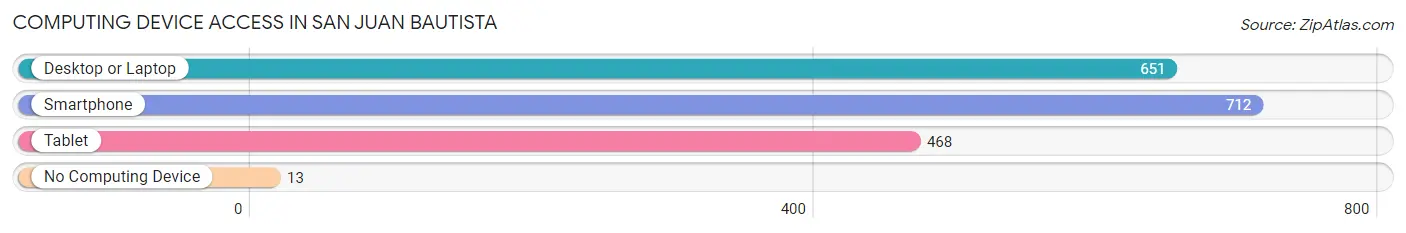
| Device Type | # Households | % Households |
| Desktop or Laptop | 651 | 84.6% |
| Smartphone | 712 | 92.5% |
| Tablet | 468 | 60.8% |
| No Computing Device | 13 | 1.7% |
| Total | 770 | 100.0% |
Internet Access in San Juan Bautista
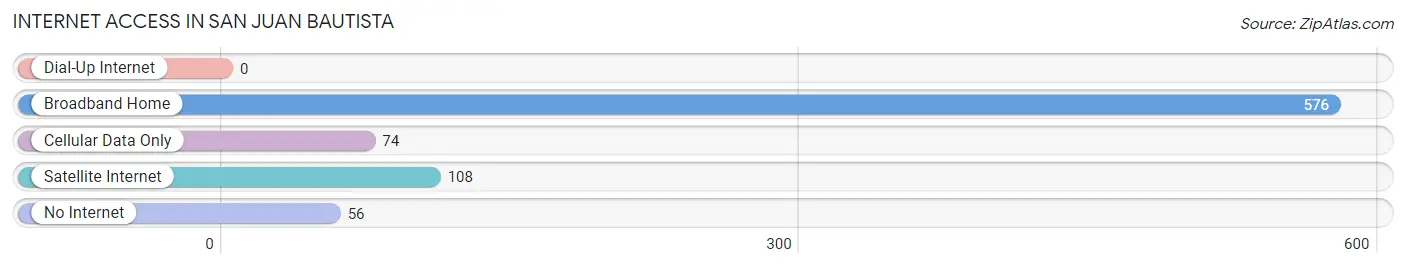
| Internet Type | # Households | % Households |
| Dial-Up Internet | 0 | 0.0% |
| Broadband Home | 576 | 74.8% |
| Cellular Data Only | 74 | 9.6% |
| Satellite Internet | 108 | 14.0% |
| No Internet | 56 | 7.3% |
| Total | 770 | 100.0% |
San Juan Bautista Summary
San Juan Bautista is a small city located in San Benito County, California. It is situated in the San Benito Valley, about 8 miles east of Hollister and 30 miles south of San Jose. The city is known for its historic downtown, which is home to the Mission San Juan Bautista, the only mission in California to remain in its original location.
History
San Juan Bautista was founded in 1797 by Father Fermin Lasuen, who established the Mission San Juan Bautista. The mission was the fifteenth of the twenty-one missions founded by the Spanish in California. The mission was built to serve the local Ohlone Indians, who were the original inhabitants of the area. The mission was also used as a base for the Spanish to explore and colonize the region.
The mission was secularized in 1834, and the land was divided among the local Indians and Mexican settlers. The town of San Juan Bautista was established in 1839, and the city was incorporated in 1868.
Geography
San Juan Bautista is located in the San Benito Valley, which is part of the Central Coast region of California. The city is situated at an elevation of about 200 feet above sea level. The city is surrounded by rolling hills and is located near the San Andreas Fault.
The climate in San Juan Bautista is mild and Mediterranean, with warm summers and cool winters. The average annual temperature is about 60 degrees Fahrenheit. The average annual precipitation is about 17 inches.
Economy
The economy of San Juan Bautista is largely based on agriculture. The city is home to several wineries, and the surrounding area is known for its production of garlic, strawberries, and other fruits and vegetables. The city is also home to several small businesses, including restaurants, shops, and galleries.
Demographics
As of the 2010 census, the population of San Juan Bautista was 1,862. The racial makeup of the city was 68.3% White, 0.7% African American, 0.7% Native American, 0.7% Asian, 0.2% Pacific Islander, and 28.2% from other races. The median household income was $45,000, and the median family income was $50,000.
San Juan Bautista is a small city with a rich history and a diverse population. The city is home to the Mission San Juan Bautista, which is the only mission in California to remain in its original location. The city is also known for its agricultural economy, which is based on the production of garlic, strawberries, and other fruits and vegetables. The city has a mild climate and is home to several small businesses, including restaurants, shops, and galleries.
Common Questions
What is Per Capita Income in San Juan Bautista?
Per Capita income in San Juan Bautista is $46,335.
What is the Median Family Income in San Juan Bautista?
Median Family Income in San Juan Bautista is $122,639.
What is the Median Household income in San Juan Bautista?
Median Household Income in San Juan Bautista is $103,036.
What is Income or Wage Gap in San Juan Bautista?
Income or Wage Gap in San Juan Bautista is 36.3%.
Women in San Juan Bautista earn 63.7 cents for every dollar earned by a man.
What is Inequality or Gini Index in San Juan Bautista?
Inequality or Gini Index in San Juan Bautista is 0.37.
What is the Total Population of San Juan Bautista?
Total Population of San Juan Bautista is 1,976.
What is the Total Male Population of San Juan Bautista?
Total Male Population of San Juan Bautista is 1,017.
What is the Total Female Population of San Juan Bautista?
Total Female Population of San Juan Bautista is 959.
What is the Ratio of Males per 100 Females in San Juan Bautista?
There are 106.05 Males per 100 Females in San Juan Bautista.
What is the Ratio of Females per 100 Males in San Juan Bautista?
There are 94.30 Females per 100 Males in San Juan Bautista.
What is the Median Population Age in San Juan Bautista?
Median Population Age in San Juan Bautista is 40.2 Years.
What is the Average Family Size in San Juan Bautista
Average Family Size in San Juan Bautista is 3.1 People.
What is the Average Household Size in San Juan Bautista
Average Household Size in San Juan Bautista is 2.5 People.
How Large is the Labor Force in San Juan Bautista?
There are 1,029 People in the Labor Forcein in San Juan Bautista.
What is the Percentage of People in the Labor Force in San Juan Bautista?
66.1% of People are in the Labor Force in San Juan Bautista.
What is the Unemployment Rate in San Juan Bautista?
Unemployment Rate in San Juan Bautista is 2.3%.