Cities with the Lowest Poverty Level Among Seniors Over the Age of 65 in Arizona
RELATED REPORTS & OPTIONS
Lowest Poverty | Seniors 65+
Arizona
Compare Cities
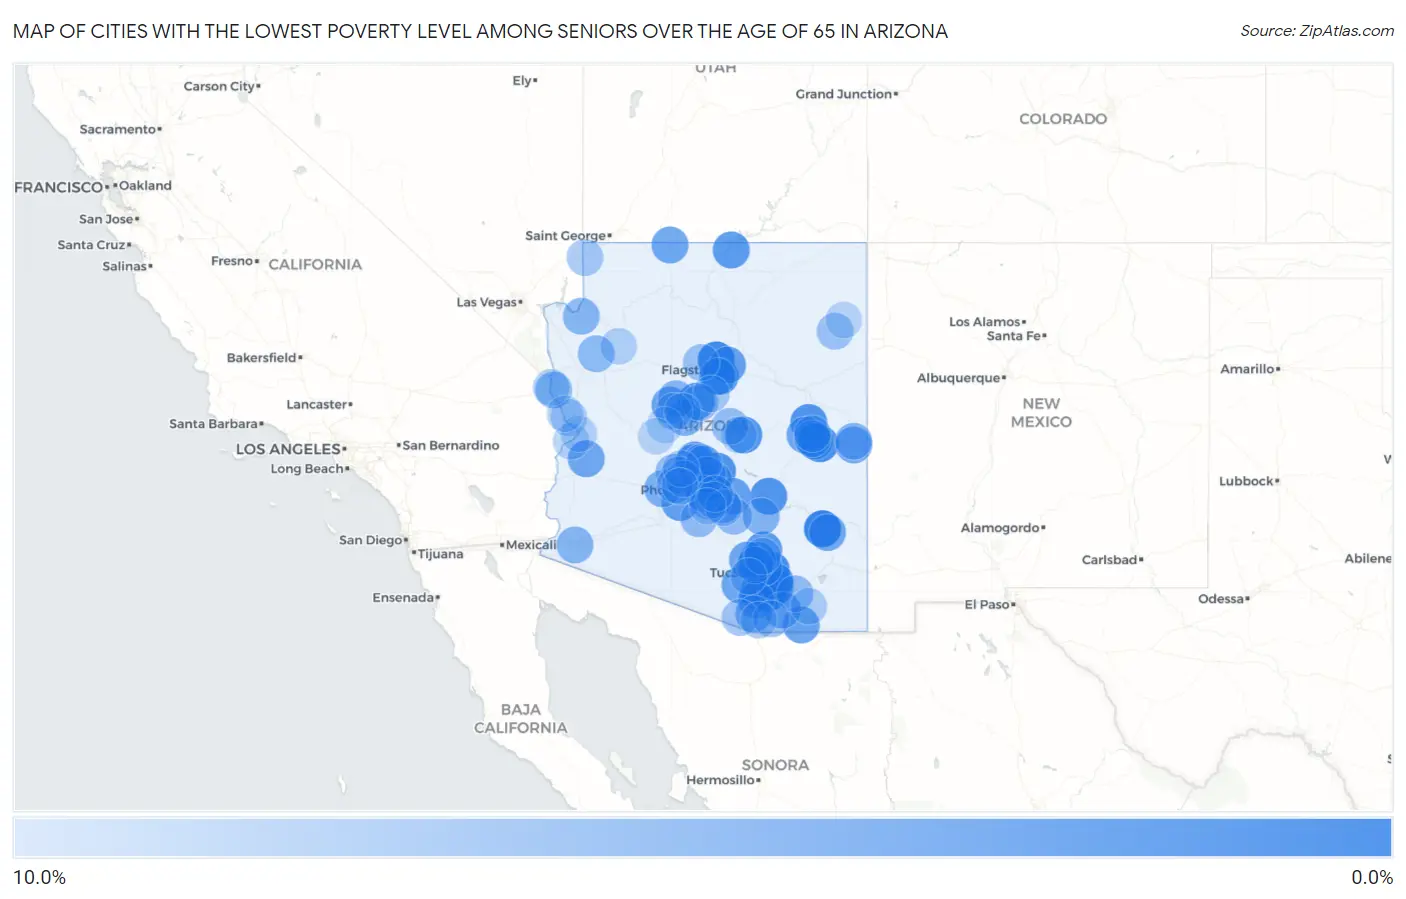
Map of Cities with the Lowest Poverty Level Among Seniors Over the Age of 65 in Arizona
10.0%
0.0%
Cities with the Lowest Poverty Level Among Seniors Over the Age of 65 in Arizona
| City | Senior Poverty | vs State | vs National | |
| 1. | Pima | 1.1% | 9.3%(-8.21)#1 | 10.0%(-8.84)#348 |
| 2. | Paradise Valley | 1.3% | 9.3%(-8.02)#2 | 10.0%(-8.65)#490 |
| 3. | Corona De Tucson | 1.6% | 9.3%(-7.74)#3 | 10.0%(-8.37)#705 |
| 4. | Red Rock Cdp Pinal County | 1.6% | 9.3%(-7.72)#4 | 10.0%(-8.36)#724 |
| 5. | Fort Valley | 1.6% | 9.3%(-7.69)#5 | 10.0%(-8.33)#752 |
| 6. | Pinetop Country Club | 1.8% | 9.3%(-7.50)#6 | 10.0%(-8.14)#911 |
| 7. | Tanque Verde | 1.8% | 9.3%(-7.48)#7 | 10.0%(-8.12)#930 |
| 8. | Mountainaire | 2.0% | 9.3%(-7.34)#8 | 10.0%(-7.98)#1,070 |
| 9. | Rio Verde | 2.5% | 9.3%(-6.82)#9 | 10.0%(-7.46)#1,582 |
| 10. | Blue Ridge | 2.6% | 9.3%(-6.76)#10 | 10.0%(-7.40)#1,649 |
| 11. | Six Shooter Canyon | 2.6% | 9.3%(-6.73)#11 | 10.0%(-7.36)#1,690 |
| 12. | Star Valley | 2.6% | 9.3%(-6.69)#12 | 10.0%(-7.33)#1,725 |
| 13. | Sahuarita | 2.7% | 9.3%(-6.63)#13 | 10.0%(-7.26)#1,814 |
| 14. | Taylor | 2.7% | 9.3%(-6.62)#14 | 10.0%(-7.26)#1,815 |
| 15. | Vail | 3.0% | 9.3%(-6.31)#15 | 10.0%(-6.95)#2,179 |
| 16. | Rincon Valley | 3.0% | 9.3%(-6.29)#16 | 10.0%(-6.93)#2,199 |
| 17. | Clarkdale | 3.1% | 9.3%(-6.25)#17 | 10.0%(-6.89)#2,254 |
| 18. | Catalina Foothills | 3.2% | 9.3%(-6.10)#18 | 10.0%(-6.73)#2,453 |
| 19. | Lechee | 3.3% | 9.3%(-5.98)#19 | 10.0%(-6.62)#2,613 |
| 20. | New River | 3.4% | 9.3%(-5.96)#20 | 10.0%(-6.60)#2,660 |
| 21. | Saddlebrooke | 3.4% | 9.3%(-5.87)#21 | 10.0%(-6.51)#2,770 |
| 22. | Goodyear | 3.7% | 9.3%(-5.65)#22 | 10.0%(-6.29)#3,089 |
| 23. | Oro Valley | 3.7% | 9.3%(-5.65)#23 | 10.0%(-6.28)#3,091 |
| 24. | Gold Canyon | 3.7% | 9.3%(-5.60)#24 | 10.0%(-6.23)#3,169 |
| 25. | Doney Park | 4.0% | 9.3%(-5.33)#25 | 10.0%(-5.97)#3,516 |
| 26. | Sierra Vista Southeast | 4.0% | 9.3%(-5.29)#26 | 10.0%(-5.93)#3,582 |
| 27. | Tucson Mountains | 4.0% | 9.3%(-5.27)#27 | 10.0%(-5.90)#3,607 |
| 28. | Williamson | 4.0% | 9.3%(-5.27)#28 | 10.0%(-5.90)#3,609 |
| 29. | Fredonia | 4.3% | 9.3%(-5.03)#29 | 10.0%(-5.67)#3,939 |
| 30. | Three Points | 4.4% | 9.3%(-4.94)#30 | 10.0%(-5.58)#4,088 |
| 31. | Marana | 4.4% | 9.3%(-4.94)#31 | 10.0%(-5.58)#4,092 |
| 32. | Linden | 4.4% | 9.3%(-4.90)#32 | 10.0%(-5.53)#4,165 |
| 33. | Bouse | 4.5% | 9.3%(-4.83)#33 | 10.0%(-5.46)#4,280 |
| 34. | Red Lake | 4.6% | 9.3%(-4.69)#34 | 10.0%(-5.32)#4,476 |
| 35. | Thatcher | 4.6% | 9.3%(-4.68)#35 | 10.0%(-5.31)#4,492 |
| 36. | Pinetop Lakeside | 4.9% | 9.3%(-4.44)#36 | 10.0%(-5.07)#4,807 |
| 37. | Elgin | 5.0% | 9.3%(-4.32)#37 | 10.0%(-4.95)#5,007 |
| 38. | Eagar | 5.1% | 9.3%(-4.24)#38 | 10.0%(-4.87)#5,110 |
| 39. | Buckeye | 5.3% | 9.3%(-4.00)#39 | 10.0%(-4.63)#5,480 |
| 40. | Green Valley | 5.3% | 9.3%(-3.97)#40 | 10.0%(-4.60)#5,529 |
| 41. | Tubac | 5.5% | 9.3%(-3.85)#41 | 10.0%(-4.49)#5,714 |
| 42. | Dewey Humboldt | 5.5% | 9.3%(-3.83)#42 | 10.0%(-4.46)#5,747 |
| 43. | Anthem | 5.5% | 9.3%(-3.83)#43 | 10.0%(-4.46)#5,752 |
| 44. | Fountain Hills | 5.6% | 9.3%(-3.72)#44 | 10.0%(-4.36)#5,942 |
| 45. | Casas Adobes | 5.7% | 9.3%(-3.64)#45 | 10.0%(-4.28)#6,065 |
| 46. | Kearny | 5.8% | 9.3%(-3.56)#46 | 10.0%(-4.19)#6,195 |
| 47. | Springerville | 5.8% | 9.3%(-3.49)#47 | 10.0%(-4.13)#6,312 |
| 48. | Wellton | 5.9% | 9.3%(-3.46)#48 | 10.0%(-4.10)#6,353 |
| 49. | Kachina Village | 5.9% | 9.3%(-3.38)#49 | 10.0%(-4.01)#6,520 |
| 50. | Chino Valley | 6.0% | 9.3%(-3.32)#50 | 10.0%(-3.96)#6,601 |
| 51. | Meadview | 6.0% | 9.3%(-3.30)#51 | 10.0%(-3.93)#6,645 |
| 52. | Mohave Valley | 6.1% | 9.3%(-3.21)#52 | 10.0%(-3.85)#6,771 |
| 53. | Wagon Wheel | 6.2% | 9.3%(-3.13)#53 | 10.0%(-3.77)#6,911 |
| 54. | Antares | 6.2% | 9.3%(-3.07)#54 | 10.0%(-3.70)#7,031 |
| 55. | Cave Creek | 6.3% | 9.3%(-3.06)#55 | 10.0%(-3.70)#7,040 |
| 56. | Florence | 6.4% | 9.3%(-2.87)#56 | 10.0%(-3.51)#7,272 |
| 57. | Benson | 6.5% | 9.3%(-2.85)#57 | 10.0%(-3.48)#7,319 |
| 58. | Queen Creek | 6.5% | 9.3%(-2.83)#58 | 10.0%(-3.47)#7,356 |
| 59. | Maricopa | 6.5% | 9.3%(-2.78)#59 | 10.0%(-3.42)#7,411 |
| 60. | Surprise | 6.5% | 9.3%(-2.78)#60 | 10.0%(-3.41)#7,424 |
| 61. | Roosevelt Estates | 6.6% | 9.3%(-2.71)#61 | 10.0%(-3.35)#7,514 |
| 62. | Mountain View Ranches | 6.7% | 9.3%(-2.63)#62 | 10.0%(-3.26)#7,669 |
| 63. | Pine | 6.7% | 9.3%(-2.57)#63 | 10.0%(-3.20)#7,760 |
| 64. | Catalina | 6.8% | 9.3%(-2.55)#64 | 10.0%(-3.18)#7,788 |
| 65. | Scottsdale | 6.8% | 9.3%(-2.49)#65 | 10.0%(-3.12)#7,874 |
| 66. | Chandler | 6.8% | 9.3%(-2.47)#66 | 10.0%(-3.10)#7,904 |
| 67. | Show Low | 6.9% | 9.3%(-2.45)#67 | 10.0%(-3.09)#7,917 |
| 68. | Sun City West | 6.9% | 9.3%(-2.41)#68 | 10.0%(-3.04)#7,986 |
| 69. | Verde Village | 6.9% | 9.3%(-2.41)#69 | 10.0%(-3.04)#7,989 |
| 70. | Prescott | 7.0% | 9.3%(-2.34)#70 | 10.0%(-2.98)#8,066 |
| 71. | Burnside | 7.1% | 9.3%(-2.17)#71 | 10.0%(-2.81)#8,316 |
| 72. | Parks | 7.2% | 9.3%(-2.12)#72 | 10.0%(-2.75)#8,407 |
| 73. | Tempe | 7.3% | 9.3%(-2.05)#73 | 10.0%(-2.69)#8,498 |
| 74. | Arivaca | 7.4% | 9.3%(-1.94)#74 | 10.0%(-2.57)#8,639 |
| 75. | Patagonia | 7.4% | 9.3%(-1.89)#75 | 10.0%(-2.52)#8,709 |
| 76. | Gilbert | 7.5% | 9.3%(-1.86)#76 | 10.0%(-2.50)#8,751 |
| 77. | Carefree | 7.5% | 9.3%(-1.85)#77 | 10.0%(-2.49)#8,754 |
| 78. | San Tan Valley | 7.5% | 9.3%(-1.85)#78 | 10.0%(-2.49)#8,763 |
| 79. | Citrus Park | 7.5% | 9.3%(-1.81)#79 | 10.0%(-2.45)#8,812 |
| 80. | Scenic | 7.5% | 9.3%(-1.77)#80 | 10.0%(-2.41)#8,866 |
| 81. | Tucson Estates | 7.6% | 9.3%(-1.73)#81 | 10.0%(-2.36)#8,921 |
| 82. | Sedona | 7.6% | 9.3%(-1.71)#82 | 10.0%(-2.35)#8,953 |
| 83. | Rio Rico | 8.0% | 9.3%(-1.35)#83 | 10.0%(-1.99)#9,499 |
| 84. | Lake Havasu City | 8.0% | 9.3%(-1.35)#84 | 10.0%(-1.99)#9,500 |
| 85. | Sun City | 8.0% | 9.3%(-1.34)#85 | 10.0%(-1.98)#9,510 |
| 86. | Peoria | 8.1% | 9.3%(-1.24)#86 | 10.0%(-1.88)#9,657 |
| 87. | Willow Valley | 8.1% | 9.3%(-1.20)#87 | 10.0%(-1.83)#9,727 |
| 88. | Mesa | 8.1% | 9.3%(-1.18)#88 | 10.0%(-1.82)#9,739 |
| 89. | Tombstone | 8.1% | 9.3%(-1.17)#89 | 10.0%(-1.81)#9,754 |
| 90. | Peach Springs | 8.3% | 9.3%(-0.982)#90 | 10.0%(-1.62)#9,984 |
| 91. | Litchfield Park | 8.4% | 9.3%(-0.918)#91 | 10.0%(-1.55)#10,109 |
| 92. | Sun Lakes | 8.5% | 9.3%(-0.860)#92 | 10.0%(-1.50)#10,188 |
| 93. | Bluewater | 8.5% | 9.3%(-0.825)#93 | 10.0%(-1.46)#10,225 |
| 94. | Parker Strip | 8.6% | 9.3%(-0.733)#94 | 10.0%(-1.37)#10,365 |
| 95. | Payson | 8.7% | 9.3%(-0.663)#95 | 10.0%(-1.30)#10,461 |
| 96. | Desert Hills | 8.7% | 9.3%(-0.634)#96 | 10.0%(-1.27)#10,508 |
| 97. | Wilhoit | 8.7% | 9.3%(-0.605)#97 | 10.0%(-1.24)#10,551 |
| 98. | Yarnell | 8.8% | 9.3%(-0.513)#98 | 10.0%(-1.15)#10,668 |
| 99. | Prescott Valley | 8.8% | 9.3%(-0.494)#99 | 10.0%(-1.13)#10,691 |
| 100. | Nazlini | 8.8% | 9.3%(-0.492)#100 | 10.0%(-1.13)#10,703 |
Common Questions
What are the Top 10 Cities with the Lowest Poverty Level Among Seniors Over the Age of 65 in Arizona?
Top 10 Cities with the Lowest Poverty Level Among Seniors Over the Age of 65 in Arizona are:
#1
1.1%
#2
1.3%
#3
1.6%
#4
1.6%
#5
1.8%
#6
1.8%
#7
2.0%
#8
2.5%
#9
2.6%
#10
2.6%
What city has the Lowest Poverty Level Among Seniors Over the Age of 65 in Arizona?
Pima has the Lowest Poverty Level Among Seniors Over the Age of 65 in Arizona with 1.1%.
What is the Poverty Level Among Seniors Over the Age of 65 in the State of Arizona?
Poverty Level Among Seniors Over the Age of 65 in Arizona is 9.3%.
What is the Poverty Level Among Seniors Over the Age of 65 in the United States?
Poverty Level Among Seniors Over the Age of 65 in the United States is 10.0%.