Bradbury, CA Map & Demographics
Bradbury Map
Bradbury Overview
$92,386
PER CAPITA INCOME
$168,750
AVG FAMILY INCOME
$158,438
AVG HOUSEHOLD INCOME
64.3%
WAGE / INCOME GAP [ % ]
35.7¢/ $1
WAGE / INCOME GAP [ $ ]
0.53
INEQUALITY / GINI INDEX
767
TOTAL POPULATION
370
MALE POPULATION
397
FEMALE POPULATION
93.20
MALES / 100 FEMALES
107.30
FEMALES / 100 MALES
53.0
MEDIAN AGE
3.0
AVG FAMILY SIZE
2.8
AVG HOUSEHOLD SIZE
409
LABOR FORCE [ PEOPLE ]
59.9%
PERCENT IN LABOR FORCE
7.3%
UNEMPLOYMENT RATE
Bradbury Area Codes
Income in Bradbury
Income Overview in Bradbury
Per Capita Income in Bradbury is $92,386, while median incomes of families and households are $168,750 and $158,438 respectively.
| Characteristic | Number | Measure |
| Per Capita Income | 767 | $92,386 |
| Median Family Income | 238 | $168,750 |
| Mean Family Income | 238 | $267,339 |
| Median Household Income | 277 | $158,438 |
| Mean Household Income | 277 | $245,364 |
| Income Deficit | 238 | $0 |
| Wage / Income Gap (%) | 767 | 64.29% |
| Wage / Income Gap ($) | 767 | 35.71¢ per $1 |
| Gini / Inequality Index | 767 | 0.53 |
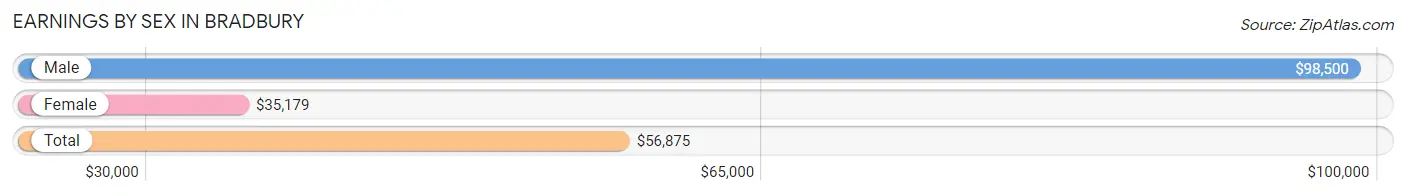
Earnings by Sex in Bradbury
Average Earnings in Bradbury are $56,875, $98,500 for men and $35,179 for women, a difference of 64.3%.
| Sex | Number | Average Earnings |
| Male | 236 (54.5%) | $98,500 |
| Female | 197 (45.5%) | $35,179 |
| Total | 433 (100.0%) | $56,875 |
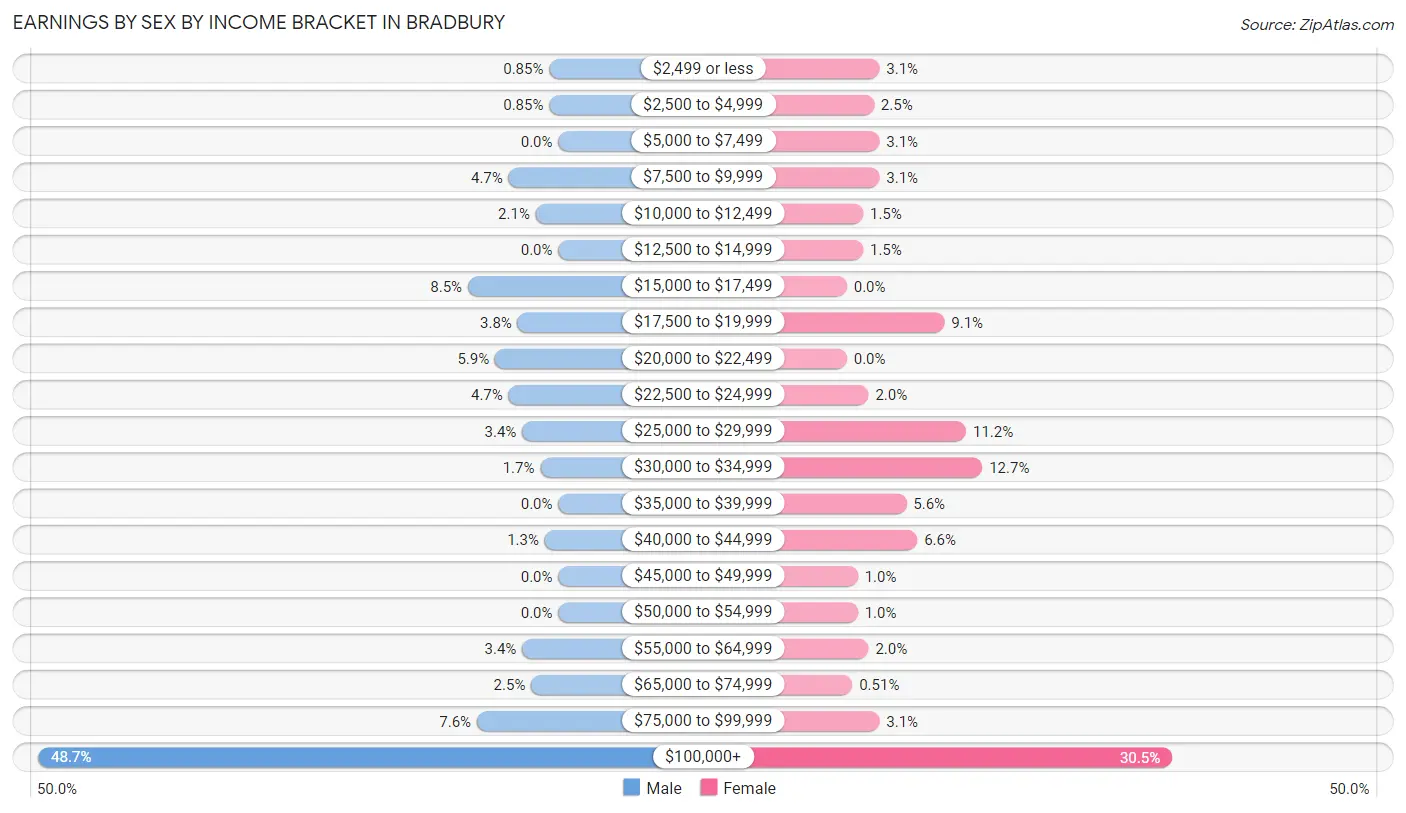
Earnings by Sex by Income Bracket in Bradbury
The most common earnings brackets in Bradbury are $100,000+ for men (115 | 48.7%) and $100,000+ for women (60 | 30.5%).
| Income | Male | Female |
| $2,499 or less | 2 (0.9%) | 6 (3.0%) |
| $2,500 to $4,999 | 2 (0.9%) | 5 (2.5%) |
| $5,000 to $7,499 | 0 (0.0%) | 6 (3.0%) |
| $7,500 to $9,999 | 11 (4.7%) | 6 (3.0%) |
| $10,000 to $12,499 | 5 (2.1%) | 3 (1.5%) |
| $12,500 to $14,999 | 0 (0.0%) | 3 (1.5%) |
| $15,000 to $17,499 | 20 (8.5%) | 0 (0.0%) |
| $17,500 to $19,999 | 9 (3.8%) | 18 (9.1%) |
| $20,000 to $22,499 | 14 (5.9%) | 0 (0.0%) |
| $22,500 to $24,999 | 11 (4.7%) | 4 (2.0%) |
| $25,000 to $29,999 | 8 (3.4%) | 22 (11.2%) |
| $30,000 to $34,999 | 4 (1.7%) | 25 (12.7%) |
| $35,000 to $39,999 | 0 (0.0%) | 11 (5.6%) |
| $40,000 to $44,999 | 3 (1.3%) | 13 (6.6%) |
| $45,000 to $49,999 | 0 (0.0%) | 2 (1.0%) |
| $50,000 to $54,999 | 0 (0.0%) | 2 (1.0%) |
| $55,000 to $64,999 | 8 (3.4%) | 4 (2.0%) |
| $65,000 to $74,999 | 6 (2.5%) | 1 (0.5%) |
| $75,000 to $99,999 | 18 (7.6%) | 6 (3.0%) |
| $100,000+ | 115 (48.7%) | 60 (30.5%) |
| Total | 236 (100.0%) | 197 (100.0%) |
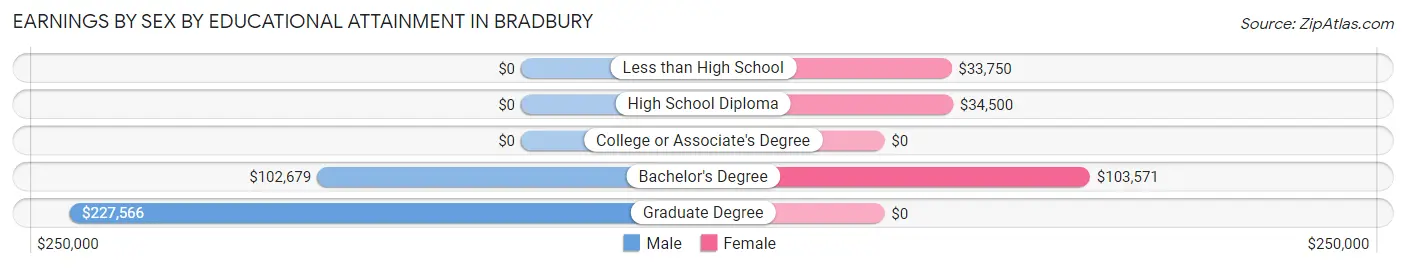
Earnings by Sex by Educational Attainment in Bradbury
Average earnings in Bradbury are $110,313 for men and $36,786 for women, a difference of 66.6%. Men with an educational attainment of graduate degree enjoy the highest average annual earnings of $227,566, while those with bachelor's degree education earn the least with $102,679. Women with an educational attainment of bachelor's degree earn the most with the average annual earnings of $103,571, while those with less than high school education have the smallest earnings of $33,750.
| Educational Attainment | Male Income | Female Income |
| Less than High School | - | - |
| High School Diploma | - | - |
| College or Associate's Degree | - | - |
| Bachelor's Degree | $102,679 | $103,571 |
| Graduate Degree | $227,566 | $0 |
| Total | $110,313 | $36,786 |
Family Income in Bradbury
Family Income Brackets in Bradbury
According to the Bradbury family income data, there are 101 families falling into the $200,000+ income range, which is the most common income bracket and makes up 42.4% of all families.
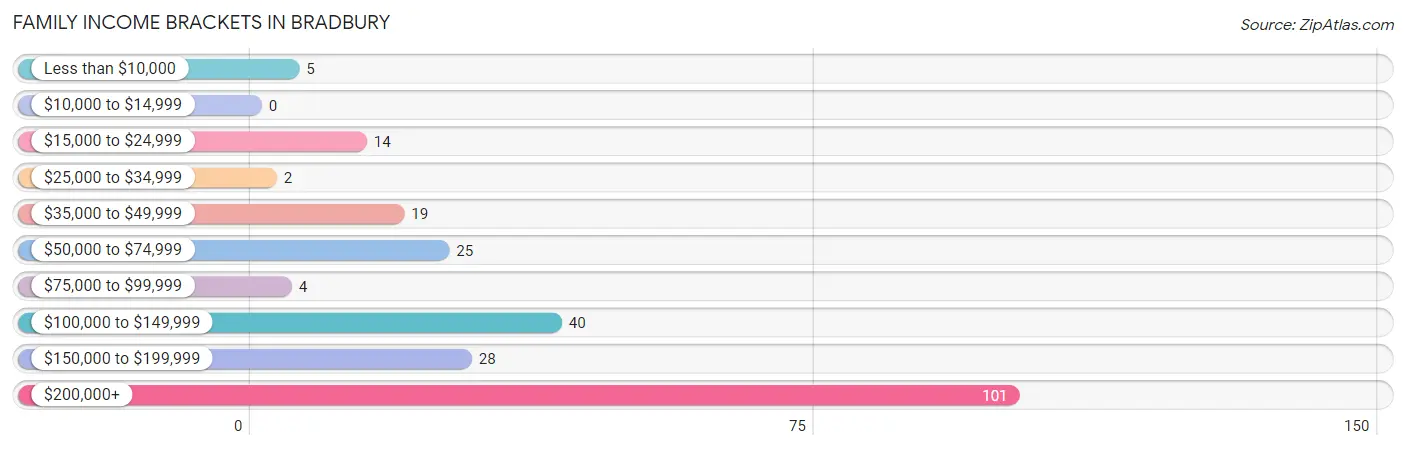
| Income Bracket | # Families | % Families |
| Less than $10,000 | 5 | 2.1% |
| $10,000 to $14,999 | 0 | 0.0% |
| $15,000 to $24,999 | 14 | 5.9% |
| $25,000 to $34,999 | 2 | 0.8% |
| $35,000 to $49,999 | 19 | 8.0% |
| $50,000 to $74,999 | 25 | 10.5% |
| $75,000 to $99,999 | 4 | 1.7% |
| $100,000 to $149,999 | 40 | 16.8% |
| $150,000 to $199,999 | 28 | 11.8% |
| $200,000+ | 101 | 42.4% |
Family Income by Famaliy Size in Bradbury
4-person families (53 | 22.3%) account for the highest median family income in Bradbury with $236,250 per family, while 2-person families (125 | 52.5%) have the highest median income of $81,562 per family member.
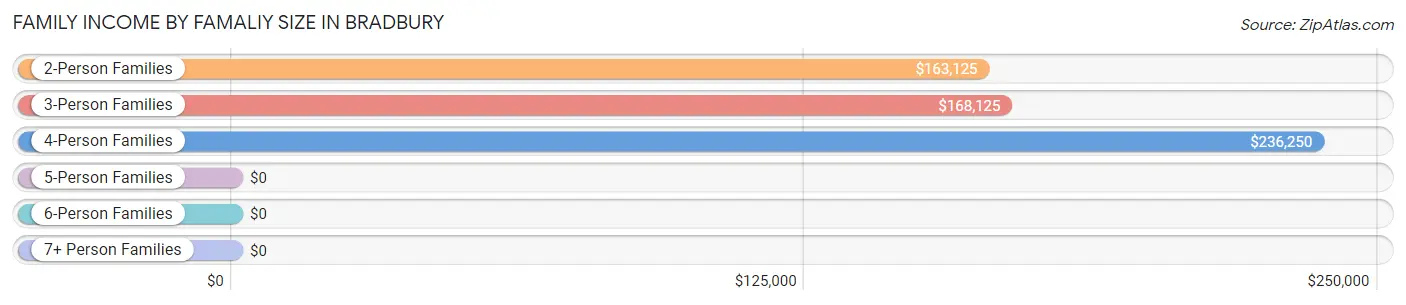
| Income Bracket | # Families | Median Income |
| 2-Person Families | 125 (52.5%) | $163,125 |
| 3-Person Families | 46 (19.3%) | $168,125 |
| 4-Person Families | 53 (22.3%) | $236,250 |
| 5-Person Families | 11 (4.6%) | $0 |
| 6-Person Families | 3 (1.3%) | $0 |
| 7+ Person Families | 0 (0.0%) | $0 |
| Total | 238 (100.0%) | $168,750 |
Family Income by Number of Earners in Bradbury
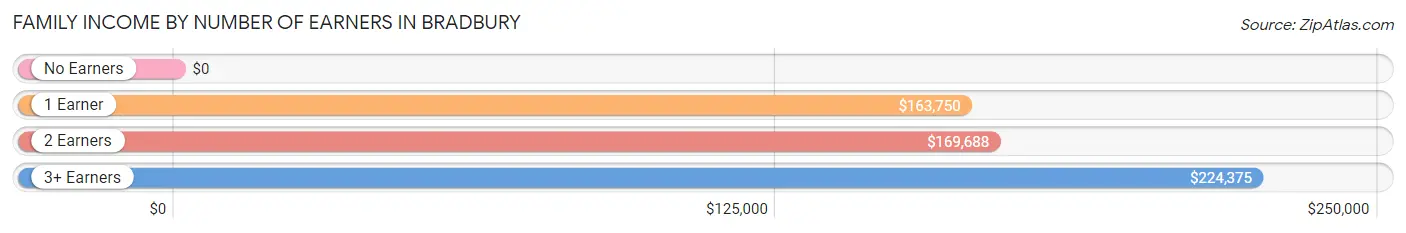
| Number of Earners | # Families | Median Income |
| No Earners | 18 (7.6%) | $0 |
| 1 Earner | 110 (46.2%) | $163,750 |
| 2 Earners | 65 (27.3%) | $169,688 |
| 3+ Earners | 45 (18.9%) | $224,375 |
| Total | 238 (100.0%) | $168,750 |
Household Income in Bradbury
Household Income Brackets in Bradbury
With 107 households falling in the category, the $200,000+ income range is the most frequent in Bradbury, accounting for 38.6% of all households. In contrast, only 2 households (0.7%) fall into the $10,000 to $14,999 income bracket, making it the least populous group.
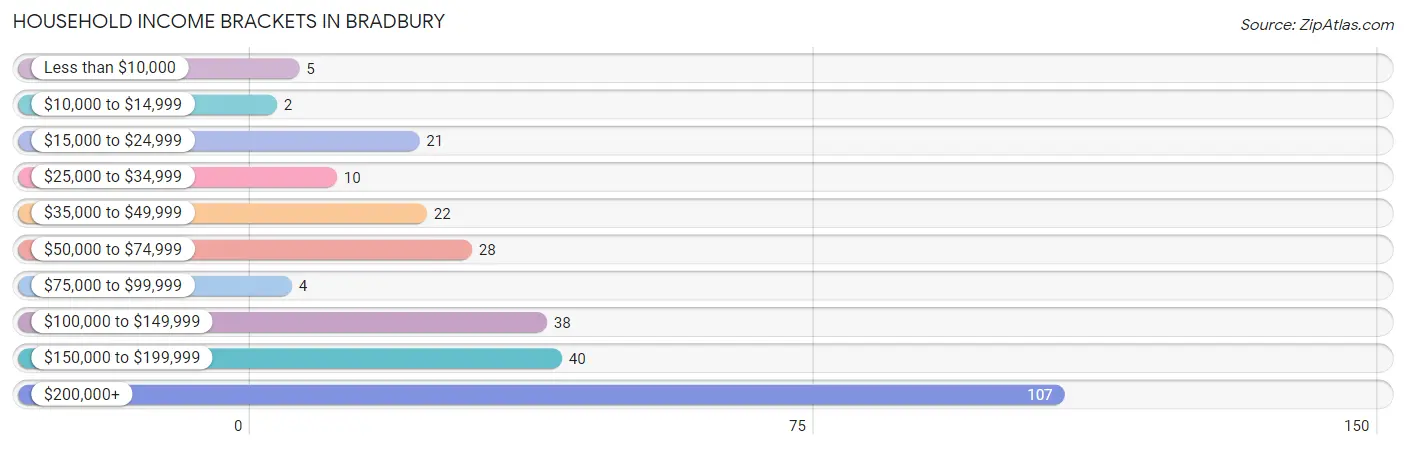
| Income Bracket | # Households | % Households |
| Less than $10,000 | 5 | 1.8% |
| $10,000 to $14,999 | 2 | 0.7% |
| $15,000 to $24,999 | 21 | 7.6% |
| $25,000 to $34,999 | 10 | 3.6% |
| $35,000 to $49,999 | 22 | 7.9% |
| $50,000 to $74,999 | 28 | 10.1% |
| $75,000 to $99,999 | 4 | 1.4% |
| $100,000 to $149,999 | 38 | 13.7% |
| $150,000 to $199,999 | 40 | 14.4% |
| $200,000+ | 107 | 38.6% |
Household Income by Householder Age in Bradbury
The median household income in Bradbury is $158,438, with the highest median household income of $171,667 found in the 45 to 64 years age bracket for the primary householder. A total of 148 households (53.4%) fall into this category. Meanwhile, the 15 to 24 years age bracket for the primary householder has the lowest median household income of $0, with 2 households (0.7%) in this group.
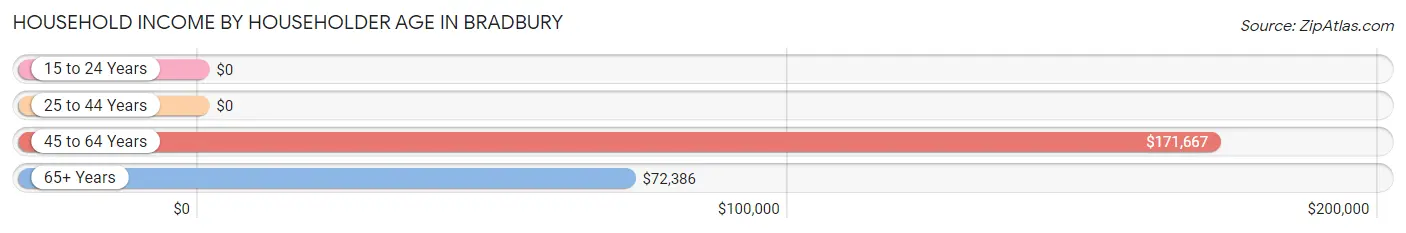
| Income Bracket | # Households | Median Income |
| 15 to 24 Years | 2 (0.7%) | $0 |
| 25 to 44 Years | 58 (20.9%) | $0 |
| 45 to 64 Years | 148 (53.4%) | $171,667 |
| 65+ Years | 69 (24.9%) | $72,386 |
| Total | 277 (100.0%) | $158,438 |
Poverty in Bradbury
Income Below Poverty by Sex and Age in Bradbury
With 1.9% poverty level for males and 9.1% for females among the residents of Bradbury, 12 to 14 year old males and 16 and 17 year old females are the most vulnerable to poverty, with 2 males (12.5%) and 1 females (100.0%) in their respective age groups living below the poverty level.
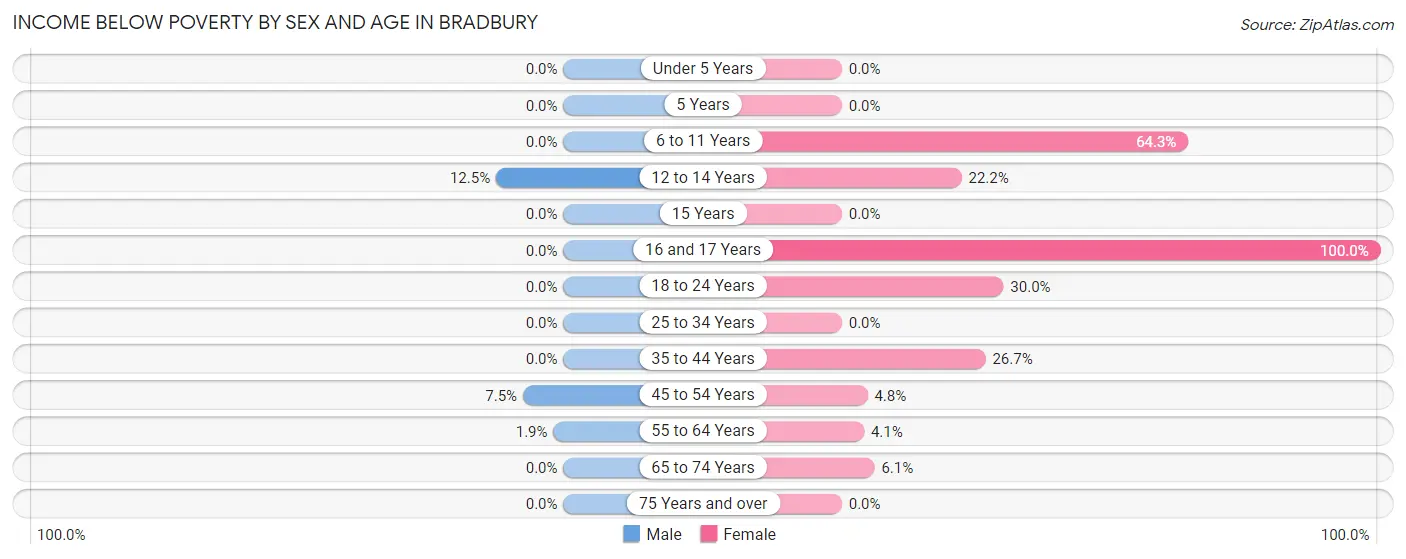
| Age Bracket | Male | Female |
| Under 5 Years | 0 (0.0%) | 0 (0.0%) |
| 5 Years | 0 (0.0%) | 0 (0.0%) |
| 6 to 11 Years | 0 (0.0%) | 9 (64.3%) |
| 12 to 14 Years | 2 (12.5%) | 2 (22.2%) |
| 15 Years | 0 (0.0%) | 0 (0.0%) |
| 16 and 17 Years | 0 (0.0%) | 1 (100.0%) |
| 18 to 24 Years | 0 (0.0%) | 6 (30.0%) |
| 25 to 34 Years | 0 (0.0%) | 0 (0.0%) |
| 35 to 44 Years | 0 (0.0%) | 8 (26.7%) |
| 45 to 54 Years | 3 (7.5%) | 4 (4.8%) |
| 55 to 64 Years | 2 (1.8%) | 4 (4.1%) |
| 65 to 74 Years | 0 (0.0%) | 2 (6.1%) |
| 75 Years and over | 0 (0.0%) | 0 (0.0%) |
| Total | 7 (1.9%) | 36 (9.1%) |
Income Above Poverty by Sex and Age in Bradbury
According to the poverty statistics in Bradbury, males aged under 5 years and females aged under 5 years are the age groups that are most secure financially, with 100.0% of males and 100.0% of females in these age groups living above the poverty line.
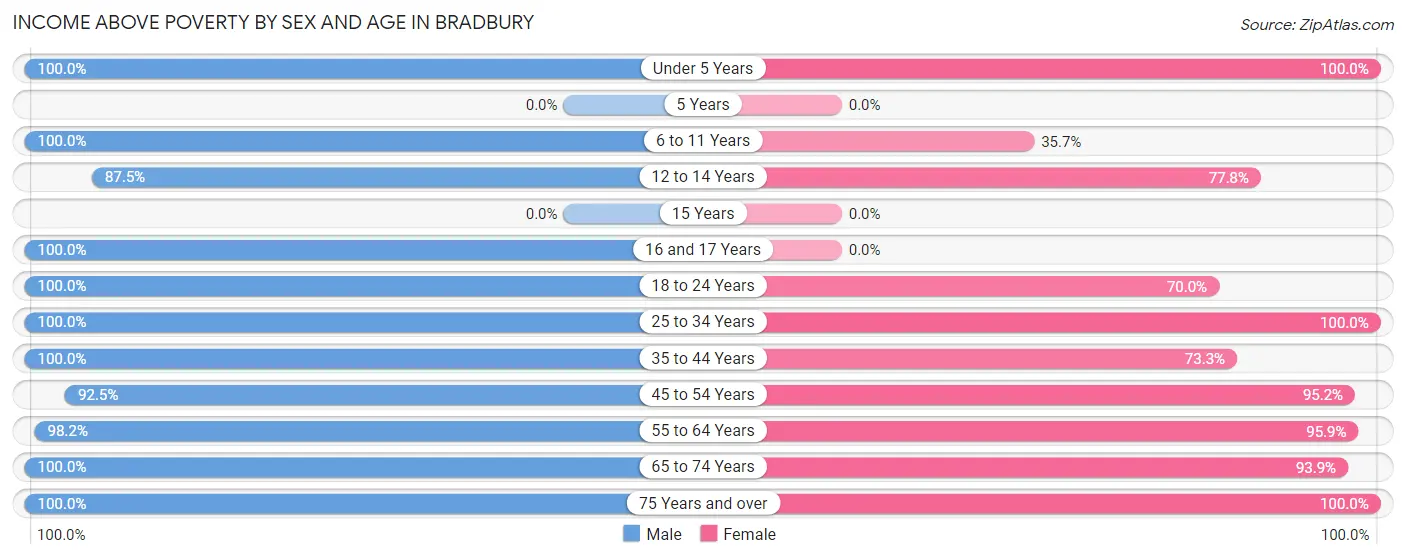
| Age Bracket | Male | Female |
| Under 5 Years | 6 (100.0%) | 22 (100.0%) |
| 5 Years | 0 (0.0%) | 0 (0.0%) |
| 6 to 11 Years | 17 (100.0%) | 5 (35.7%) |
| 12 to 14 Years | 14 (87.5%) | 7 (77.8%) |
| 15 Years | 0 (0.0%) | 0 (0.0%) |
| 16 and 17 Years | 5 (100.0%) | 0 (0.0%) |
| 18 to 24 Years | 43 (100.0%) | 14 (70.0%) |
| 25 to 34 Years | 24 (100.0%) | 40 (100.0%) |
| 35 to 44 Years | 47 (100.0%) | 22 (73.3%) |
| 45 to 54 Years | 37 (92.5%) | 80 (95.2%) |
| 55 to 64 Years | 106 (98.2%) | 93 (95.9%) |
| 65 to 74 Years | 31 (100.0%) | 31 (93.9%) |
| 75 Years and over | 33 (100.0%) | 47 (100.0%) |
| Total | 363 (98.1%) | 361 (90.9%) |
Income Below Poverty Among Married-Couple Families in Bradbury
The poverty statistics for married-couple families in Bradbury show that 2.4% or 5 of the total 207 families live below the poverty line. Families with 1 or 2 children have the highest poverty rate of 10.4%, comprising of 5 families. On the other hand, families with no children have the lowest poverty rate of 0.0%, which includes 0 families.
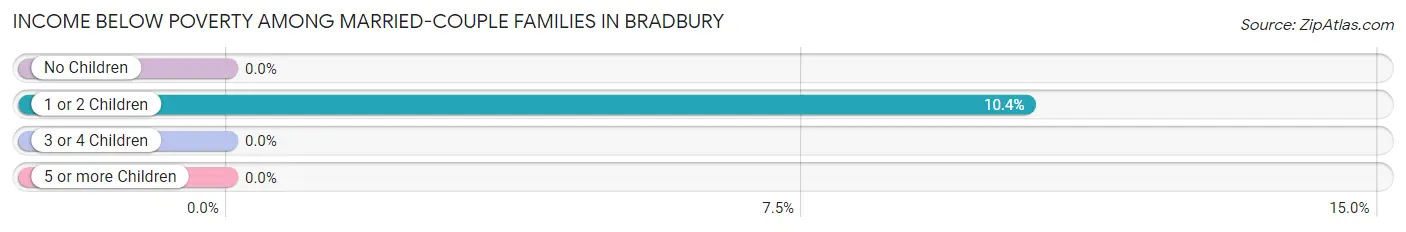
| Children | Above Poverty | Below Poverty |
| No Children | 156 (100.0%) | 0 (0.0%) |
| 1 or 2 Children | 43 (89.6%) | 5 (10.4%) |
| 3 or 4 Children | 3 (100.0%) | 0 (0.0%) |
| 5 or more Children | 0 (0.0%) | 0 (0.0%) |
| Total | 202 (97.6%) | 5 (2.4%) |
Income Below Poverty Among Single-Parent Households in Bradbury
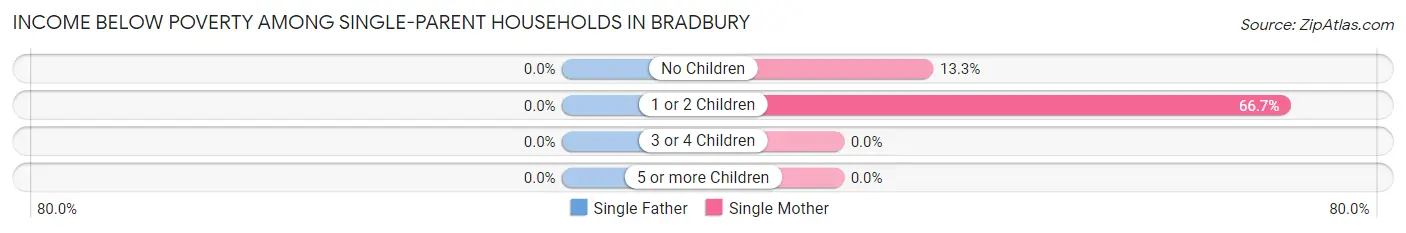
| Children | Single Father | Single Mother |
| No Children | 0 (0.0%) | 2 (13.3%) |
| 1 or 2 Children | 0 (0.0%) | 8 (66.7%) |
| 3 or 4 Children | 0 (0.0%) | 0 (0.0%) |
| 5 or more Children | 0 (0.0%) | 0 (0.0%) |
| Total | 0 (0.0%) | 10 (37.0%) |
Income Below Poverty Among Married-Couple vs Single-Parent Households in Bradbury
The poverty data for Bradbury shows that 5 of the married-couple family households (2.4%) and 10 of the single-parent households (32.3%) are living below the poverty level. Within the married-couple family households, those with 1 or 2 children have the highest poverty rate, with 5 households (10.4%) falling below the poverty line. Among the single-parent households, those with 1 or 2 children have the highest poverty rate, with 8 household (66.7%) living below poverty.
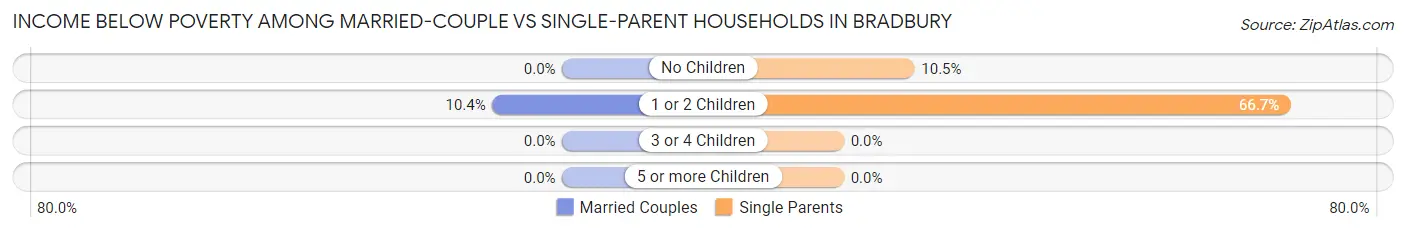
| Children | Married-Couple Families | Single-Parent Households |
| No Children | 0 (0.0%) | 2 (10.5%) |
| 1 or 2 Children | 5 (10.4%) | 8 (66.7%) |
| 3 or 4 Children | 0 (0.0%) | 0 (0.0%) |
| 5 or more Children | 0 (0.0%) | 0 (0.0%) |
| Total | 5 (2.4%) | 10 (32.3%) |
Race in Bradbury
The most populous races in Bradbury are White / Caucasian (397 | 51.8%), Asian (290 | 37.8%), and Hispanic or Latino (126 | 16.4%).
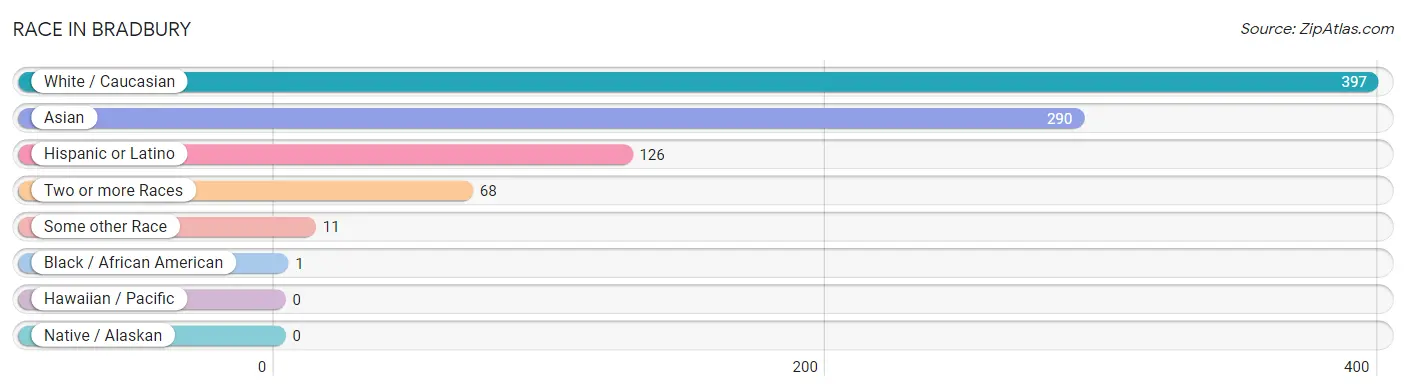
| Race | # Population | % Population |
| Asian | 290 | 37.8% |
| Black / African American | 1 | 0.1% |
| Hawaiian / Pacific | 0 | 0.0% |
| Hispanic or Latino | 126 | 16.4% |
| Native / Alaskan | 0 | 0.0% |
| White / Caucasian | 397 | 51.8% |
| Two or more Races | 68 | 8.9% |
| Some other Race | 11 | 1.4% |
| Total | 767 | 100.0% |
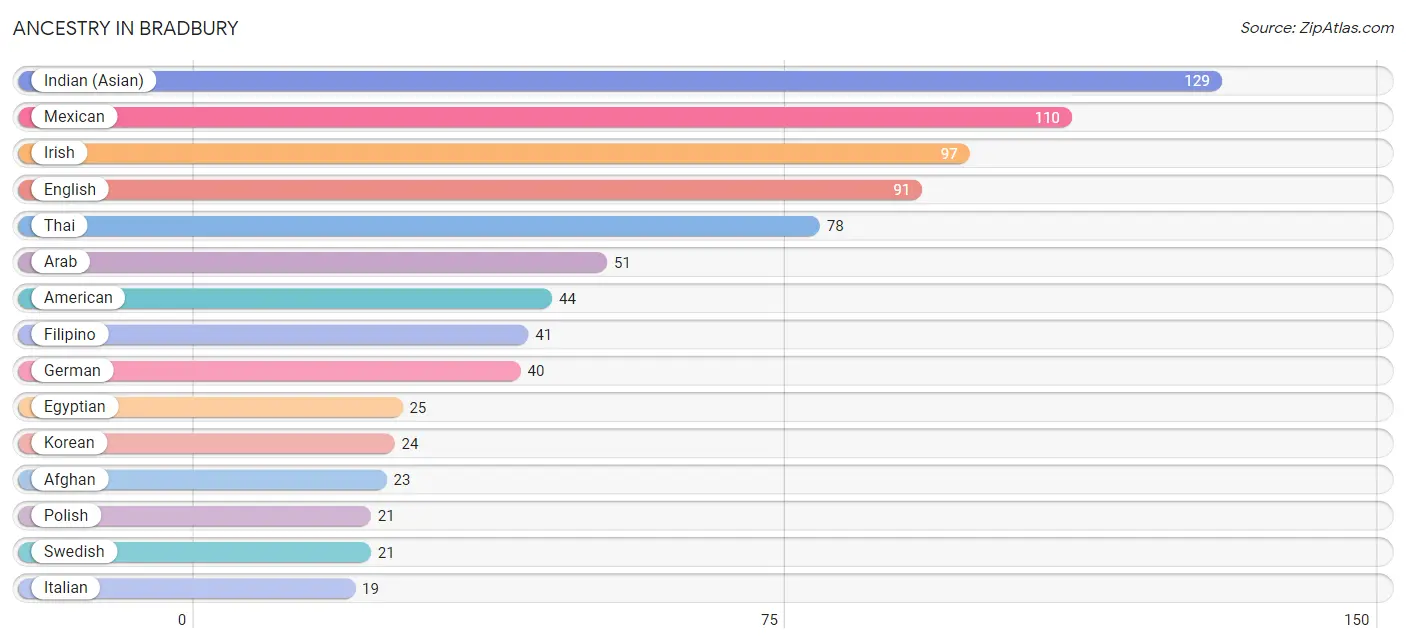
Ancestry in Bradbury
The most populous ancestries reported in Bradbury are Indian (Asian) (129 | 16.8%), Mexican (110 | 14.3%), Irish (97 | 12.7%), English (91 | 11.9%), and Thai (78 | 10.2%), together accounting for 65.8% of all Bradbury residents.
| Ancestry | # Population | % Population |
| Afghan | 23 | 3.0% |
| American | 44 | 5.7% |
| Arab | 51 | 6.7% |
| Austrian | 7 | 0.9% |
| Bhutanese | 6 | 0.8% |
| British | 7 | 0.9% |
| Canadian | 1 | 0.1% |
| Colombian | 4 | 0.5% |
| Croatian | 2 | 0.3% |
| Cuban | 2 | 0.3% |
| Danish | 3 | 0.4% |
| Dutch | 3 | 0.4% |
| Egyptian | 25 | 3.3% |
| English | 91 | 11.9% |
| European | 4 | 0.5% |
| Filipino | 41 | 5.3% |
| French | 6 | 0.8% |
| German | 40 | 5.2% |
| Indian (Asian) | 129 | 16.8% |
| Iranian | 10 | 1.3% |
| Irish | 97 | 12.7% |
| Italian | 19 | 2.5% |
| Korean | 24 | 3.1% |
| Laotian | 14 | 1.8% |
| Mexican | 110 | 14.3% |
| Norwegian | 7 | 0.9% |
| Palestinian | 17 | 2.2% |
| Polish | 21 | 2.7% |
| Puerto Rican | 3 | 0.4% |
| Romanian | 2 | 0.3% |
| Russian | 3 | 0.4% |
| Scandinavian | 2 | 0.3% |
| Scotch-Irish | 4 | 0.5% |
| Scottish | 5 | 0.6% |
| South American | 4 | 0.5% |
| Spanish | 7 | 0.9% |
| Sri Lankan | 10 | 1.3% |
| Swedish | 21 | 2.7% |
| Syrian | 2 | 0.3% |
| Thai | 78 | 10.2% |
| Welsh | 7 | 0.9% |
| Yugoslavian | 9 | 1.2% | View All 42 Rows |
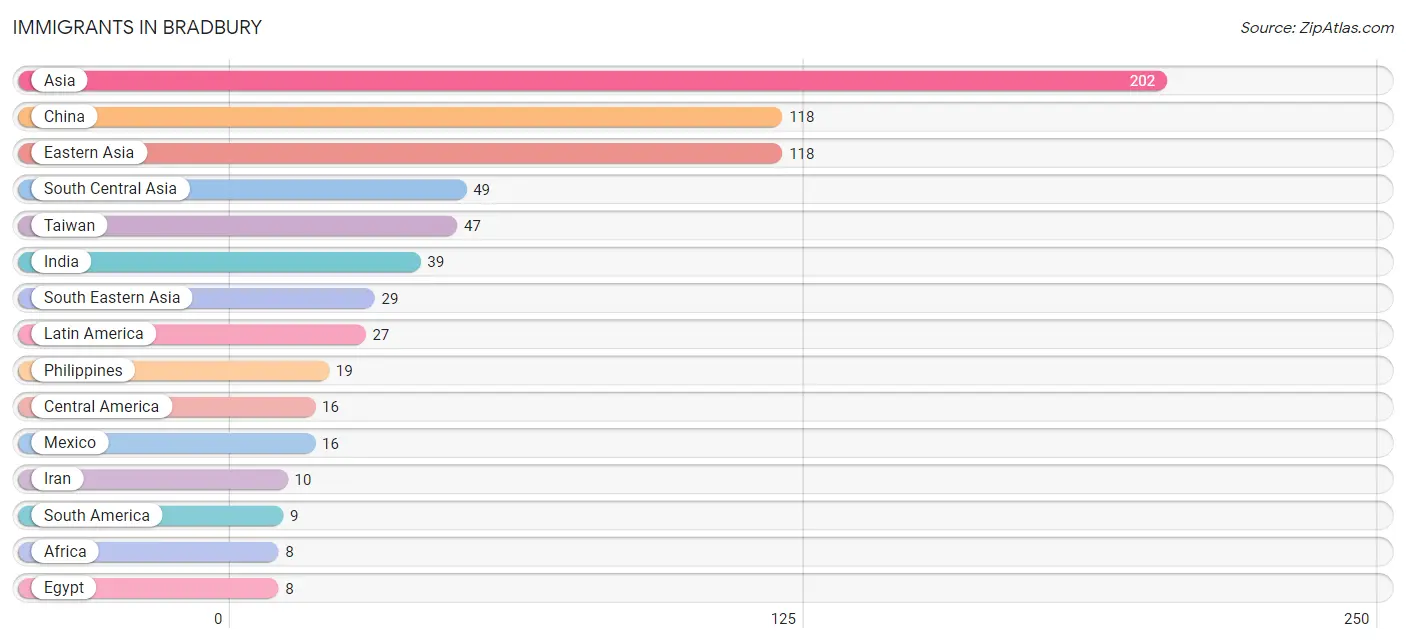
Immigrants in Bradbury
The most numerous immigrant groups reported in Bradbury came from Asia (202 | 26.3%), China (118 | 15.4%), Eastern Asia (118 | 15.4%), South Central Asia (49 | 6.4%), and Taiwan (47 | 6.1%), together accounting for 69.6% of all Bradbury residents.
| Immigration Origin | # Population | % Population |
| Africa | 8 | 1.0% |
| Asia | 202 | 26.3% |
| Canada | 1 | 0.1% |
| Caribbean | 2 | 0.3% |
| Central America | 16 | 2.1% |
| China | 118 | 15.4% |
| Colombia | 5 | 0.6% |
| Cuba | 2 | 0.3% |
| Eastern Asia | 118 | 15.4% |
| Eastern Europe | 3 | 0.4% |
| Egypt | 8 | 1.0% |
| England | 2 | 0.3% |
| Europe | 7 | 0.9% |
| Germany | 2 | 0.3% |
| Hong Kong | 2 | 0.3% |
| India | 39 | 5.1% |
| Iran | 10 | 1.3% |
| Latin America | 27 | 3.5% |
| Mexico | 16 | 2.1% |
| Northern Africa | 8 | 1.0% |
| Northern Europe | 2 | 0.3% |
| Philippines | 19 | 2.5% |
| Russia | 3 | 0.4% |
| South America | 9 | 1.2% |
| South Central Asia | 49 | 6.4% |
| South Eastern Asia | 29 | 3.8% |
| Syria | 2 | 0.3% |
| Taiwan | 47 | 6.1% |
| Vietnam | 7 | 0.9% |
| Western Asia | 2 | 0.3% |
| Western Europe | 2 | 0.3% | View All 31 Rows |
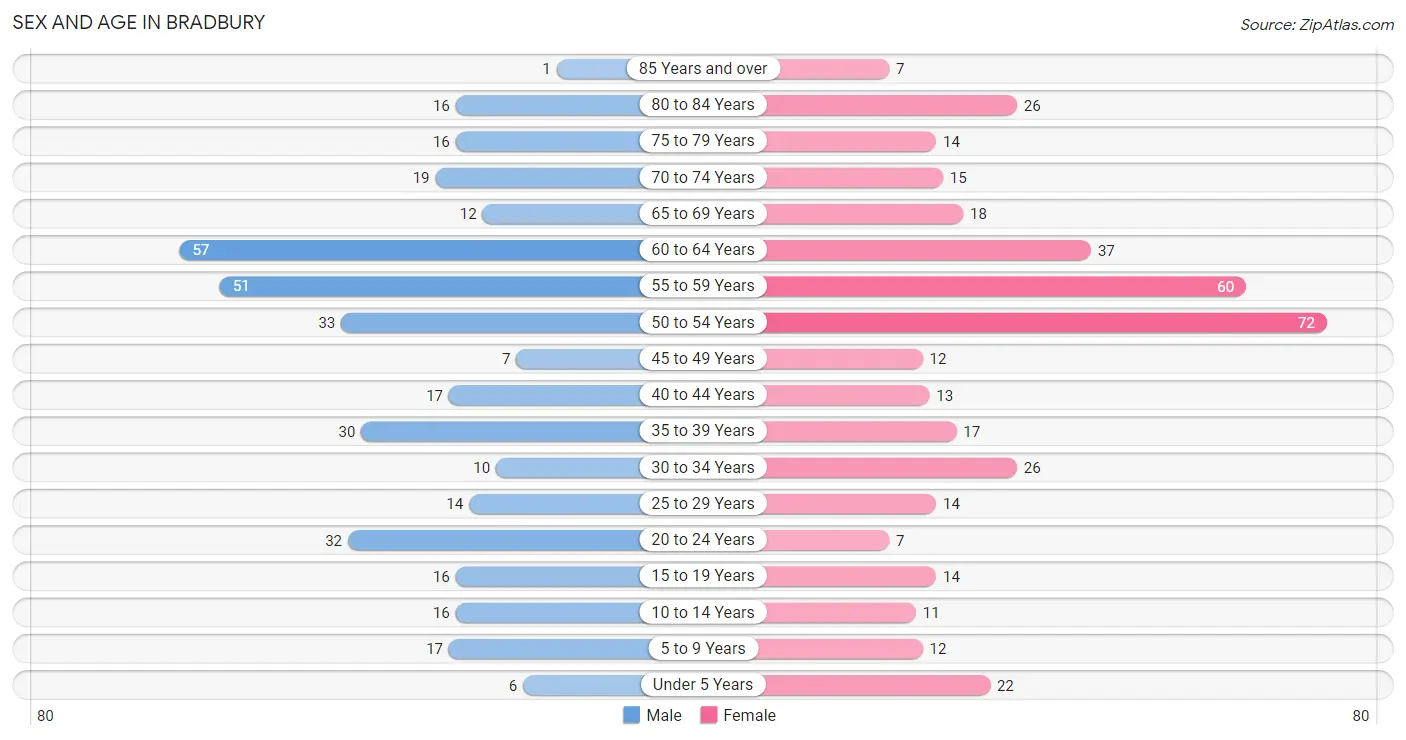
Sex and Age in Bradbury
Sex and Age in Bradbury
The most populous age groups in Bradbury are 60 to 64 Years (57 | 15.4%) for men and 50 to 54 Years (72 | 18.1%) for women.
| Age Bracket | Male | Female |
| Under 5 Years | 6 (1.6%) | 22 (5.5%) |
| 5 to 9 Years | 17 (4.6%) | 12 (3.0%) |
| 10 to 14 Years | 16 (4.3%) | 11 (2.8%) |
| 15 to 19 Years | 16 (4.3%) | 14 (3.5%) |
| 20 to 24 Years | 32 (8.6%) | 7 (1.8%) |
| 25 to 29 Years | 14 (3.8%) | 14 (3.5%) |
| 30 to 34 Years | 10 (2.7%) | 26 (6.6%) |
| 35 to 39 Years | 30 (8.1%) | 17 (4.3%) |
| 40 to 44 Years | 17 (4.6%) | 13 (3.3%) |
| 45 to 49 Years | 7 (1.9%) | 12 (3.0%) |
| 50 to 54 Years | 33 (8.9%) | 72 (18.1%) |
| 55 to 59 Years | 51 (13.8%) | 60 (15.1%) |
| 60 to 64 Years | 57 (15.4%) | 37 (9.3%) |
| 65 to 69 Years | 12 (3.2%) | 18 (4.5%) |
| 70 to 74 Years | 19 (5.1%) | 15 (3.8%) |
| 75 to 79 Years | 16 (4.3%) | 14 (3.5%) |
| 80 to 84 Years | 16 (4.3%) | 26 (6.6%) |
| 85 Years and over | 1 (0.3%) | 7 (1.8%) |
| Total | 370 (100.0%) | 397 (100.0%) |
Families and Households in Bradbury
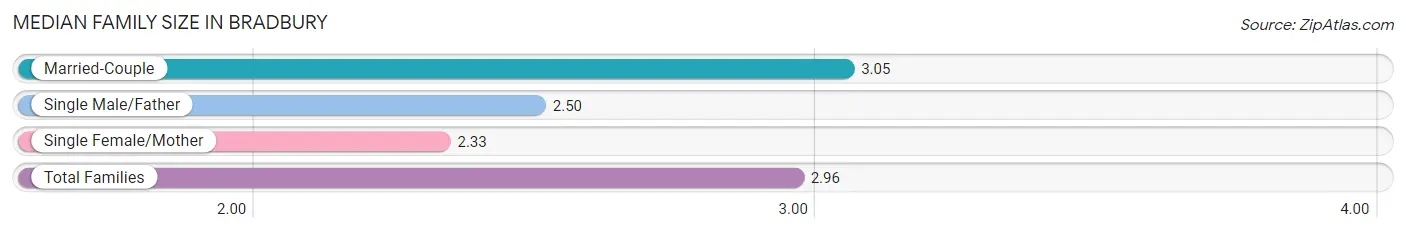
Median Family Size in Bradbury
The median family size in Bradbury is 2.96 persons per family, with married-couple families (207 | 87.0%) accounting for the largest median family size of 3.05 persons per family. On the other hand, single female/mother families (27 | 11.3%) represent the smallest median family size with 2.33 persons per family.
| Family Type | # Families | Family Size |
| Married-Couple | 207 (87.0%) | 3.05 |
| Single Male/Father | 4 (1.7%) | 2.50 |
| Single Female/Mother | 27 (11.3%) | 2.33 |
| Total Families | 238 (100.0%) | 2.96 |
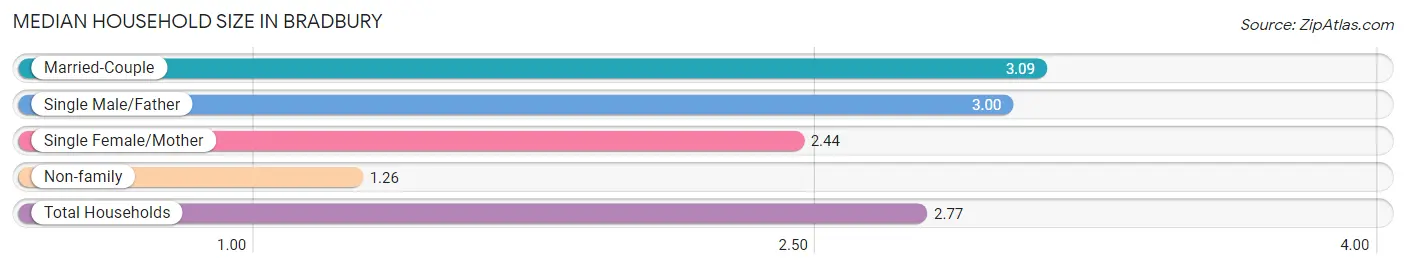
Median Household Size in Bradbury
The median household size in Bradbury is 2.77 persons per household, with married-couple households (207 | 74.7%) accounting for the largest median household size of 3.09 persons per household. non-family households (39 | 14.1%) represent the smallest median household size with 1.26 persons per household.
| Household Type | # Households | Household Size |
| Married-Couple | 207 (74.7%) | 3.09 |
| Single Male/Father | 4 (1.4%) | 3.00 |
| Single Female/Mother | 27 (9.8%) | 2.44 |
| Non-family | 39 (14.1%) | 1.26 |
| Total Households | 277 (100.0%) | 2.77 |
Household Size by Marriage Status in Bradbury
Out of a total of 277 households in Bradbury, 238 (85.9%) are family households, while 39 (14.1%) are nonfamily households. The most numerous type of family households are 2-person households, comprising 123, and the most common type of nonfamily households are 1-person households, comprising 30.
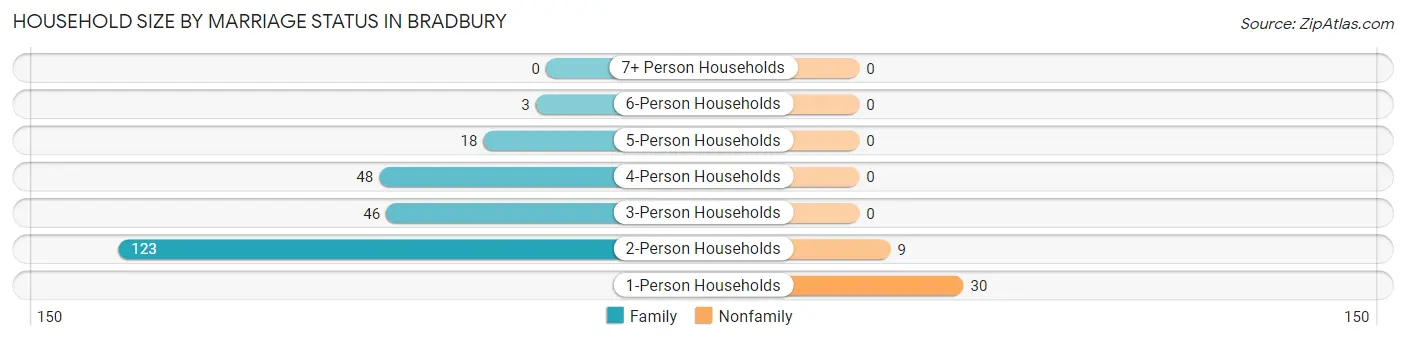
| Household Size | Family Households | Nonfamily Households |
| 1-Person Households | - | 30 (10.8%) |
| 2-Person Households | 123 (44.4%) | 9 (3.3%) |
| 3-Person Households | 46 (16.6%) | 0 (0.0%) |
| 4-Person Households | 48 (17.3%) | 0 (0.0%) |
| 5-Person Households | 18 (6.5%) | 0 (0.0%) |
| 6-Person Households | 3 (1.1%) | 0 (0.0%) |
| 7+ Person Households | 0 (0.0%) | 0 (0.0%) |
| Total | 238 (85.9%) | 39 (14.1%) |
Female Fertility in Bradbury
Fertility by Age in Bradbury
| Age Bracket | Women with Births | Births / 1,000 Women |
| 15 to 19 years | 0 (0.0%) | 0.0 |
| 20 to 34 years | 0 (0.0%) | 0.0 |
| 35 to 50 years | 0 (0.0%) | 0.0 |
| Total | 0 (0.0%) | 0.0 |
Fertility by Age by Marriage Status in Bradbury
| Age Bracket | Married | Unmarried |
| 15 to 19 years | 0 (0.0%) | 0 (0.0%) |
| 20 to 34 years | 0 (0.0%) | 0 (0.0%) |
| 35 to 50 years | 0 (0.0%) | 0 (0.0%) |
| Total | 0 (0.0%) | 0 (0.0%) |
Fertility by Education in Bradbury
| Educational Attainment | Women with Births | Births / 1,000 Women |
| Less than High School | 0 (0.0%) | 0.0 |
| High School Diploma | 0 (0.0%) | 0.0 |
| College or Associate's Degree | 0 (0.0%) | 0.0 |
| Bachelor's Degree | 0 (0.0%) | 0.0 |
| Graduate Degree | 0 (0.0%) | 0.0 |
| Total | 0 (0.0%) | 0.0 |
Fertility by Education by Marriage Status in Bradbury
| Educational Attainment | Married | Unmarried |
| Less than High School | 0 (0.0%) | 0 (0.0%) |
| High School Diploma | 0 (0.0%) | 0 (0.0%) |
| College or Associate's Degree | 0 (0.0%) | 0 (0.0%) |
| Bachelor's Degree | 0 (0.0%) | 0 (0.0%) |
| Graduate Degree | 0 (0.0%) | 0 (0.0%) |
| Total | 0 (0.0%) | 0 (0.0%) |
Employment Characteristics in Bradbury
Employment by Class of Employer in Bradbury
Among the 366 employed individuals in Bradbury, private company employees (234 | 63.9%), self-employed (incorporated) (47 | 12.8%), and not-for-profit organizations (45 | 12.3%) make up the most common classes of employment.
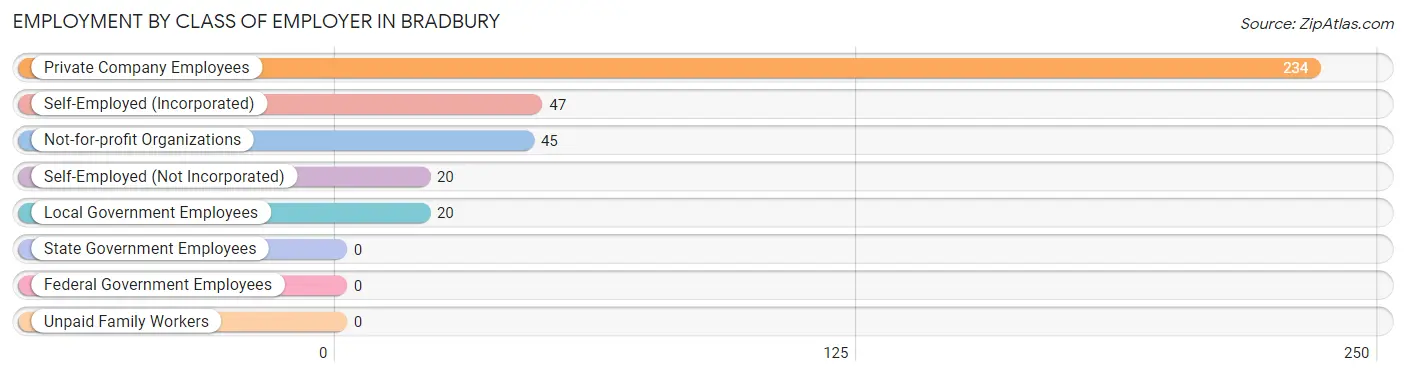
| Employer Class | # Employees | % Employees |
| Private Company Employees | 234 | 63.9% |
| Self-Employed (Incorporated) | 47 | 12.8% |
| Self-Employed (Not Incorporated) | 20 | 5.5% |
| Not-for-profit Organizations | 45 | 12.3% |
| Local Government Employees | 20 | 5.5% |
| State Government Employees | 0 | 0.0% |
| Federal Government Employees | 0 | 0.0% |
| Unpaid Family Workers | 0 | 0.0% |
| Total | 366 | 100.0% |
Employment Status by Age in Bradbury
According to the labor force statistics for Bradbury, out of the total population over 16 years of age (683), 59.9% or 409 individuals are in the labor force, with 7.3% or 30 of them unemployed. The age group with the highest labor force participation rate is 25 to 29 years, with 92.9% or 26 individuals in the labor force. Within the labor force, the 16 to 19 years age range has the highest percentage of unemployed individuals, with 40.0% or 2 of them being unemployed.
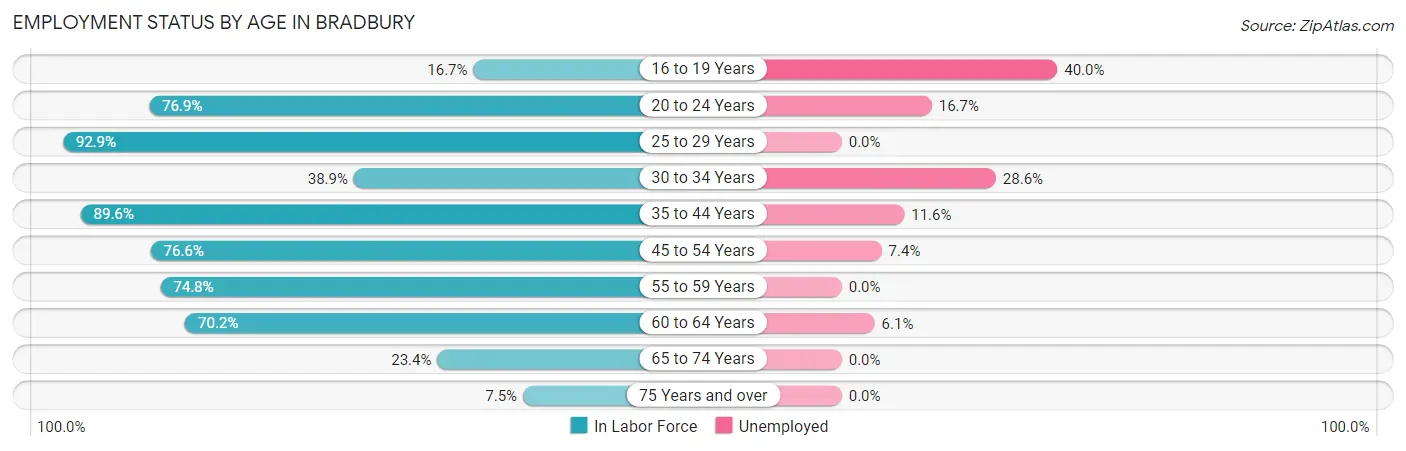
| Age Bracket | In Labor Force | Unemployed |
| 16 to 19 Years | 5 (16.7%) | 2 (40.0%) |
| 20 to 24 Years | 30 (76.9%) | 5 (16.7%) |
| 25 to 29 Years | 26 (92.9%) | 0 (0.0%) |
| 30 to 34 Years | 14 (38.9%) | 4 (28.6%) |
| 35 to 44 Years | 69 (89.6%) | 8 (11.6%) |
| 45 to 54 Years | 95 (76.6%) | 7 (7.4%) |
| 55 to 59 Years | 83 (74.8%) | 0 (0.0%) |
| 60 to 64 Years | 66 (70.2%) | 4 (6.1%) |
| 65 to 74 Years | 15 (23.4%) | 0 (0.0%) |
| 75 Years and over | 6 (7.5%) | 0 (0.0%) |
| Total | 409 (59.9%) | 30 (7.3%) |
Employment Status by Educational Attainment in Bradbury
According to labor force statistics for Bradbury, 75.1% of individuals (353) out of the total population between 25 and 64 years of age (470) are in the labor force, with 6.5% or 23 of them being unemployed. The group with the highest labor force participation rate are those with the educational attainment of less than high school, with 93.8% or 30 individuals in the labor force. Within the labor force, individuals with high school diploma education have the highest percentage of unemployment, with 9.8% or 4 of them being unemployed.
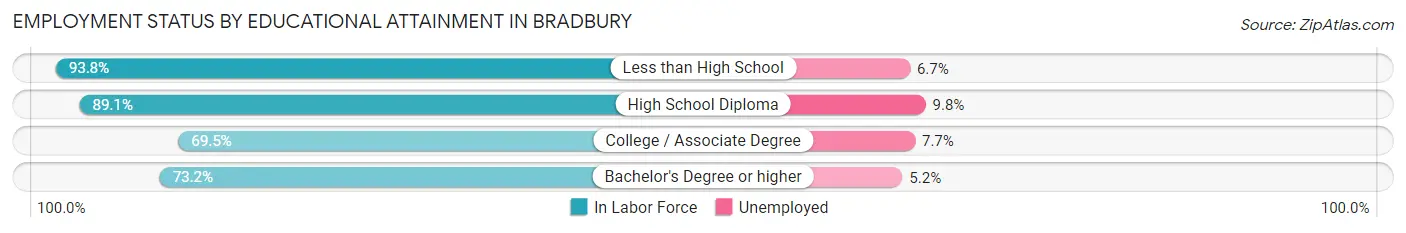
| Educational Attainment | In Labor Force | Unemployed |
| Less than High School | 30 (93.8%) | 2 (6.7%) |
| High School Diploma | 41 (89.1%) | 5 (9.8%) |
| College / Associate Degree | 91 (69.5%) | 10 (7.7%) |
| Bachelor's Degree or higher | 191 (73.2%) | 14 (5.2%) |
| Total | 353 (75.1%) | 31 (6.5%) |
Employment Occupations by Sex in Bradbury
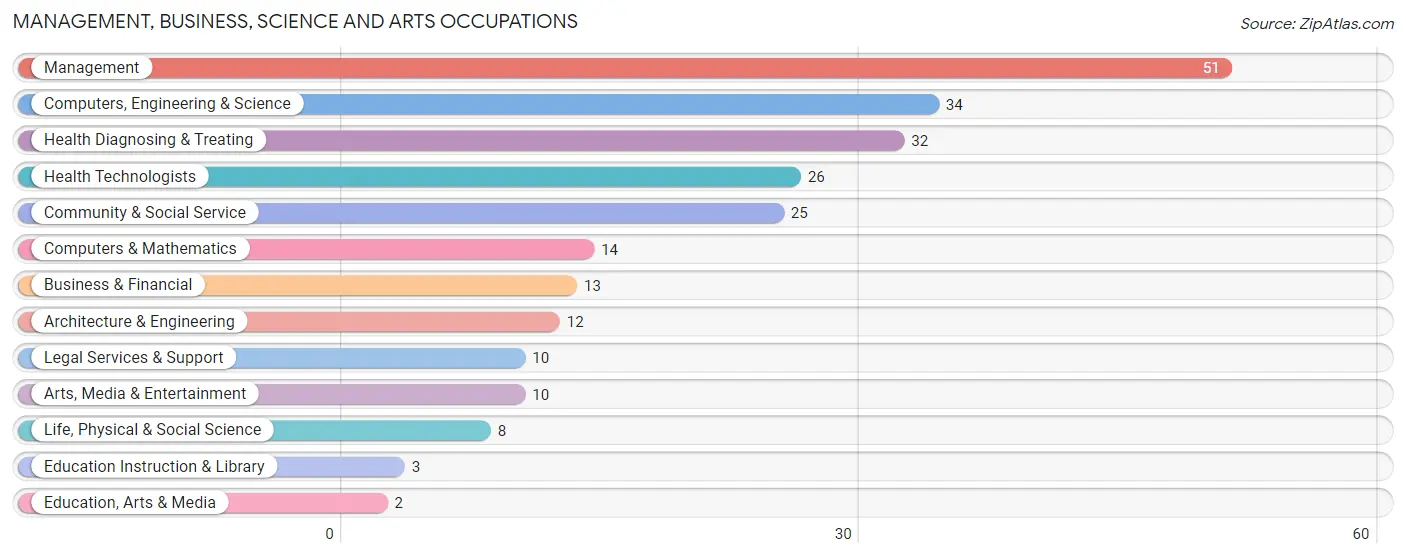
Management, Business, Science and Arts Occupations
The most common Management, Business, Science and Arts occupations in Bradbury are Management (51 | 13.5%), Computers, Engineering & Science (34 | 9.0%), Health Diagnosing & Treating (32 | 8.4%), Health Technologists (26 | 6.9%), and Community & Social Service (25 | 6.6%).
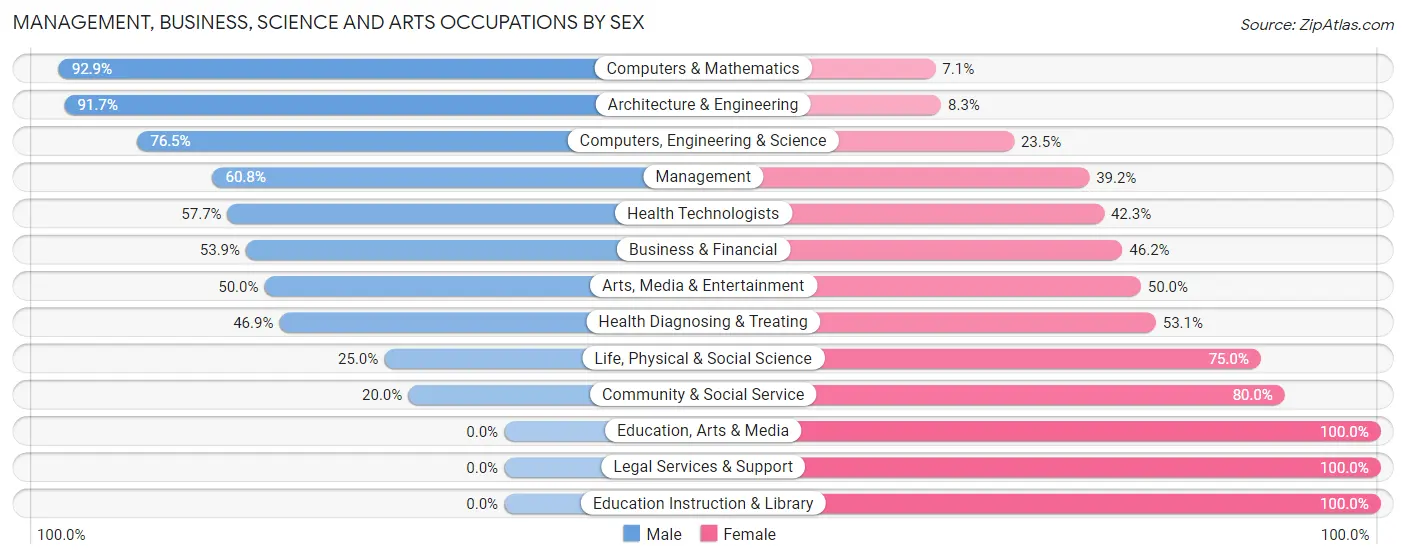
Management, Business, Science and Arts Occupations by Sex
Within the Management, Business, Science and Arts occupations in Bradbury, the most male-oriented occupations are Computers & Mathematics (92.9%), Architecture & Engineering (91.7%), and Computers, Engineering & Science (76.5%), while the most female-oriented occupations are Education, Arts & Media (100.0%), Legal Services & Support (100.0%), and Education Instruction & Library (100.0%).
| Occupation | Male | Female |
| Management | 31 (60.8%) | 20 (39.2%) |
| Business & Financial | 7 (53.8%) | 6 (46.2%) |
| Computers, Engineering & Science | 26 (76.5%) | 8 (23.5%) |
| Computers & Mathematics | 13 (92.9%) | 1 (7.1%) |
| Architecture & Engineering | 11 (91.7%) | 1 (8.3%) |
| Life, Physical & Social Science | 2 (25.0%) | 6 (75.0%) |
| Community & Social Service | 5 (20.0%) | 20 (80.0%) |
| Education, Arts & Media | 0 (0.0%) | 2 (100.0%) |
| Legal Services & Support | 0 (0.0%) | 10 (100.0%) |
| Education Instruction & Library | 0 (0.0%) | 3 (100.0%) |
| Arts, Media & Entertainment | 5 (50.0%) | 5 (50.0%) |
| Health Diagnosing & Treating | 15 (46.9%) | 17 (53.1%) |
| Health Technologists | 15 (57.7%) | 11 (42.3%) |
| Total (Category) | 84 (54.2%) | 71 (45.8%) |
| Total (Overall) | 225 (59.4%) | 154 (40.6%) |
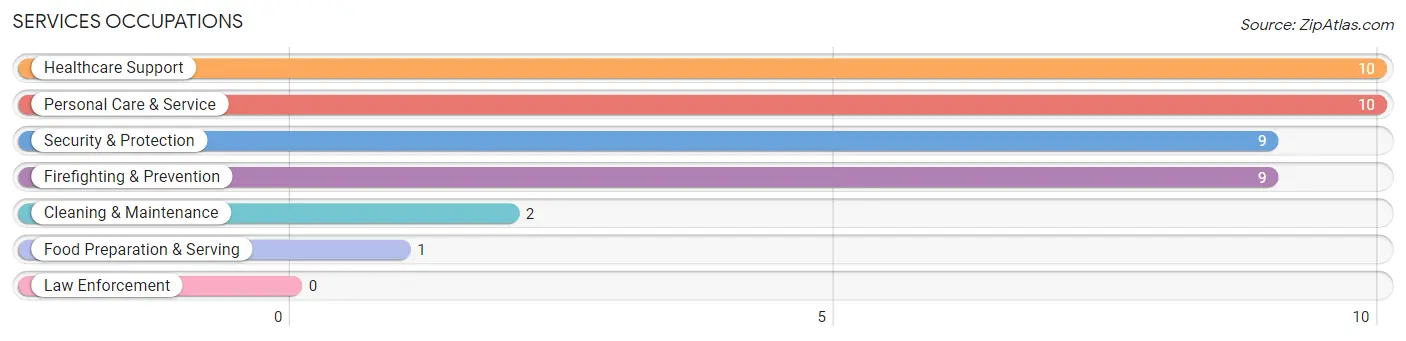
Services Occupations
The most common Services occupations in Bradbury are Healthcare Support (10 | 2.6%), Personal Care & Service (10 | 2.6%), Security & Protection (9 | 2.4%), Firefighting & Prevention (9 | 2.4%), and Cleaning & Maintenance (2 | 0.5%).
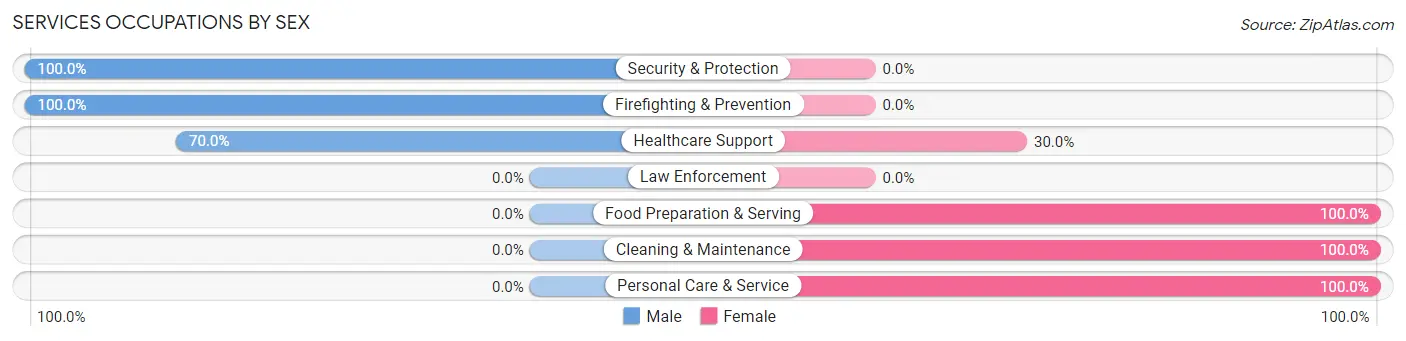
Services Occupations by Sex
Within the Services occupations in Bradbury, the most male-oriented occupations are Security & Protection (100.0%), Firefighting & Prevention (100.0%), and Healthcare Support (70.0%), while the most female-oriented occupations are Food Preparation & Serving (100.0%), Cleaning & Maintenance (100.0%), and Personal Care & Service (100.0%).
| Occupation | Male | Female |
| Healthcare Support | 7 (70.0%) | 3 (30.0%) |
| Security & Protection | 9 (100.0%) | 0 (0.0%) |
| Firefighting & Prevention | 9 (100.0%) | 0 (0.0%) |
| Law Enforcement | 0 (0.0%) | 0 (0.0%) |
| Food Preparation & Serving | 0 (0.0%) | 1 (100.0%) |
| Cleaning & Maintenance | 0 (0.0%) | 2 (100.0%) |
| Personal Care & Service | 0 (0.0%) | 10 (100.0%) |
| Total (Category) | 16 (50.0%) | 16 (50.0%) |
| Total (Overall) | 225 (59.4%) | 154 (40.6%) |
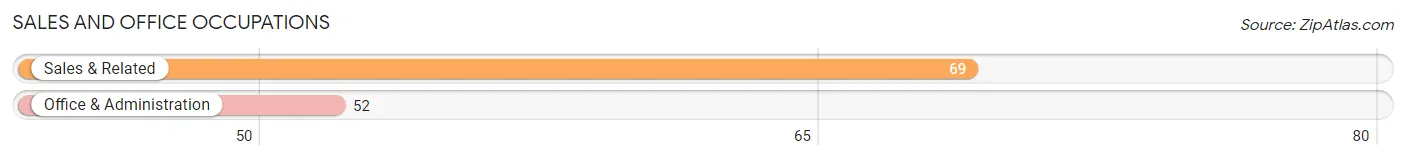
Sales and Office Occupations
The most common Sales and Office occupations in Bradbury are Sales & Related (69 | 18.2%), and Office & Administration (52 | 13.7%).
Sales and Office Occupations by Sex
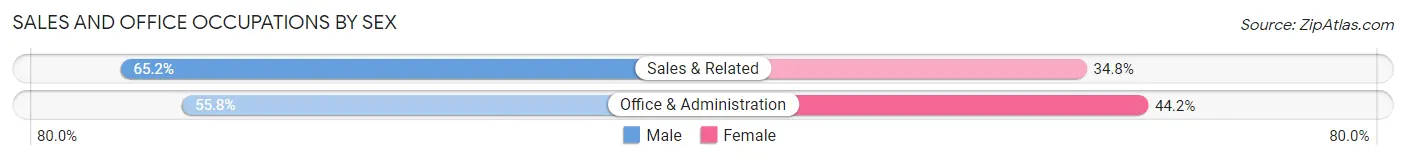
| Occupation | Male | Female |
| Sales & Related | 45 (65.2%) | 24 (34.8%) |
| Office & Administration | 29 (55.8%) | 23 (44.2%) |
| Total (Category) | 74 (61.2%) | 47 (38.8%) |
| Total (Overall) | 225 (59.4%) | 154 (40.6%) |
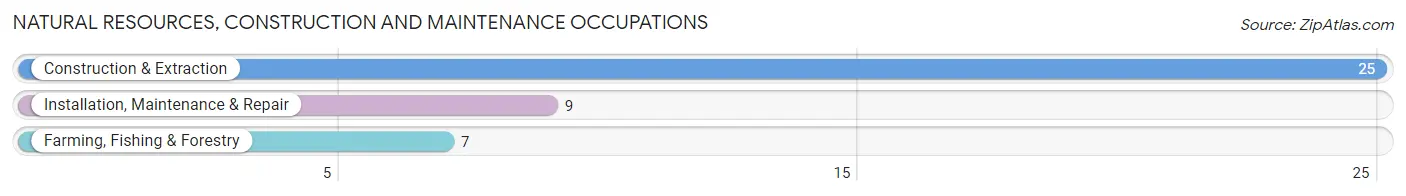
Natural Resources, Construction and Maintenance Occupations
The most common Natural Resources, Construction and Maintenance occupations in Bradbury are Construction & Extraction (25 | 6.6%), Installation, Maintenance & Repair (9 | 2.4%), and Farming, Fishing & Forestry (7 | 1.8%).
Natural Resources, Construction and Maintenance Occupations by Sex
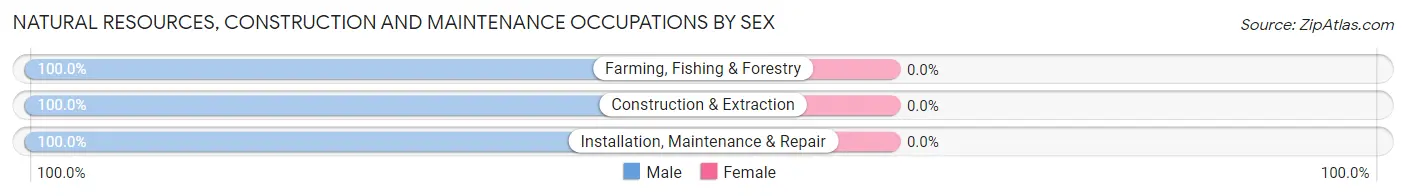
| Occupation | Male | Female |
| Farming, Fishing & Forestry | 7 (100.0%) | 0 (0.0%) |
| Construction & Extraction | 25 (100.0%) | 0 (0.0%) |
| Installation, Maintenance & Repair | 9 (100.0%) | 0 (0.0%) |
| Total (Category) | 41 (100.0%) | 0 (0.0%) |
| Total (Overall) | 225 (59.4%) | 154 (40.6%) |
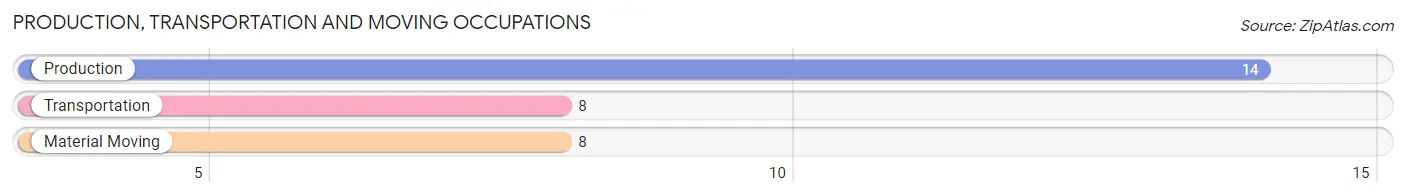
Production, Transportation and Moving Occupations
The most common Production, Transportation and Moving occupations in Bradbury are Production (14 | 3.7%), Transportation (8 | 2.1%), and Material Moving (8 | 2.1%).
Production, Transportation and Moving Occupations by Sex
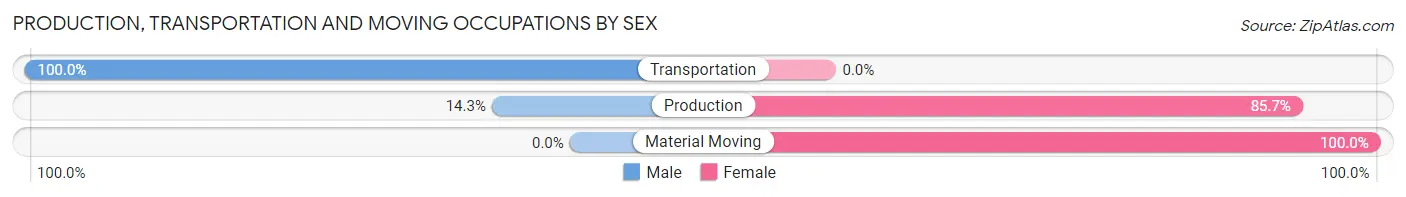
| Occupation | Male | Female |
| Production | 2 (14.3%) | 12 (85.7%) |
| Transportation | 8 (100.0%) | 0 (0.0%) |
| Material Moving | 0 (0.0%) | 8 (100.0%) |
| Total (Category) | 10 (33.3%) | 20 (66.7%) |
| Total (Overall) | 225 (59.4%) | 154 (40.6%) |
Employment Industries by Sex in Bradbury
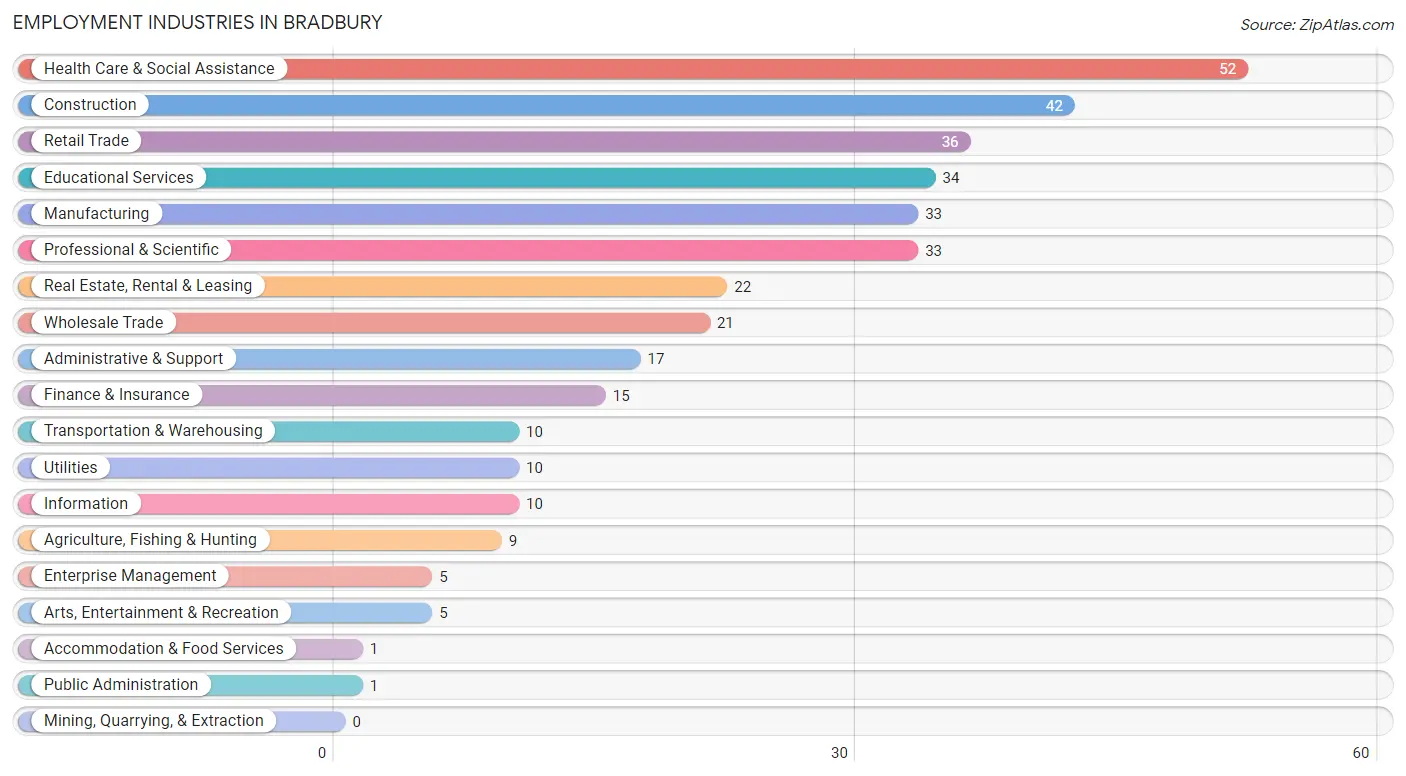
Employment Industries in Bradbury
The major employment industries in Bradbury include Health Care & Social Assistance (52 | 13.7%), Construction (42 | 11.1%), Retail Trade (36 | 9.5%), Educational Services (34 | 9.0%), and Manufacturing (33 | 8.7%).
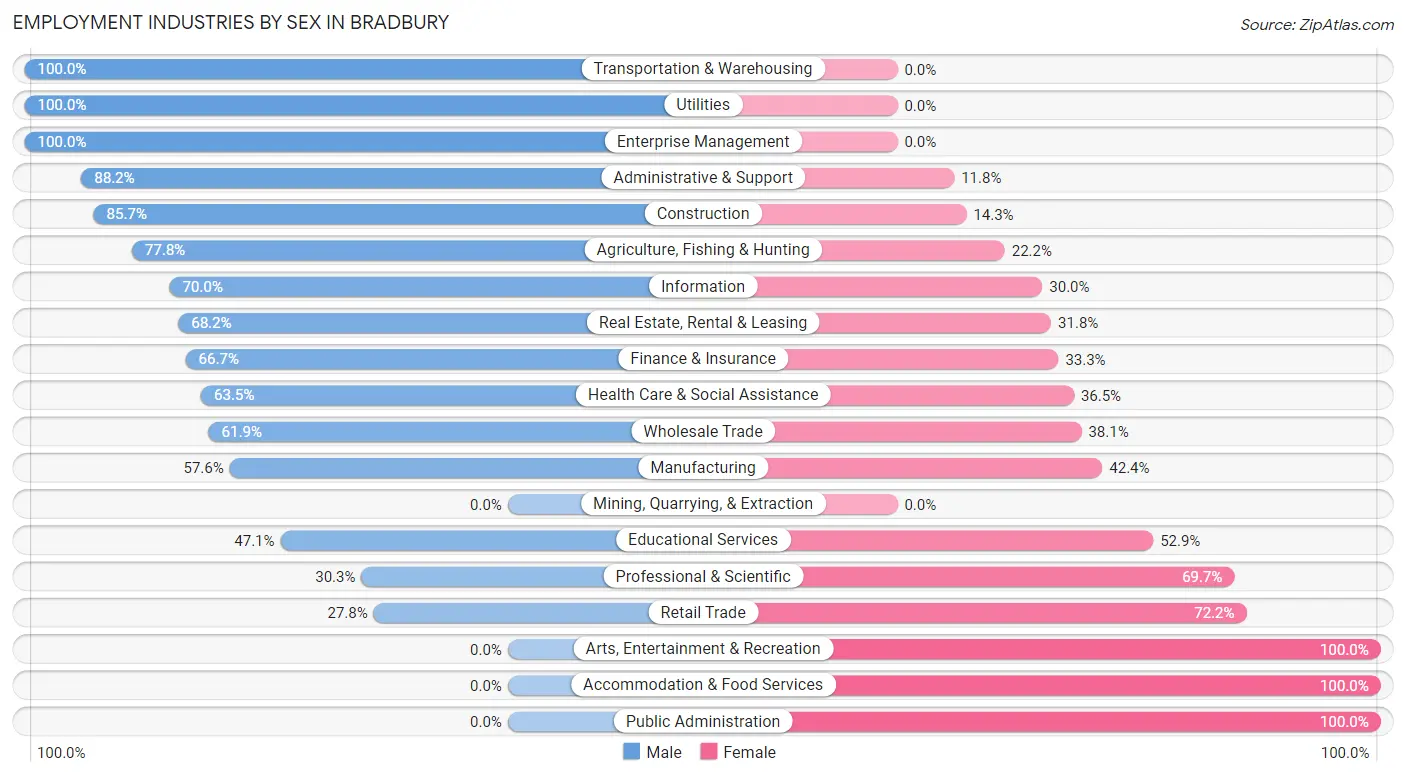
Employment Industries by Sex in Bradbury
The Bradbury industries that see more men than women are Transportation & Warehousing (100.0%), Utilities (100.0%), and Enterprise Management (100.0%), whereas the industries that tend to have a higher number of women are Arts, Entertainment & Recreation (100.0%), Accommodation & Food Services (100.0%), and Public Administration (100.0%).
| Industry | Male | Female |
| Agriculture, Fishing & Hunting | 7 (77.8%) | 2 (22.2%) |
| Mining, Quarrying, & Extraction | 0 (0.0%) | 0 (0.0%) |
| Construction | 36 (85.7%) | 6 (14.3%) |
| Manufacturing | 19 (57.6%) | 14 (42.4%) |
| Wholesale Trade | 13 (61.9%) | 8 (38.1%) |
| Retail Trade | 10 (27.8%) | 26 (72.2%) |
| Transportation & Warehousing | 10 (100.0%) | 0 (0.0%) |
| Utilities | 10 (100.0%) | 0 (0.0%) |
| Information | 7 (70.0%) | 3 (30.0%) |
| Finance & Insurance | 10 (66.7%) | 5 (33.3%) |
| Real Estate, Rental & Leasing | 15 (68.2%) | 7 (31.8%) |
| Professional & Scientific | 10 (30.3%) | 23 (69.7%) |
| Enterprise Management | 5 (100.0%) | 0 (0.0%) |
| Administrative & Support | 15 (88.2%) | 2 (11.8%) |
| Educational Services | 16 (47.1%) | 18 (52.9%) |
| Health Care & Social Assistance | 33 (63.5%) | 19 (36.5%) |
| Arts, Entertainment & Recreation | 0 (0.0%) | 5 (100.0%) |
| Accommodation & Food Services | 0 (0.0%) | 1 (100.0%) |
| Public Administration | 0 (0.0%) | 1 (100.0%) |
| Total | 225 (59.4%) | 154 (40.6%) |
Education in Bradbury
School Enrollment in Bradbury
The most common levels of schooling among the 108 students in Bradbury are college / undergraduate (33 | 30.6%), middle school (24 | 22.2%), and elementary school (20 | 18.5%).
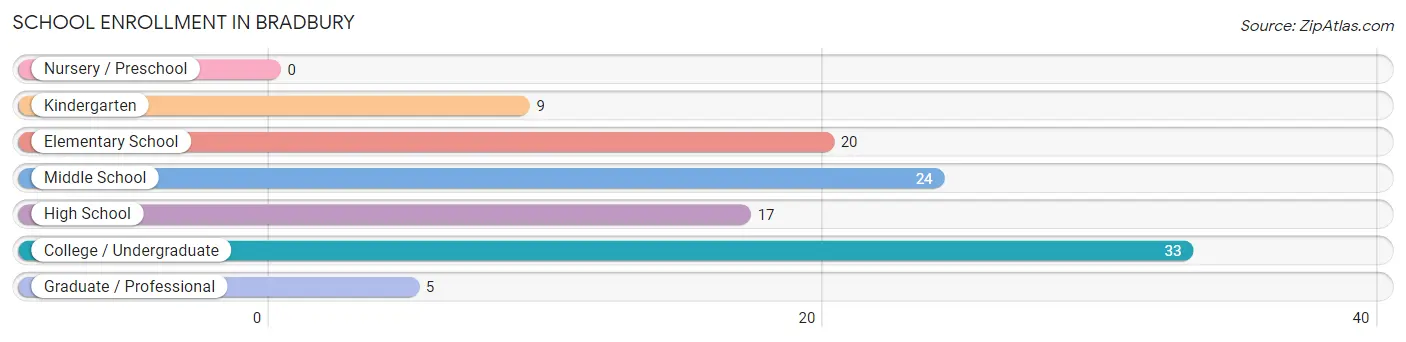
| School Level | # Students | % Students |
| Nursery / Preschool | 0 | 0.0% |
| Kindergarten | 9 | 8.3% |
| Elementary School | 20 | 18.5% |
| Middle School | 24 | 22.2% |
| High School | 17 | 15.7% |
| College / Undergraduate | 33 | 30.6% |
| Graduate / Professional | 5 | 4.6% |
| Total | 108 | 100.0% |
School Enrollment by Age by Funding Source in Bradbury
Out of a total of 108 students who are enrolled in schools in Bradbury, 40 (37.0%) attend a private institution, while the remaining 68 (63.0%) are enrolled in public schools. The age group of 20 to 24 year olds has the highest likelihood of being enrolled in private schools, with 10 (58.8% in the age bracket) enrolled. Conversely, the age group of 18 to 19 year olds has the lowest likelihood of being enrolled in a private school, with 12 (85.7% in the age bracket) attending a public institution.
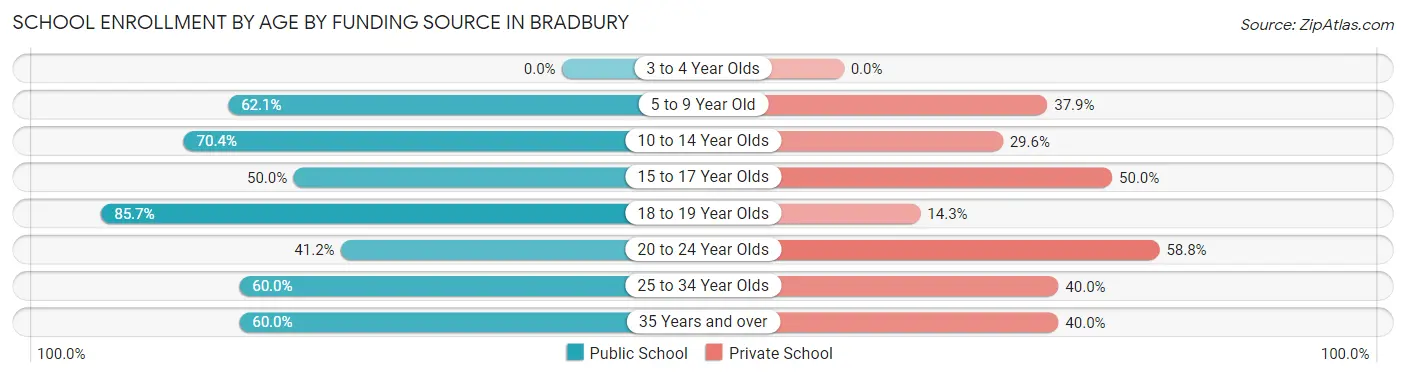
| Age Bracket | Public School | Private School |
| 3 to 4 Year Olds | 0 (0.0%) | 0 (0.0%) |
| 5 to 9 Year Old | 18 (62.1%) | 11 (37.9%) |
| 10 to 14 Year Olds | 19 (70.4%) | 8 (29.6%) |
| 15 to 17 Year Olds | 3 (50.0%) | 3 (50.0%) |
| 18 to 19 Year Olds | 12 (85.7%) | 2 (14.3%) |
| 20 to 24 Year Olds | 7 (41.2%) | 10 (58.8%) |
| 25 to 34 Year Olds | 3 (60.0%) | 2 (40.0%) |
| 35 Years and over | 6 (60.0%) | 4 (40.0%) |
| Total | 68 (63.0%) | 40 (37.0%) |
Educational Attainment by Field of Study in Bradbury
Business (76 | 22.3%), science & technology (50 | 14.7%), engineering (44 | 12.9%), bio, nature & agricultural (33 | 9.7%), and social sciences (33 | 9.7%) are the most common fields of study among 341 individuals in Bradbury who have obtained a bachelor's degree or higher.
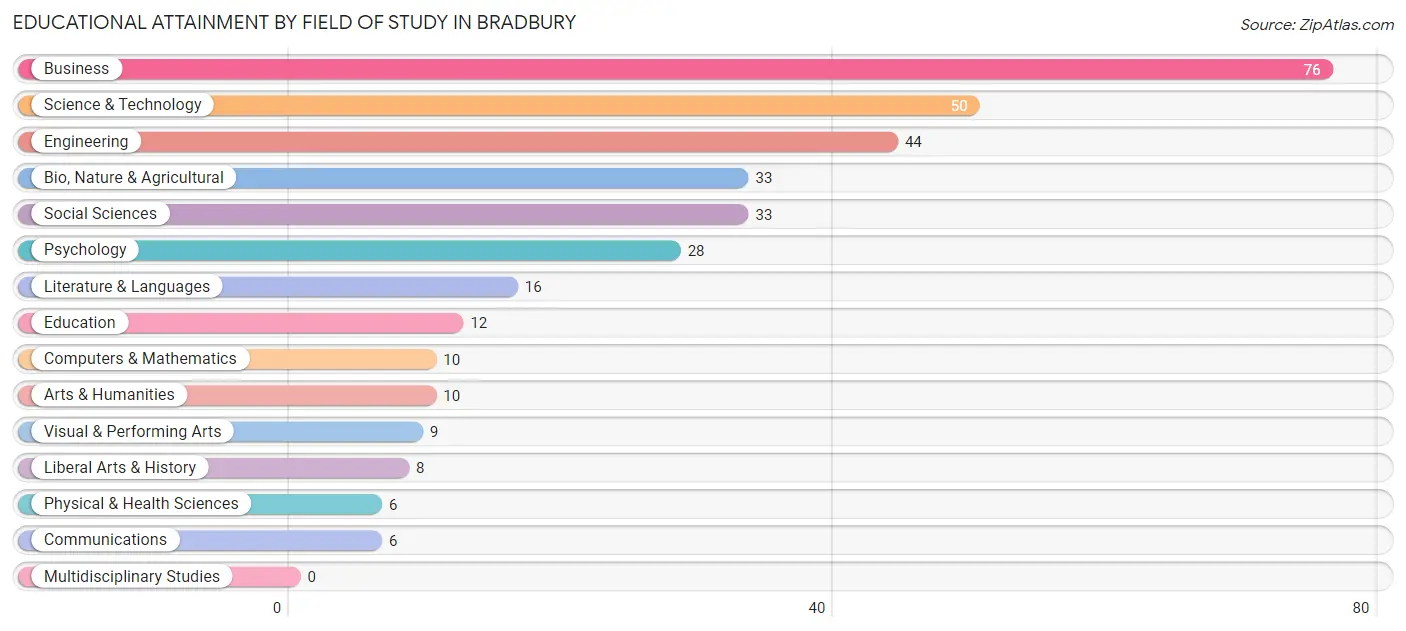
| Field of Study | # Graduates | % Graduates |
| Computers & Mathematics | 10 | 2.9% |
| Bio, Nature & Agricultural | 33 | 9.7% |
| Physical & Health Sciences | 6 | 1.8% |
| Psychology | 28 | 8.2% |
| Social Sciences | 33 | 9.7% |
| Engineering | 44 | 12.9% |
| Multidisciplinary Studies | 0 | 0.0% |
| Science & Technology | 50 | 14.7% |
| Business | 76 | 22.3% |
| Education | 12 | 3.5% |
| Literature & Languages | 16 | 4.7% |
| Liberal Arts & History | 8 | 2.4% |
| Visual & Performing Arts | 9 | 2.6% |
| Communications | 6 | 1.8% |
| Arts & Humanities | 10 | 2.9% |
| Total | 341 | 100.0% |
Transportation & Commute in Bradbury
Vehicle Availability by Sex in Bradbury
The most prevalent vehicle ownership categories in Bradbury are males with 2 vehicles (98, accounting for 44.8%) and females with 2 vehicles (47, making up 66.7%).
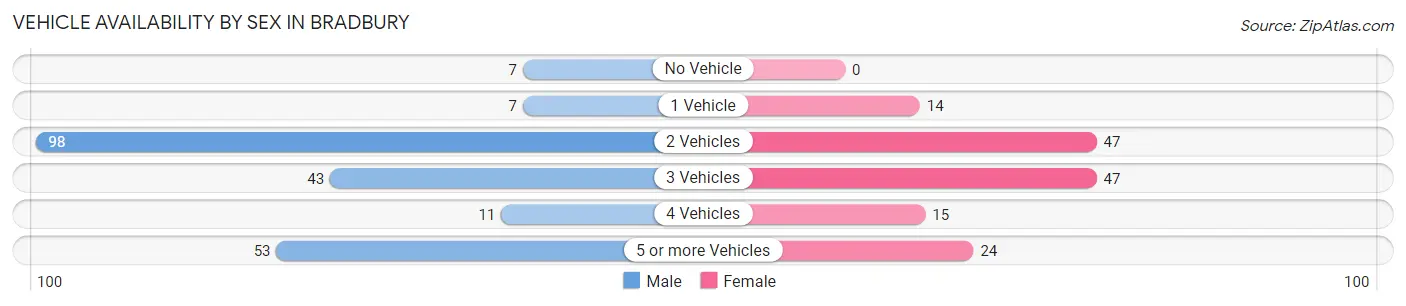
| Vehicles Available | Male | Female |
| No Vehicle | 7 (3.2%) | 0 (0.0%) |
| 1 Vehicle | 7 (3.2%) | 14 (9.5%) |
| 2 Vehicles | 98 (44.8%) | 47 (32.0%) |
| 3 Vehicles | 43 (19.6%) | 47 (32.0%) |
| 4 Vehicles | 11 (5.0%) | 15 (10.2%) |
| 5 or more Vehicles | 53 (24.2%) | 24 (16.3%) |
| Total | 219 (100.0%) | 147 (100.0%) |
Commute Time in Bradbury
The most frequently occuring commute durations in Bradbury are 15 to 19 minutes (79 commuters, 25.6%), 20 to 24 minutes (42 commuters, 13.6%), and 30 to 34 minutes (37 commuters, 12.0%).
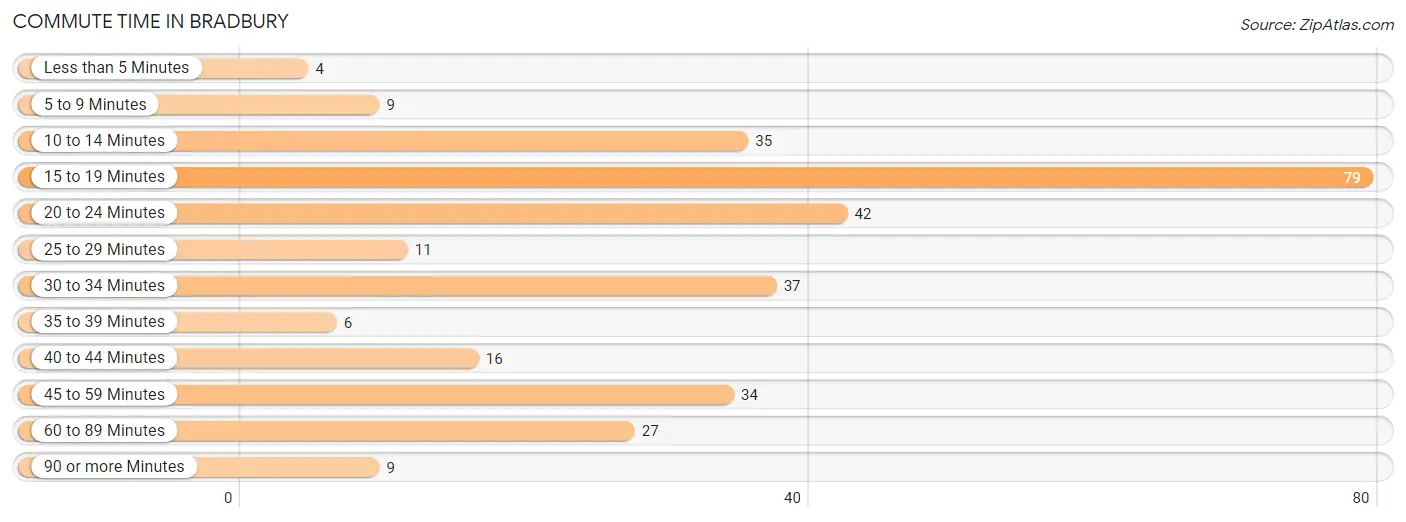
| Commute Time | # Commuters | % Commuters |
| Less than 5 Minutes | 4 | 1.3% |
| 5 to 9 Minutes | 9 | 2.9% |
| 10 to 14 Minutes | 35 | 11.3% |
| 15 to 19 Minutes | 79 | 25.6% |
| 20 to 24 Minutes | 42 | 13.6% |
| 25 to 29 Minutes | 11 | 3.6% |
| 30 to 34 Minutes | 37 | 12.0% |
| 35 to 39 Minutes | 6 | 1.9% |
| 40 to 44 Minutes | 16 | 5.2% |
| 45 to 59 Minutes | 34 | 11.0% |
| 60 to 89 Minutes | 27 | 8.7% |
| 90 or more Minutes | 9 | 2.9% |
Commute Time by Sex in Bradbury
The most common commute times in Bradbury are 20 to 24 minutes (35 commuters, 18.2%) for males and 15 to 19 minutes (46 commuters, 39.3%) for females.
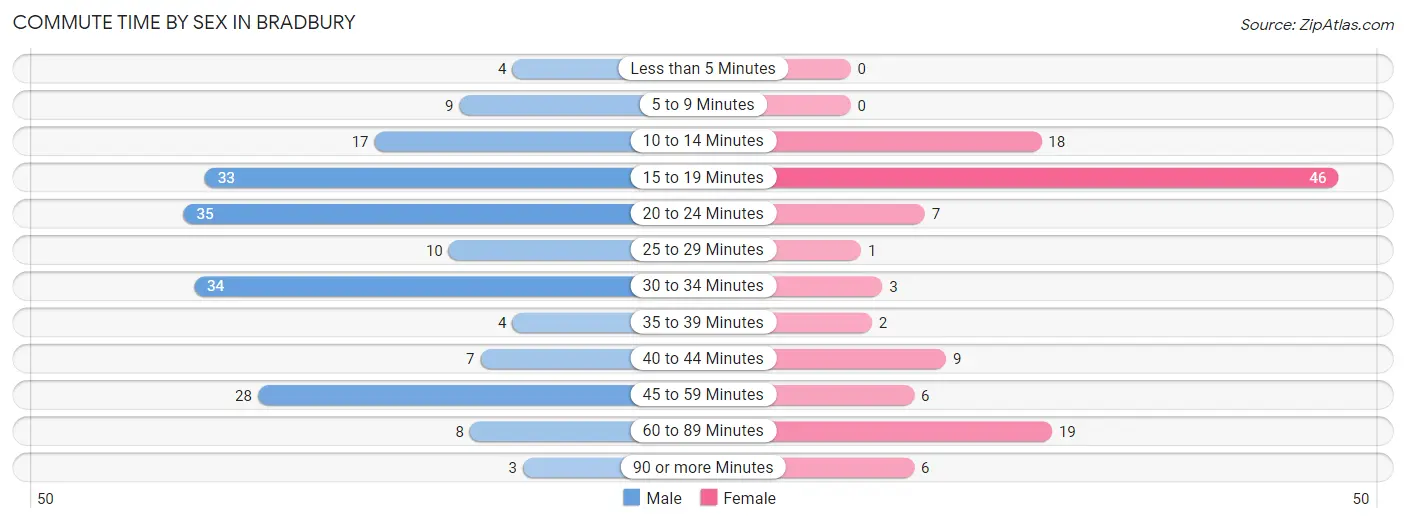
| Commute Time | Male | Female |
| Less than 5 Minutes | 4 (2.1%) | 0 (0.0%) |
| 5 to 9 Minutes | 9 (4.7%) | 0 (0.0%) |
| 10 to 14 Minutes | 17 (8.8%) | 18 (15.4%) |
| 15 to 19 Minutes | 33 (17.2%) | 46 (39.3%) |
| 20 to 24 Minutes | 35 (18.2%) | 7 (6.0%) |
| 25 to 29 Minutes | 10 (5.2%) | 1 (0.9%) |
| 30 to 34 Minutes | 34 (17.7%) | 3 (2.6%) |
| 35 to 39 Minutes | 4 (2.1%) | 2 (1.7%) |
| 40 to 44 Minutes | 7 (3.6%) | 9 (7.7%) |
| 45 to 59 Minutes | 28 (14.6%) | 6 (5.1%) |
| 60 to 89 Minutes | 8 (4.2%) | 19 (16.2%) |
| 90 or more Minutes | 3 (1.6%) | 6 (5.1%) |
Time of Departure to Work by Sex in Bradbury
The most frequent times of departure to work in Bradbury are 6:00 AM to 6:29 AM (46, 24.0%) for males and 7:00 AM to 7:29 AM (26, 22.2%) for females.
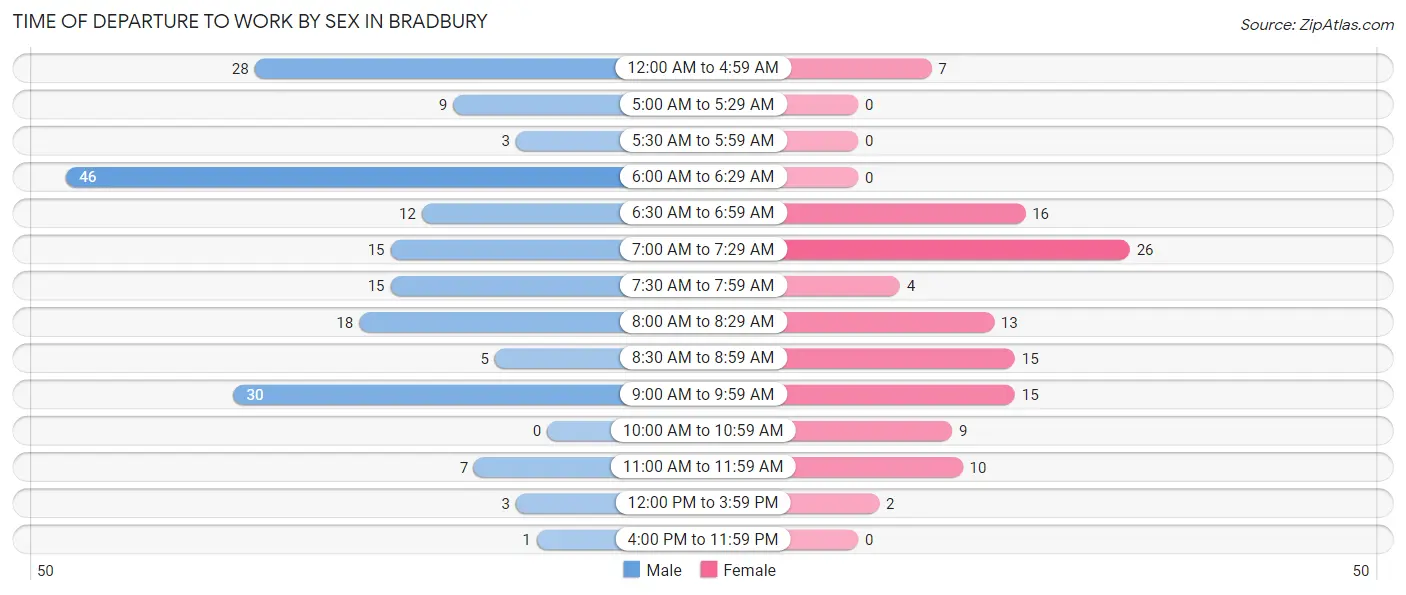
| Time of Departure | Male | Female |
| 12:00 AM to 4:59 AM | 28 (14.6%) | 7 (6.0%) |
| 5:00 AM to 5:29 AM | 9 (4.7%) | 0 (0.0%) |
| 5:30 AM to 5:59 AM | 3 (1.6%) | 0 (0.0%) |
| 6:00 AM to 6:29 AM | 46 (24.0%) | 0 (0.0%) |
| 6:30 AM to 6:59 AM | 12 (6.2%) | 16 (13.7%) |
| 7:00 AM to 7:29 AM | 15 (7.8%) | 26 (22.2%) |
| 7:30 AM to 7:59 AM | 15 (7.8%) | 4 (3.4%) |
| 8:00 AM to 8:29 AM | 18 (9.4%) | 13 (11.1%) |
| 8:30 AM to 8:59 AM | 5 (2.6%) | 15 (12.8%) |
| 9:00 AM to 9:59 AM | 30 (15.6%) | 15 (12.8%) |
| 10:00 AM to 10:59 AM | 0 (0.0%) | 9 (7.7%) |
| 11:00 AM to 11:59 AM | 7 (3.6%) | 10 (8.6%) |
| 12:00 PM to 3:59 PM | 3 (1.6%) | 2 (1.7%) |
| 4:00 PM to 11:59 PM | 1 (0.5%) | 0 (0.0%) |
| Total | 192 (100.0%) | 117 (100.0%) |
Housing Occupancy in Bradbury
Occupancy by Ownership in Bradbury
Of the total 277 dwellings in Bradbury, owner-occupied units account for 256 (92.4%), while renter-occupied units make up 21 (7.6%).
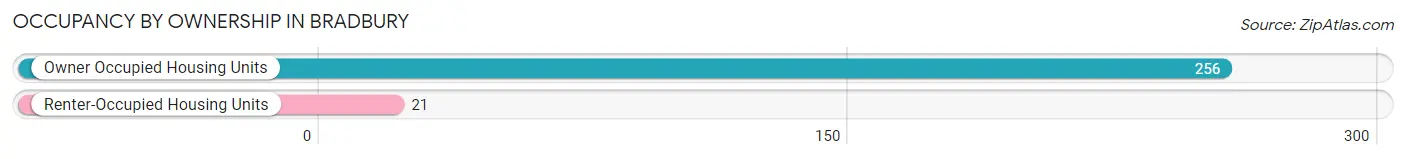
| Occupancy | # Housing Units | % Housing Units |
| Owner Occupied Housing Units | 256 | 92.4% |
| Renter-Occupied Housing Units | 21 | 7.6% |
| Total Occupied Housing Units | 277 | 100.0% |
Occupancy by Household Size in Bradbury
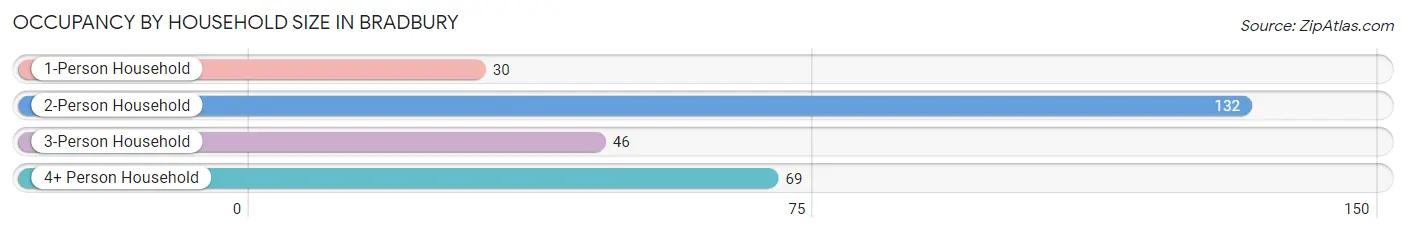
| Household Size | # Housing Units | % Housing Units |
| 1-Person Household | 30 | 10.8% |
| 2-Person Household | 132 | 47.6% |
| 3-Person Household | 46 | 16.6% |
| 4+ Person Household | 69 | 24.9% |
| Total Housing Units | 277 | 100.0% |
Occupancy by Ownership by Household Size in Bradbury
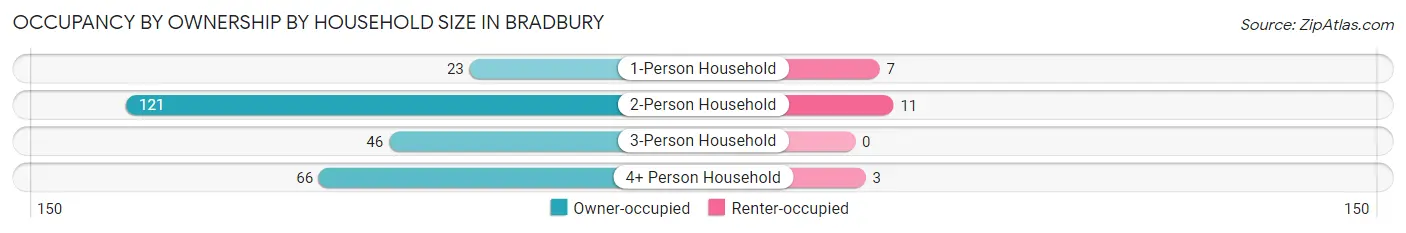
| Household Size | Owner-occupied | Renter-occupied |
| 1-Person Household | 23 (76.7%) | 7 (23.3%) |
| 2-Person Household | 121 (91.7%) | 11 (8.3%) |
| 3-Person Household | 46 (100.0%) | 0 (0.0%) |
| 4+ Person Household | 66 (95.7%) | 3 (4.3%) |
| Total Housing Units | 256 (92.4%) | 21 (7.6%) |
Occupancy by Educational Attainment in Bradbury
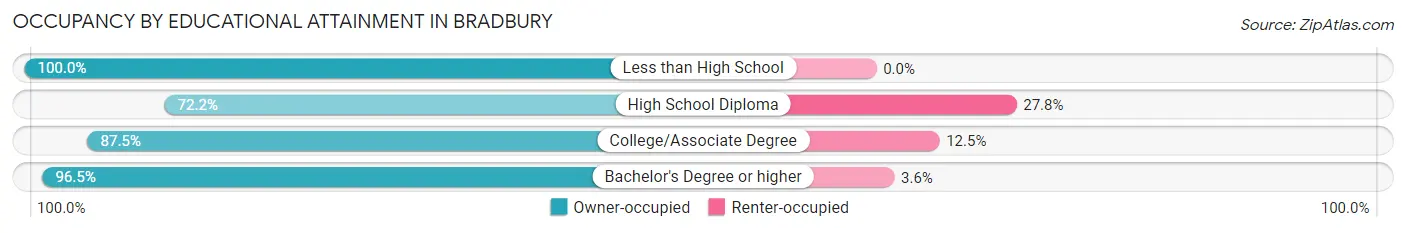
| Household Size | Owner-occupied | Renter-occupied |
| Less than High School | 10 (100.0%) | 0 (0.0%) |
| High School Diploma | 13 (72.2%) | 5 (27.8%) |
| College/Associate Degree | 70 (87.5%) | 10 (12.5%) |
| Bachelor's Degree or higher | 163 (96.5%) | 6 (3.5%) |
Occupancy by Age of Householder in Bradbury
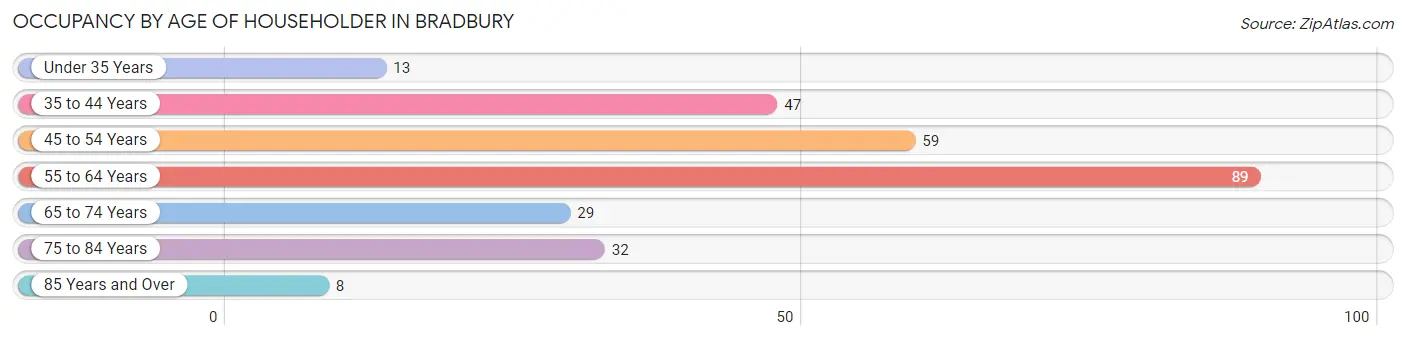
| Age Bracket | # Households | % Households |
| Under 35 Years | 13 | 4.7% |
| 35 to 44 Years | 47 | 17.0% |
| 45 to 54 Years | 59 | 21.3% |
| 55 to 64 Years | 89 | 32.1% |
| 65 to 74 Years | 29 | 10.5% |
| 75 to 84 Years | 32 | 11.6% |
| 85 Years and Over | 8 | 2.9% |
| Total | 277 | 100.0% |
Housing Finances in Bradbury
Median Income by Occupancy in Bradbury
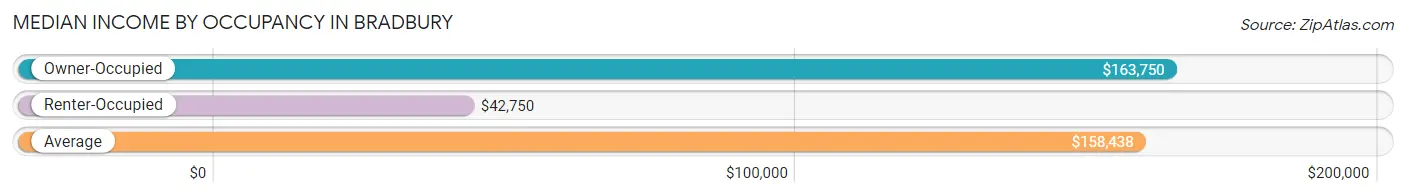
| Occupancy Type | # Households | Median Income |
| Owner-Occupied | 256 (92.4%) | $163,750 |
| Renter-Occupied | 21 (7.6%) | $42,750 |
| Average | 277 (100.0%) | $158,438 |
Occupancy by Householder Income Bracket in Bradbury
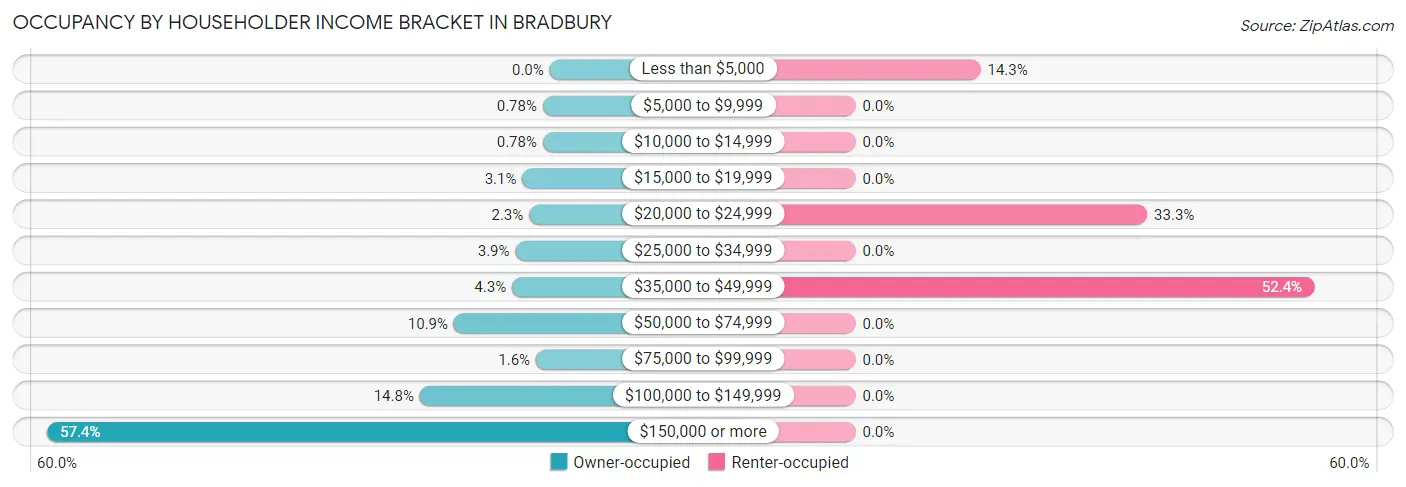
| Income Bracket | Owner-occupied | Renter-occupied |
| Less than $5,000 | 0 (0.0%) | 3 (14.3%) |
| $5,000 to $9,999 | 2 (0.8%) | 0 (0.0%) |
| $10,000 to $14,999 | 2 (0.8%) | 0 (0.0%) |
| $15,000 to $19,999 | 8 (3.1%) | 0 (0.0%) |
| $20,000 to $24,999 | 6 (2.3%) | 7 (33.3%) |
| $25,000 to $34,999 | 10 (3.9%) | 0 (0.0%) |
| $35,000 to $49,999 | 11 (4.3%) | 11 (52.4%) |
| $50,000 to $74,999 | 28 (10.9%) | 0 (0.0%) |
| $75,000 to $99,999 | 4 (1.6%) | 0 (0.0%) |
| $100,000 to $149,999 | 38 (14.8%) | 0 (0.0%) |
| $150,000 or more | 147 (57.4%) | 0 (0.0%) |
| Total | 256 (100.0%) | 21 (100.0%) |
Monthly Housing Cost Tiers in Bradbury
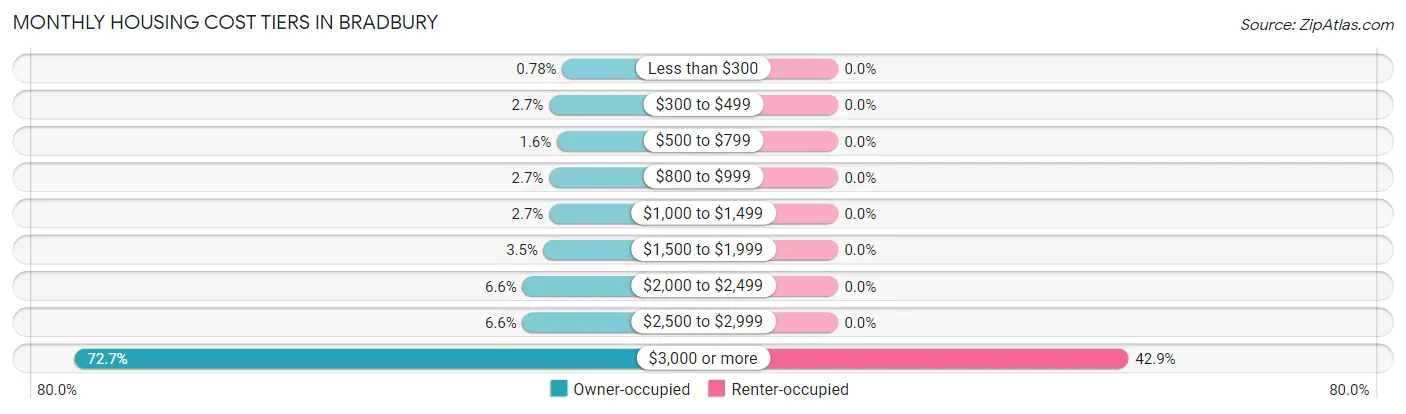
| Monthly Cost | Owner-occupied | Renter-occupied |
| Less than $300 | 2 (0.8%) | 0 (0.0%) |
| $300 to $499 | 7 (2.7%) | 0 (0.0%) |
| $500 to $799 | 4 (1.6%) | 0 (0.0%) |
| $800 to $999 | 7 (2.7%) | 0 (0.0%) |
| $1,000 to $1,499 | 7 (2.7%) | 0 (0.0%) |
| $1,500 to $1,999 | 9 (3.5%) | 0 (0.0%) |
| $2,000 to $2,499 | 17 (6.6%) | 0 (0.0%) |
| $2,500 to $2,999 | 17 (6.6%) | 0 (0.0%) |
| $3,000 or more | 186 (72.7%) | 9 (42.9%) |
| Total | 256 (100.0%) | 21 (100.0%) |
Physical Housing Characteristics in Bradbury
Housing Structures in Bradbury
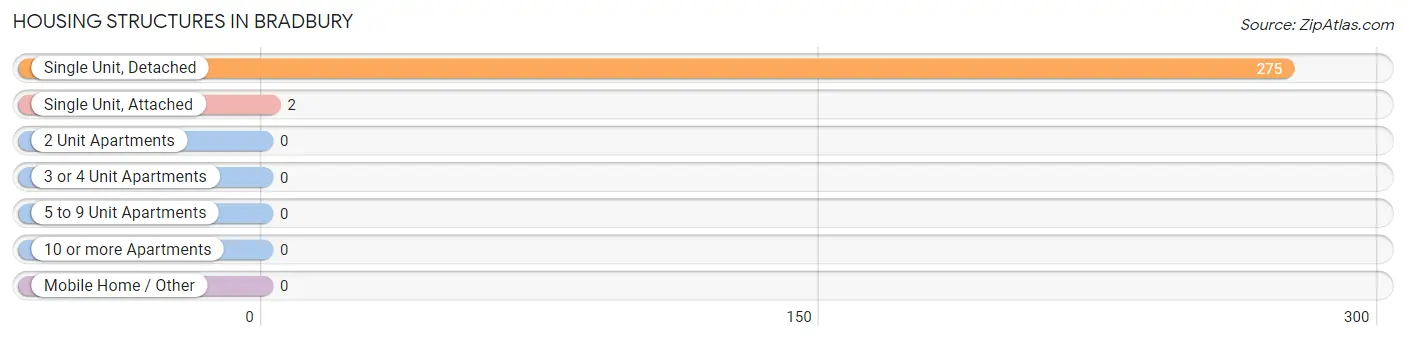
| Structure Type | # Housing Units | % Housing Units |
| Single Unit, Detached | 275 | 99.3% |
| Single Unit, Attached | 2 | 0.7% |
| 2 Unit Apartments | 0 | 0.0% |
| 3 or 4 Unit Apartments | 0 | 0.0% |
| 5 to 9 Unit Apartments | 0 | 0.0% |
| 10 or more Apartments | 0 | 0.0% |
| Mobile Home / Other | 0 | 0.0% |
| Total | 277 | 100.0% |
Housing Structures by Occupancy in Bradbury
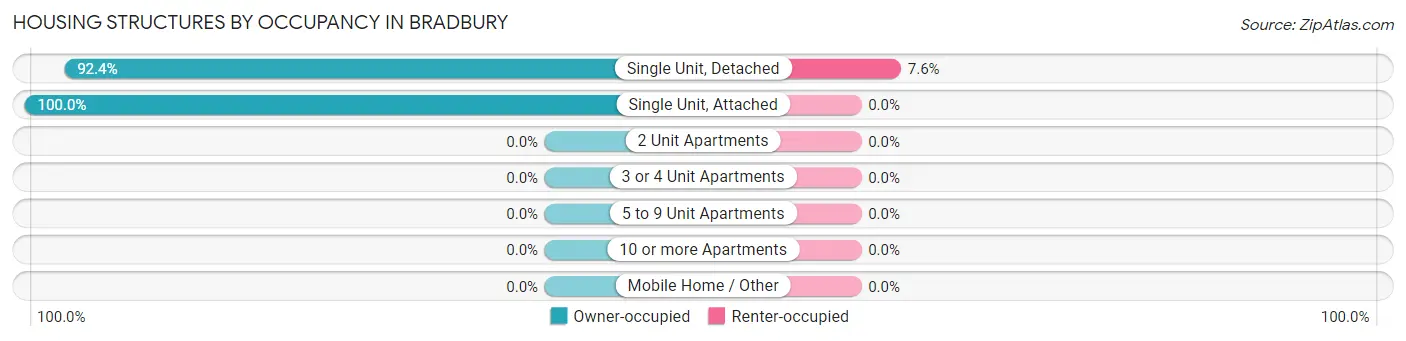
| Structure Type | Owner-occupied | Renter-occupied |
| Single Unit, Detached | 254 (92.4%) | 21 (7.6%) |
| Single Unit, Attached | 2 (100.0%) | 0 (0.0%) |
| 2 Unit Apartments | 0 (0.0%) | 0 (0.0%) |
| 3 or 4 Unit Apartments | 0 (0.0%) | 0 (0.0%) |
| 5 to 9 Unit Apartments | 0 (0.0%) | 0 (0.0%) |
| 10 or more Apartments | 0 (0.0%) | 0 (0.0%) |
| Mobile Home / Other | 0 (0.0%) | 0 (0.0%) |
| Total | 256 (92.4%) | 21 (7.6%) |
Housing Structures by Number of Rooms in Bradbury
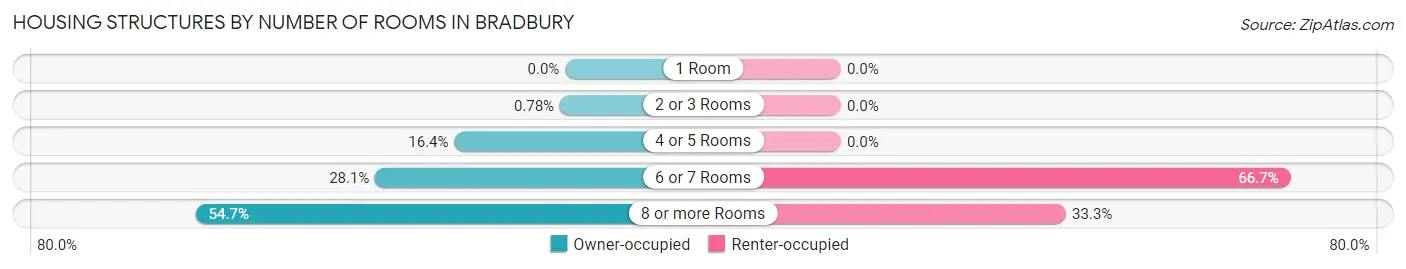
| Number of Rooms | Owner-occupied | Renter-occupied |
| 1 Room | 0 (0.0%) | 0 (0.0%) |
| 2 or 3 Rooms | 2 (0.8%) | 0 (0.0%) |
| 4 or 5 Rooms | 42 (16.4%) | 0 (0.0%) |
| 6 or 7 Rooms | 72 (28.1%) | 14 (66.7%) |
| 8 or more Rooms | 140 (54.7%) | 7 (33.3%) |
| Total | 256 (100.0%) | 21 (100.0%) |
Housing Structure by Heating Type in Bradbury
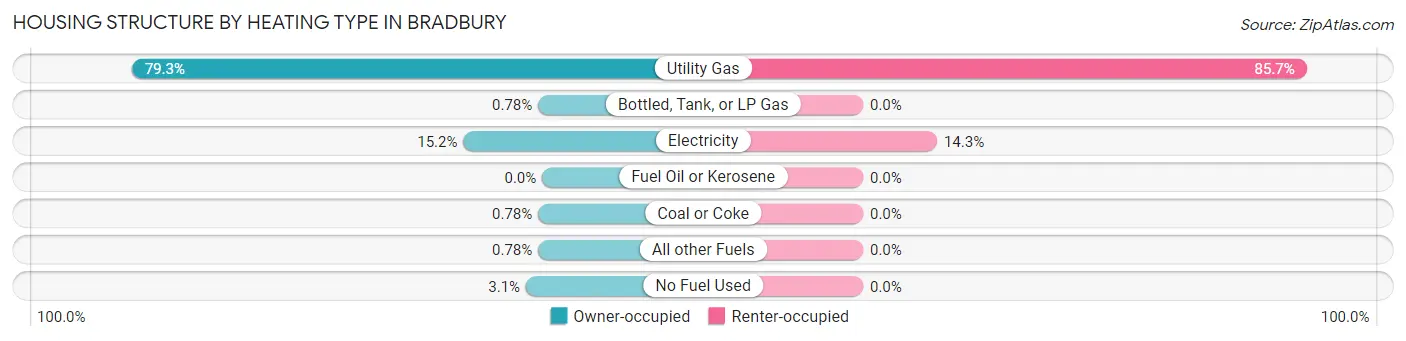
| Heating Type | Owner-occupied | Renter-occupied |
| Utility Gas | 203 (79.3%) | 18 (85.7%) |
| Bottled, Tank, or LP Gas | 2 (0.8%) | 0 (0.0%) |
| Electricity | 39 (15.2%) | 3 (14.3%) |
| Fuel Oil or Kerosene | 0 (0.0%) | 0 (0.0%) |
| Coal or Coke | 2 (0.8%) | 0 (0.0%) |
| All other Fuels | 2 (0.8%) | 0 (0.0%) |
| No Fuel Used | 8 (3.1%) | 0 (0.0%) |
| Total | 256 (100.0%) | 21 (100.0%) |
Household Vehicle Usage in Bradbury
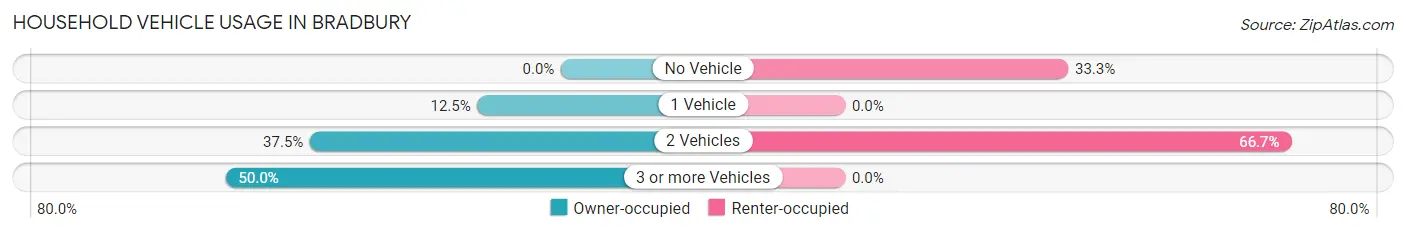
| Vehicles per Household | Owner-occupied | Renter-occupied |
| No Vehicle | 0 (0.0%) | 7 (33.3%) |
| 1 Vehicle | 32 (12.5%) | 0 (0.0%) |
| 2 Vehicles | 96 (37.5%) | 14 (66.7%) |
| 3 or more Vehicles | 128 (50.0%) | 0 (0.0%) |
| Total | 256 (100.0%) | 21 (100.0%) |
Real Estate & Mortgages in Bradbury
Real Estate and Mortgage Overview in Bradbury
| Characteristic | Without Mortgage | With Mortgage |
| Housing Units | 63 | 193 |
| Median Property Value | $1,151,300 | $2,000,001 |
| Median Household Income | $71,477 | $130 |
| Monthly Housing Costs | $1,501 | $175 |
| Real Estate Taxes | $10,001 | $2 |
Property Value by Mortgage Status in Bradbury
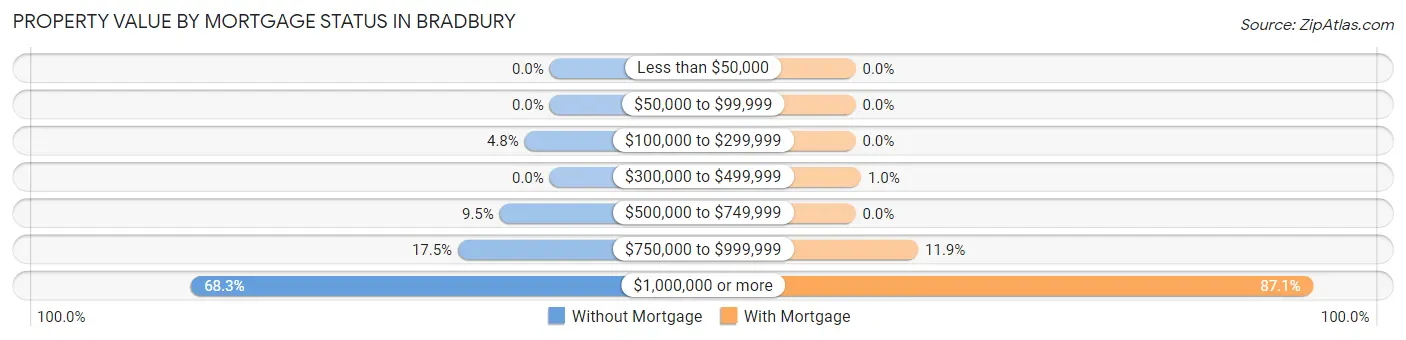
| Property Value | Without Mortgage | With Mortgage |
| Less than $50,000 | 0 (0.0%) | 0 (0.0%) |
| $50,000 to $99,999 | 0 (0.0%) | 0 (0.0%) |
| $100,000 to $299,999 | 3 (4.8%) | 0 (0.0%) |
| $300,000 to $499,999 | 0 (0.0%) | 2 (1.0%) |
| $500,000 to $749,999 | 6 (9.5%) | 0 (0.0%) |
| $750,000 to $999,999 | 11 (17.5%) | 23 (11.9%) |
| $1,000,000 or more | 43 (68.2%) | 168 (87.1%) |
| Total | 63 (100.0%) | 193 (100.0%) |
Household Income by Mortgage Status in Bradbury
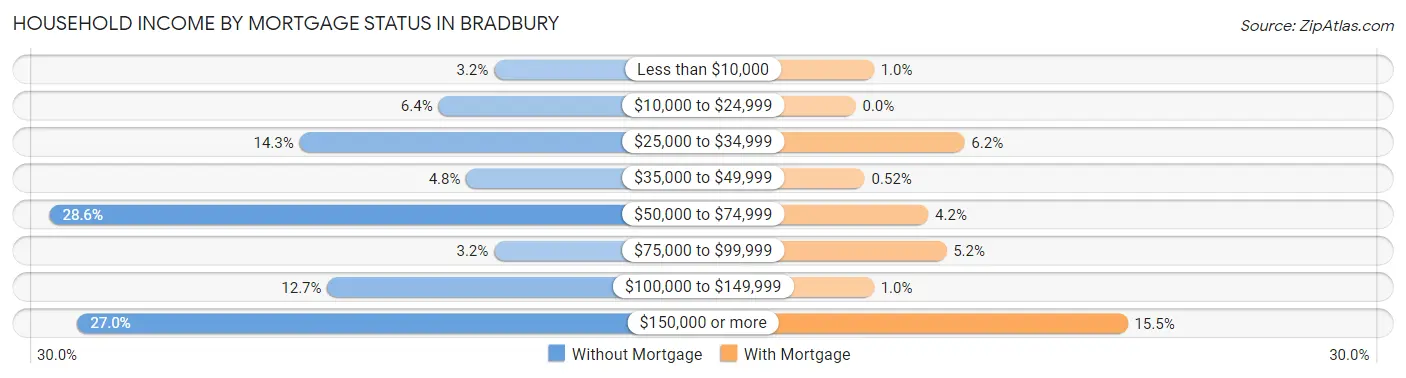
| Household Income | Without Mortgage | With Mortgage |
| Less than $10,000 | 2 (3.2%) | 2 (1.0%) |
| $10,000 to $24,999 | 4 (6.4%) | 0 (0.0%) |
| $25,000 to $34,999 | 9 (14.3%) | 12 (6.2%) |
| $35,000 to $49,999 | 3 (4.8%) | 1 (0.5%) |
| $50,000 to $74,999 | 18 (28.6%) | 8 (4.2%) |
| $75,000 to $99,999 | 2 (3.2%) | 10 (5.2%) |
| $100,000 to $149,999 | 8 (12.7%) | 2 (1.0%) |
| $150,000 or more | 17 (27.0%) | 30 (15.5%) |
| Total | 63 (100.0%) | 193 (100.0%) |
Property Value to Household Income Ratio in Bradbury
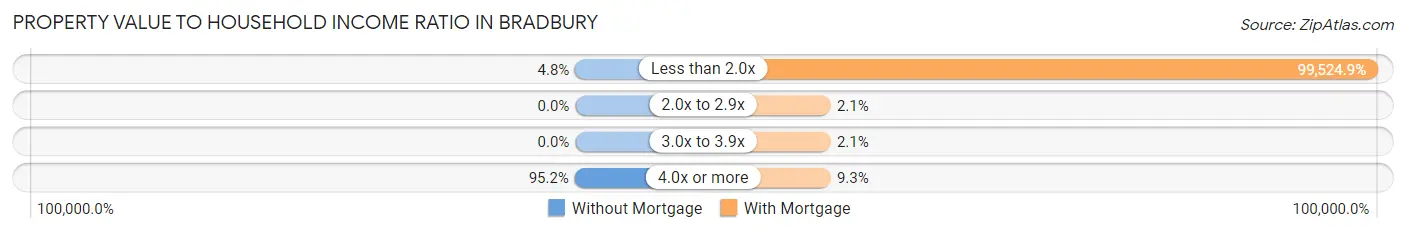
| Value-to-Income Ratio | Without Mortgage | With Mortgage |
| Less than 2.0x | 3 (4.8%) | 192,083 (99,524.9%) |
| 2.0x to 2.9x | 0 (0.0%) | 4 (2.1%) |
| 3.0x to 3.9x | 0 (0.0%) | 4 (2.1%) |
| 4.0x or more | 60 (95.2%) | 18 (9.3%) |
| Total | 63 (100.0%) | 193 (100.0%) |
Real Estate Taxes by Mortgage Status in Bradbury
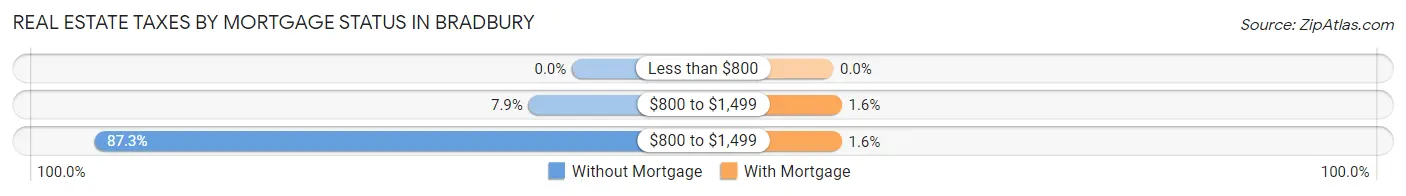
| Property Taxes | Without Mortgage | With Mortgage |
| Less than $800 | 0 (0.0%) | 0 (0.0%) |
| $800 to $1,499 | 5 (7.9%) | 3 (1.5%) |
| $800 to $1,499 | 55 (87.3%) | 3 (1.5%) |
| Total | 63 (100.0%) | 193 (100.0%) |
Health & Disability in Bradbury
Health Insurance Coverage by Age in Bradbury
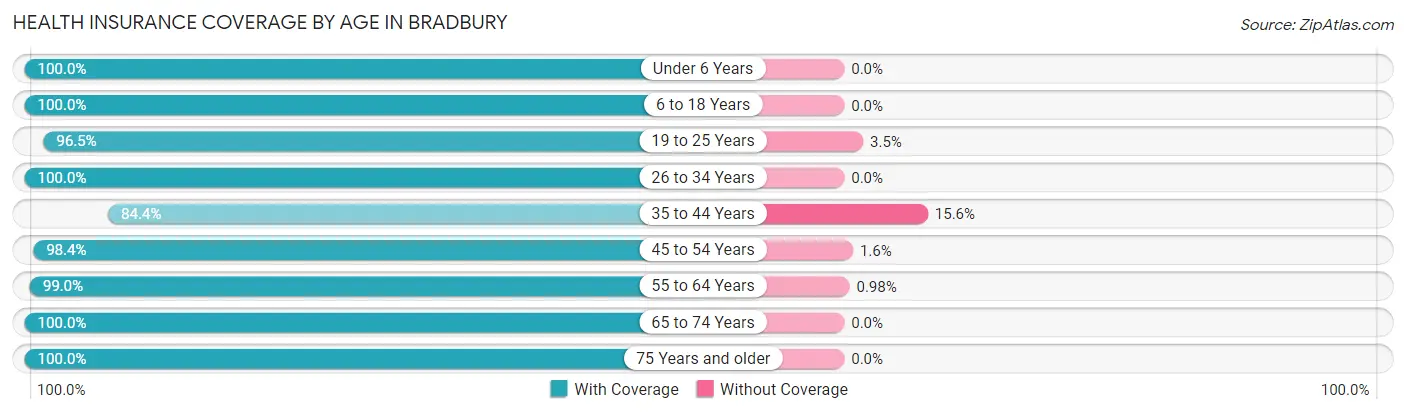
| Age Bracket | With Coverage | Without Coverage |
| Under 6 Years | 28 (100.0%) | 0 (0.0%) |
| 6 to 18 Years | 79 (100.0%) | 0 (0.0%) |
| 19 to 25 Years | 55 (96.5%) | 2 (3.5%) |
| 26 to 34 Years | 53 (100.0%) | 0 (0.0%) |
| 35 to 44 Years | 65 (84.4%) | 12 (15.6%) |
| 45 to 54 Years | 122 (98.4%) | 2 (1.6%) |
| 55 to 64 Years | 203 (99.0%) | 2 (1.0%) |
| 65 to 74 Years | 64 (100.0%) | 0 (0.0%) |
| 75 Years and older | 80 (100.0%) | 0 (0.0%) |
| Total | 749 (97.7%) | 18 (2.4%) |
Health Insurance Coverage by Citizenship Status in Bradbury
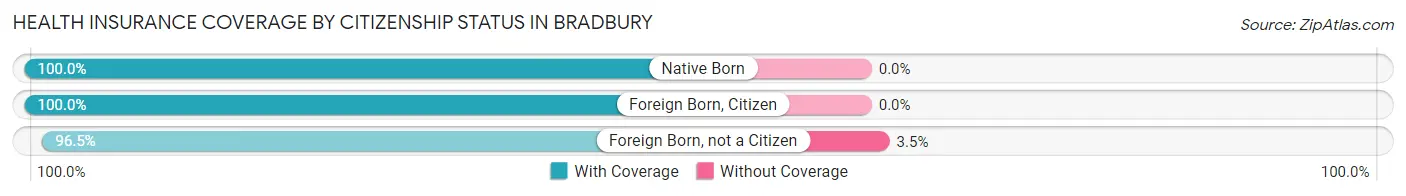
| Citizenship Status | With Coverage | Without Coverage |
| Native Born | 28 (100.0%) | 0 (0.0%) |
| Foreign Born, Citizen | 79 (100.0%) | 0 (0.0%) |
| Foreign Born, not a Citizen | 55 (96.5%) | 2 (3.5%) |
Health Insurance Coverage by Household Income in Bradbury
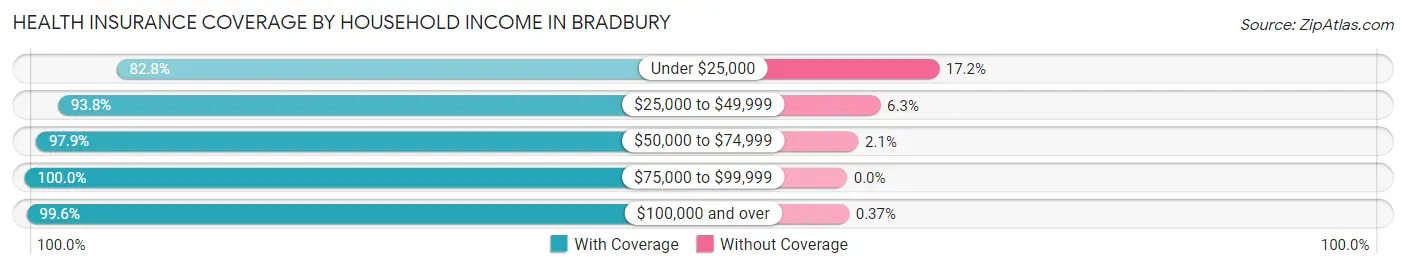
| Household Income | With Coverage | Without Coverage |
| Under $25,000 | 48 (82.8%) | 10 (17.2%) |
| $25,000 to $49,999 | 60 (93.8%) | 4 (6.2%) |
| $50,000 to $74,999 | 92 (97.9%) | 2 (2.1%) |
| $75,000 to $99,999 | 7 (100.0%) | 0 (0.0%) |
| $100,000 and over | 542 (99.6%) | 2 (0.4%) |
Public vs Private Health Insurance Coverage by Age in Bradbury
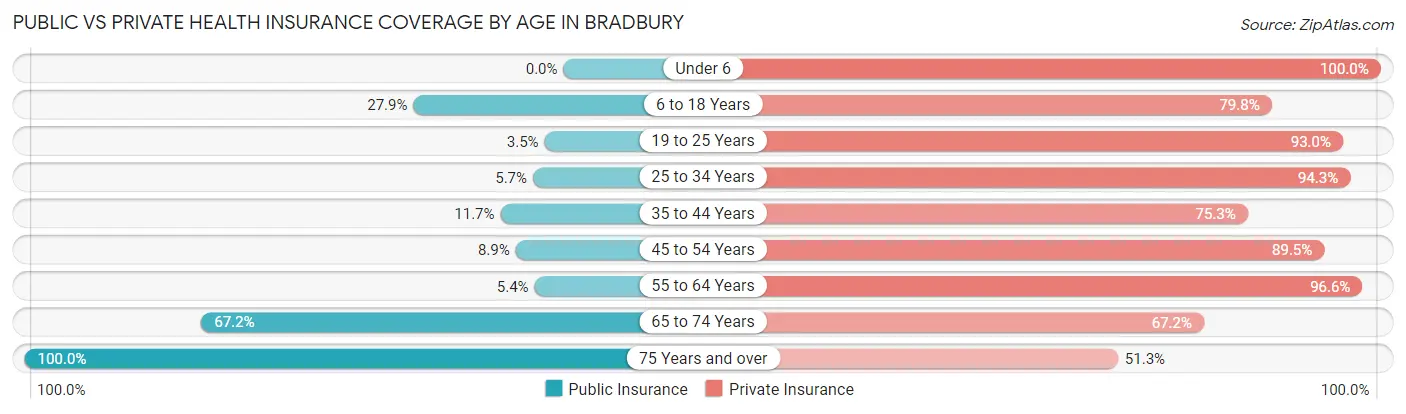
| Age Bracket | Public Insurance | Private Insurance |
| Under 6 | 0 (0.0%) | 28 (100.0%) |
| 6 to 18 Years | 22 (27.9%) | 63 (79.7%) |
| 19 to 25 Years | 2 (3.5%) | 53 (93.0%) |
| 25 to 34 Years | 3 (5.7%) | 50 (94.3%) |
| 35 to 44 Years | 9 (11.7%) | 58 (75.3%) |
| 45 to 54 Years | 11 (8.9%) | 111 (89.5%) |
| 55 to 64 Years | 11 (5.4%) | 198 (96.6%) |
| 65 to 74 Years | 43 (67.2%) | 43 (67.2%) |
| 75 Years and over | 80 (100.0%) | 41 (51.2%) |
| Total | 181 (23.6%) | 645 (84.1%) |
Disability Status by Sex by Age in Bradbury
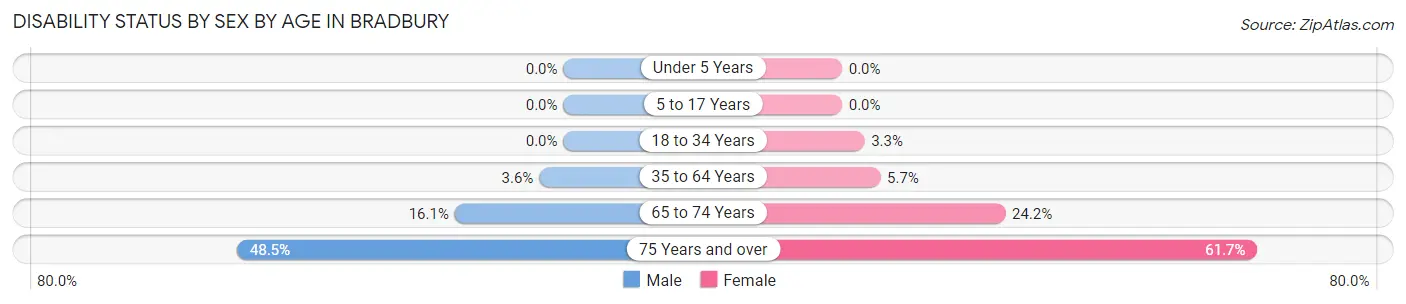
| Age Bracket | Male | Female |
| Under 5 Years | 0 (0.0%) | 0 (0.0%) |
| 5 to 17 Years | 0 (0.0%) | 0 (0.0%) |
| 18 to 34 Years | 0 (0.0%) | 2 (3.3%) |
| 35 to 64 Years | 7 (3.6%) | 12 (5.7%) |
| 65 to 74 Years | 5 (16.1%) | 8 (24.2%) |
| 75 Years and over | 16 (48.5%) | 29 (61.7%) |
Disability Class by Sex by Age in Bradbury
Disability Class: Hearing Difficulty
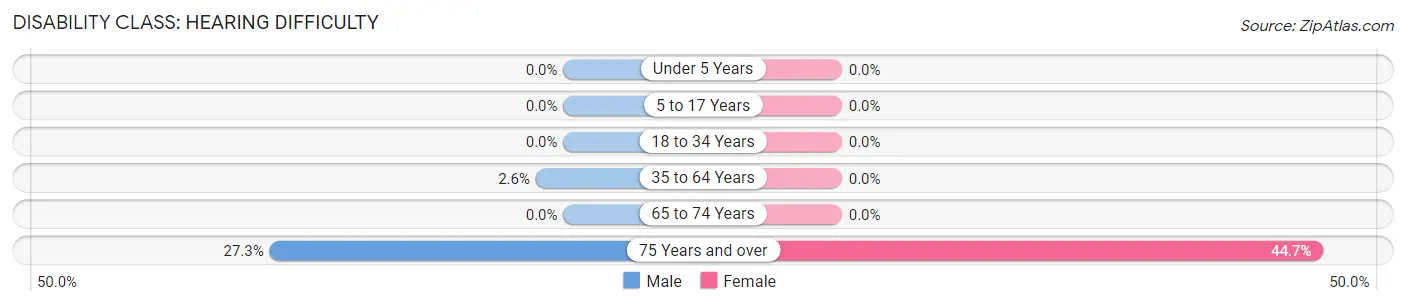
| Age Bracket | Male | Female |
| Under 5 Years | 0 (0.0%) | 0 (0.0%) |
| 5 to 17 Years | 0 (0.0%) | 0 (0.0%) |
| 18 to 34 Years | 0 (0.0%) | 0 (0.0%) |
| 35 to 64 Years | 5 (2.6%) | 0 (0.0%) |
| 65 to 74 Years | 0 (0.0%) | 0 (0.0%) |
| 75 Years and over | 9 (27.3%) | 21 (44.7%) |
Disability Class: Vision Difficulty
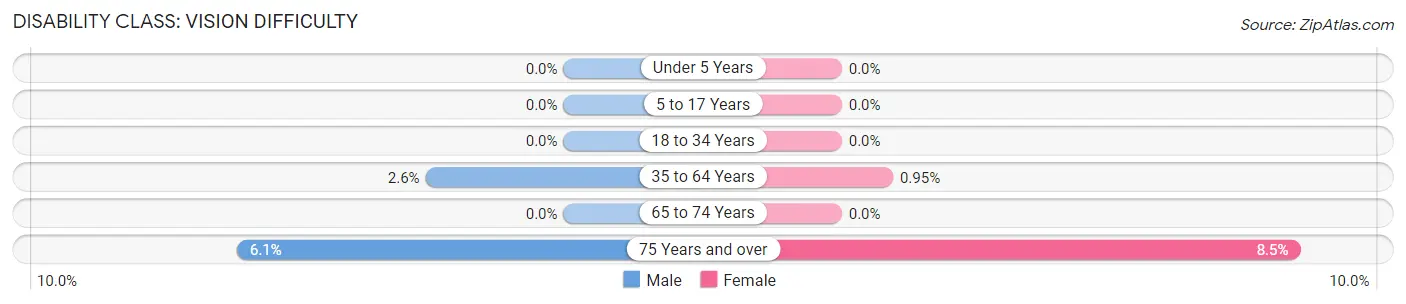
| Age Bracket | Male | Female |
| Under 5 Years | 0 (0.0%) | 0 (0.0%) |
| 5 to 17 Years | 0 (0.0%) | 0 (0.0%) |
| 18 to 34 Years | 0 (0.0%) | 0 (0.0%) |
| 35 to 64 Years | 5 (2.6%) | 2 (0.9%) |
| 65 to 74 Years | 0 (0.0%) | 0 (0.0%) |
| 75 Years and over | 2 (6.1%) | 4 (8.5%) |
Disability Class: Cognitive Difficulty
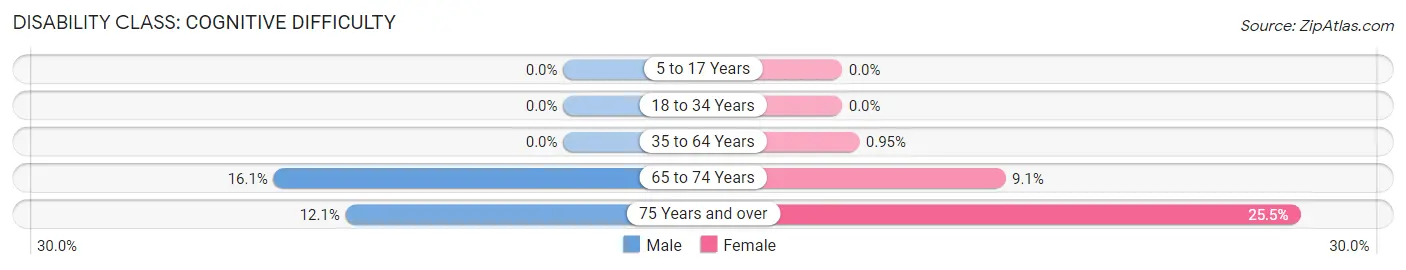
| Age Bracket | Male | Female |
| 5 to 17 Years | 0 (0.0%) | 0 (0.0%) |
| 18 to 34 Years | 0 (0.0%) | 0 (0.0%) |
| 35 to 64 Years | 0 (0.0%) | 2 (0.9%) |
| 65 to 74 Years | 5 (16.1%) | 3 (9.1%) |
| 75 Years and over | 4 (12.1%) | 12 (25.5%) |
Disability Class: Ambulatory Difficulty
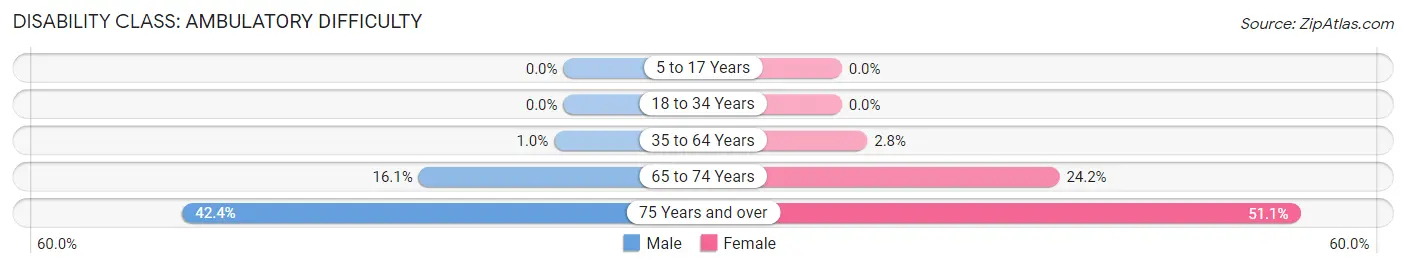
| Age Bracket | Male | Female |
| 5 to 17 Years | 0 (0.0%) | 0 (0.0%) |
| 18 to 34 Years | 0 (0.0%) | 0 (0.0%) |
| 35 to 64 Years | 2 (1.0%) | 6 (2.8%) |
| 65 to 74 Years | 5 (16.1%) | 8 (24.2%) |
| 75 Years and over | 14 (42.4%) | 24 (51.1%) |
Disability Class: Self-Care Difficulty
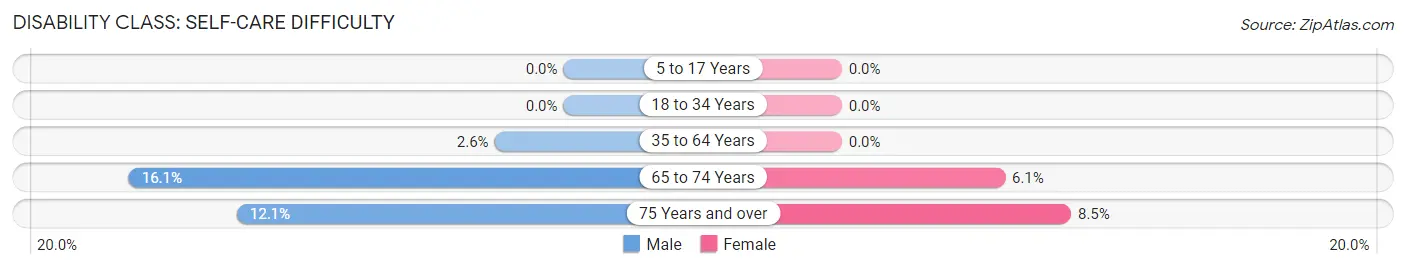
| Age Bracket | Male | Female |
| 5 to 17 Years | 0 (0.0%) | 0 (0.0%) |
| 18 to 34 Years | 0 (0.0%) | 0 (0.0%) |
| 35 to 64 Years | 5 (2.6%) | 0 (0.0%) |
| 65 to 74 Years | 5 (16.1%) | 2 (6.1%) |
| 75 Years and over | 4 (12.1%) | 4 (8.5%) |
Technology Access in Bradbury
Computing Device Access in Bradbury
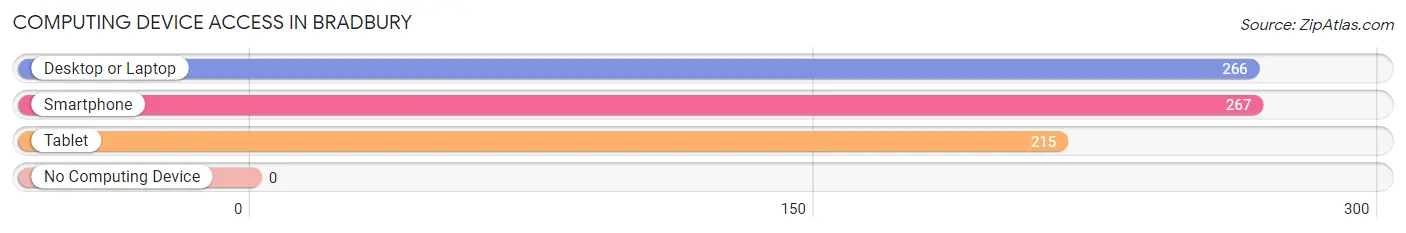
| Device Type | # Households | % Households |
| Desktop or Laptop | 266 | 96.0% |
| Smartphone | 267 | 96.4% |
| Tablet | 215 | 77.6% |
| No Computing Device | 0 | 0.0% |
| Total | 277 | 100.0% |
Internet Access in Bradbury
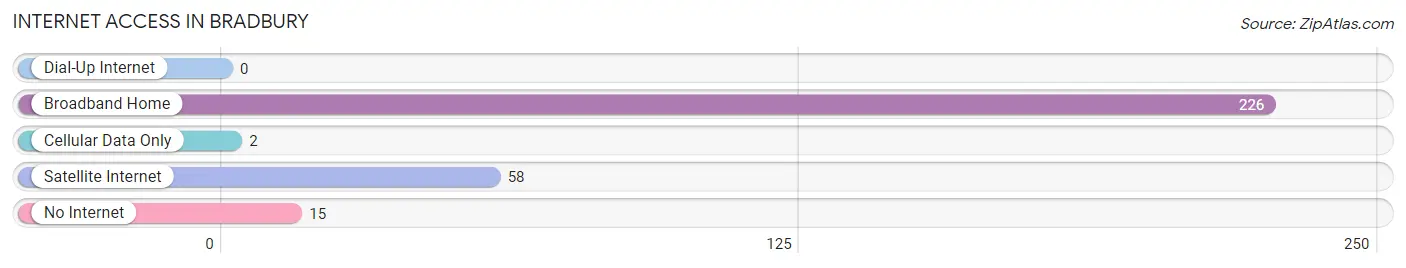
| Internet Type | # Households | % Households |
| Dial-Up Internet | 0 | 0.0% |
| Broadband Home | 226 | 81.6% |
| Cellular Data Only | 2 | 0.7% |
| Satellite Internet | 58 | 20.9% |
| No Internet | 15 | 5.4% |
| Total | 277 | 100.0% |
Bradbury Summary
Bradbury is a small city located in the San Gabriel Valley of Los Angeles County, California. It is situated in the foothills of the San Gabriel Mountains, approximately 20 miles east of downtown Los Angeles. The city was incorporated in 1957 and has a population of 1,048 as of the 2010 census.
Geography
Bradbury is located at 34°7'25"N 118°3'30"W. It is bordered by the cities of Monrovia to the north, Duarte to the east, and Sierra Madre to the south. The city is situated in the foothills of the San Gabriel Mountains, with the Angeles National Forest to the north and east. The city has a total area of 1.0 square mile, all of which is land.
Climate
Bradbury has a Mediterranean climate, with hot, dry summers and mild, wet winters. The average high temperature in the summer is around 90°F, while the average low temperature in the winter is around 50°F. The average annual precipitation is around 15 inches.
Demographics
As of the 2010 census, there were 1,048 people, 441 households, and 327 families residing in the city. The population density was 1,039.2 people per square mile. The racial makeup of the city was 79.2% White, 0.7% African American, 0.2% Native American, 11.2% Asian, 0.1% Pacific Islander, 5.2% from other races, and 3.4% from two or more races. Hispanic or Latino of any race were 18.2% of the population.
Economy
Bradbury is a primarily residential community, with no major industries or businesses located within the city limits. The city is home to several small businesses, including a few restaurants, a gas station, and a few small retail stores. The city also has a few small office buildings. The median household income in the city was $125,000 in 2010, and the median family income was $150,000.
Conclusion
Bradbury is a small city located in the San Gabriel Valley of Los Angeles County, California. It is situated in the foothills of the San Gabriel Mountains, approximately 20 miles east of downtown Los Angeles. The city was incorporated in 1957 and has a population of 1,048 as of the 2010 census. Bradbury has a Mediterranean climate, with hot, dry summers and mild, wet winters. The racial makeup of the city was 79.2% White, 0.7% African American, 0.2% Native American, 11.2% Asian, 0.1% Pacific Islander, 5.2% from other races, and 3.4% from two or more races. Hispanic or Latino of any race were 18.2% of the population. Bradbury is a primarily residential community, with no major industries or businesses located within the city limits. The median household income in the city was $125,000 in 2010, and the median family income was $150,000.
Common Questions
What is Per Capita Income in Bradbury?
Per Capita income in Bradbury is $92,386.
What is the Median Family Income in Bradbury?
Median Family Income in Bradbury is $168,750.
What is the Median Household income in Bradbury?
Median Household Income in Bradbury is $158,438.
What is Income or Wage Gap in Bradbury?
Income or Wage Gap in Bradbury is 64.3%.
Women in Bradbury earn 35.7 cents for every dollar earned by a man.
What is Inequality or Gini Index in Bradbury?
Inequality or Gini Index in Bradbury is 0.53.
What is the Total Population of Bradbury?
Total Population of Bradbury is 767.
What is the Total Male Population of Bradbury?
Total Male Population of Bradbury is 370.
What is the Total Female Population of Bradbury?
Total Female Population of Bradbury is 397.
What is the Ratio of Males per 100 Females in Bradbury?
There are 93.20 Males per 100 Females in Bradbury.
What is the Ratio of Females per 100 Males in Bradbury?
There are 107.30 Females per 100 Males in Bradbury.
What is the Median Population Age in Bradbury?
Median Population Age in Bradbury is 53.0 Years.
What is the Average Family Size in Bradbury
Average Family Size in Bradbury is 3.0 People.
What is the Average Household Size in Bradbury
Average Household Size in Bradbury is 2.8 People.
How Large is the Labor Force in Bradbury?
There are 409 People in the Labor Forcein in Bradbury.
What is the Percentage of People in the Labor Force in Bradbury?
59.9% of People are in the Labor Force in Bradbury.
What is the Unemployment Rate in Bradbury?
Unemployment Rate in Bradbury is 7.3%.