Fairhaven, CA Map & Demographics
Fairhaven Map
Fairhaven Overview
$33,714
PER CAPITA INCOME
$76,500
AVG FAMILY INCOME
$76,583
AVG HOUSEHOLD INCOME
18.4%
WAGE / INCOME GAP [ % ]
81.6¢/ $1
WAGE / INCOME GAP [ $ ]
0.31
INEQUALITY / GINI INDEX
341
TOTAL POPULATION
194
MALE POPULATION
147
FEMALE POPULATION
131.97
MALES / 100 FEMALES
75.77
FEMALES / 100 MALES
54.4
MEDIAN AGE
2.3
AVG FAMILY SIZE
2.2
AVG HOUSEHOLD SIZE
225
LABOR FORCE [ PEOPLE ]
69.4%
PERCENT IN LABOR FORCE
6.7%
UNEMPLOYMENT RATE
Income in Fairhaven
Income Overview in Fairhaven
Per Capita Income in Fairhaven is $33,714, while median incomes of families and households are $76,500 and $76,583 respectively.
| Characteristic | Number | Measure |
| Per Capita Income | 341 | $33,714 |
| Median Family Income | 78 | $76,500 |
| Mean Family Income | 78 | $84,145 |
| Median Household Income | 145 | $76,583 |
| Mean Household Income | 145 | $80,877 |
| Income Deficit | 78 | $0 |
| Wage / Income Gap (%) | 341 | 18.36% |
| Wage / Income Gap ($) | 341 | 81.64¢ per $1 |
| Gini / Inequality Index | 341 | 0.31 |
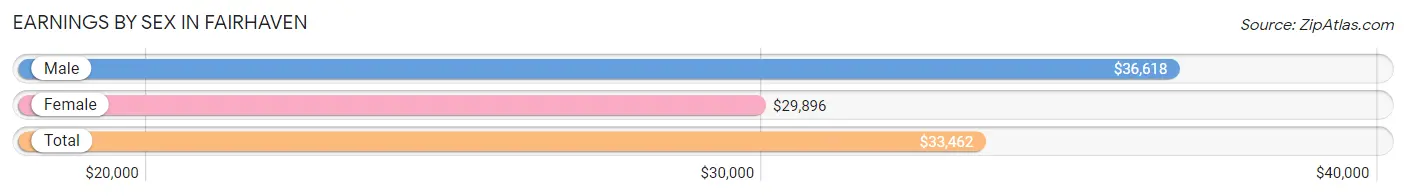
Earnings by Sex in Fairhaven
Average Earnings in Fairhaven are $33,462, $36,618 for men and $29,896 for women, a difference of 18.4%.
| Sex | Number | Average Earnings |
| Male | 116 (51.3%) | $36,618 |
| Female | 110 (48.7%) | $29,896 |
| Total | 226 (100.0%) | $33,462 |
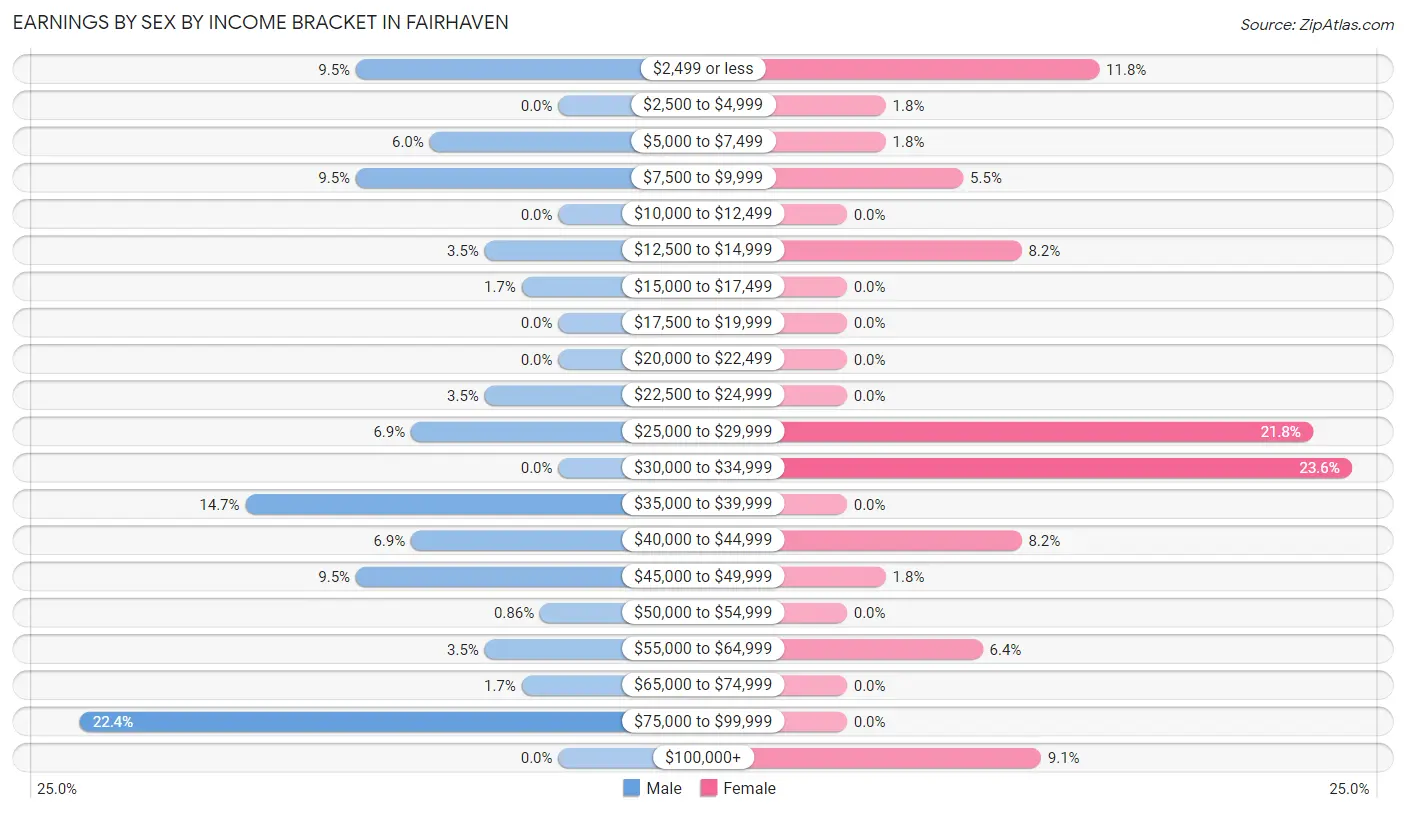
Earnings by Sex by Income Bracket in Fairhaven
The most common earnings brackets in Fairhaven are $75,000 to $99,999 for men (26 | 22.4%) and $30,000 to $34,999 for women (26 | 23.6%).
| Income | Male | Female |
| $2,499 or less | 11 (9.5%) | 13 (11.8%) |
| $2,500 to $4,999 | 0 (0.0%) | 2 (1.8%) |
| $5,000 to $7,499 | 7 (6.0%) | 2 (1.8%) |
| $7,500 to $9,999 | 11 (9.5%) | 6 (5.4%) |
| $10,000 to $12,499 | 0 (0.0%) | 0 (0.0%) |
| $12,500 to $14,999 | 4 (3.5%) | 9 (8.2%) |
| $15,000 to $17,499 | 2 (1.7%) | 0 (0.0%) |
| $17,500 to $19,999 | 0 (0.0%) | 0 (0.0%) |
| $20,000 to $22,499 | 0 (0.0%) | 0 (0.0%) |
| $22,500 to $24,999 | 4 (3.5%) | 0 (0.0%) |
| $25,000 to $29,999 | 8 (6.9%) | 24 (21.8%) |
| $30,000 to $34,999 | 0 (0.0%) | 26 (23.6%) |
| $35,000 to $39,999 | 17 (14.7%) | 0 (0.0%) |
| $40,000 to $44,999 | 8 (6.9%) | 9 (8.2%) |
| $45,000 to $49,999 | 11 (9.5%) | 2 (1.8%) |
| $50,000 to $54,999 | 1 (0.9%) | 0 (0.0%) |
| $55,000 to $64,999 | 4 (3.5%) | 7 (6.4%) |
| $65,000 to $74,999 | 2 (1.7%) | 0 (0.0%) |
| $75,000 to $99,999 | 26 (22.4%) | 0 (0.0%) |
| $100,000+ | 0 (0.0%) | 10 (9.1%) |
| Total | 116 (100.0%) | 110 (100.0%) |
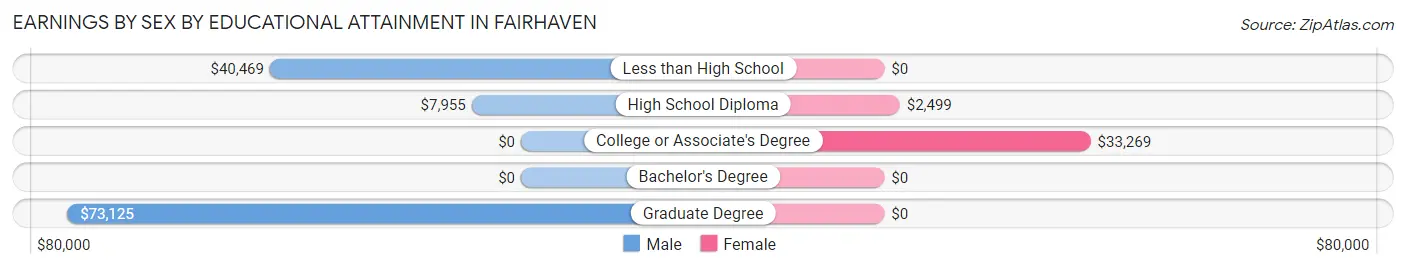
Earnings by Sex by Educational Attainment in Fairhaven
| Educational Attainment | Male Income | Female Income |
| Less than High School | $40,469 | $0 |
| High School Diploma | $7,955 | $2,499 |
| College or Associate's Degree | - | - |
| Bachelor's Degree | - | - |
| Graduate Degree | $73,125 | $0 |
| Total | - | - |
Family Income in Fairhaven
Family Income Brackets in Fairhaven
According to the Fairhaven family income data, there are 26 families falling into the $100,000 to $149,999 income range, which is the most common income bracket and makes up 33.3% of all families.
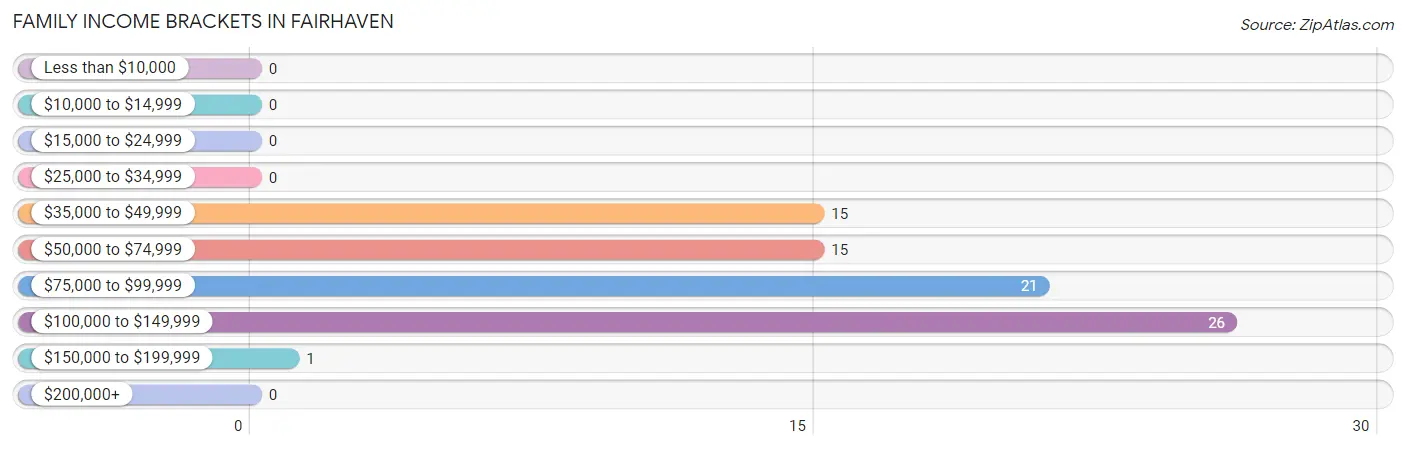
| Income Bracket | # Families | % Families |
| Less than $10,000 | 0 | 0.0% |
| $10,000 to $14,999 | 0 | 0.0% |
| $15,000 to $24,999 | 0 | 0.0% |
| $25,000 to $34,999 | 0 | 0.0% |
| $35,000 to $49,999 | 15 | 19.2% |
| $50,000 to $74,999 | 15 | 19.2% |
| $75,000 to $99,999 | 21 | 26.9% |
| $100,000 to $149,999 | 26 | 33.3% |
| $150,000 to $199,999 | 1 | 1.3% |
| $200,000+ | 0 | 0.0% |
Family Income by Famaliy Size in Fairhaven
2-person families (61 | 78.2%) account for the highest median family income in Fairhaven with $77,417 per family, while 2-person families (61 | 78.2%) have the highest median income of $38,708 per family member.
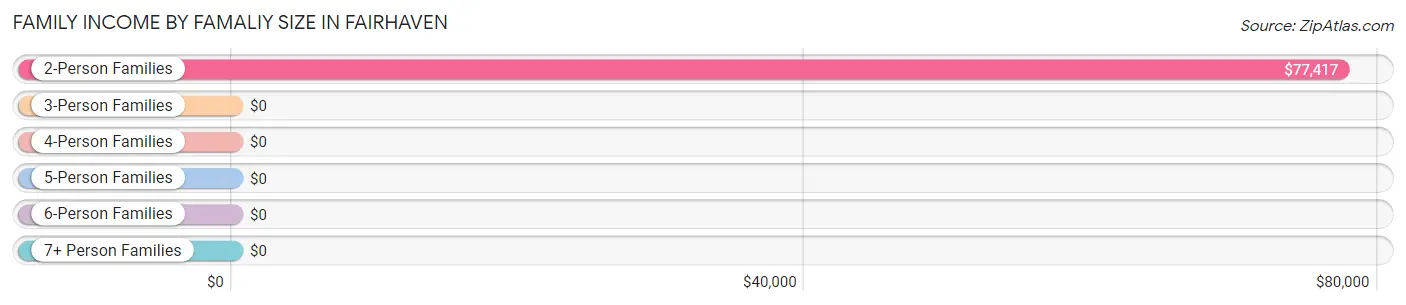
| Income Bracket | # Families | Median Income |
| 2-Person Families | 61 (78.2%) | $77,417 |
| 3-Person Families | 14 (17.9%) | $0 |
| 4-Person Families | 1 (1.3%) | $0 |
| 5-Person Families | 2 (2.6%) | $0 |
| 6-Person Families | 0 (0.0%) | $0 |
| 7+ Person Families | 0 (0.0%) | $0 |
| Total | 78 (100.0%) | $76,500 |
Family Income by Number of Earners in Fairhaven
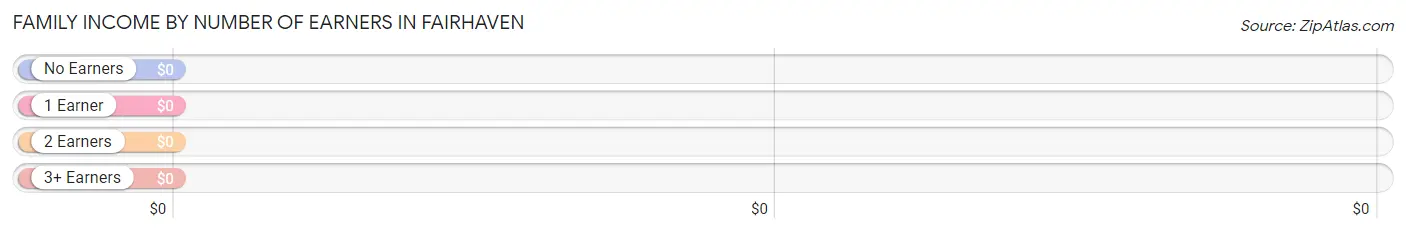
| Number of Earners | # Families | Median Income |
| No Earners | 18 (23.1%) | $0 |
| 1 Earner | 23 (29.5%) | $0 |
| 2 Earners | 35 (44.9%) | $0 |
| 3+ Earners | 2 (2.6%) | $0 |
| Total | 78 (100.0%) | $76,500 |
Household Income in Fairhaven
Household Income Brackets in Fairhaven
With 41 households falling in the category, the $75,000 to $99,999 income range is the most frequent in Fairhaven, accounting for 28.3% of all households.
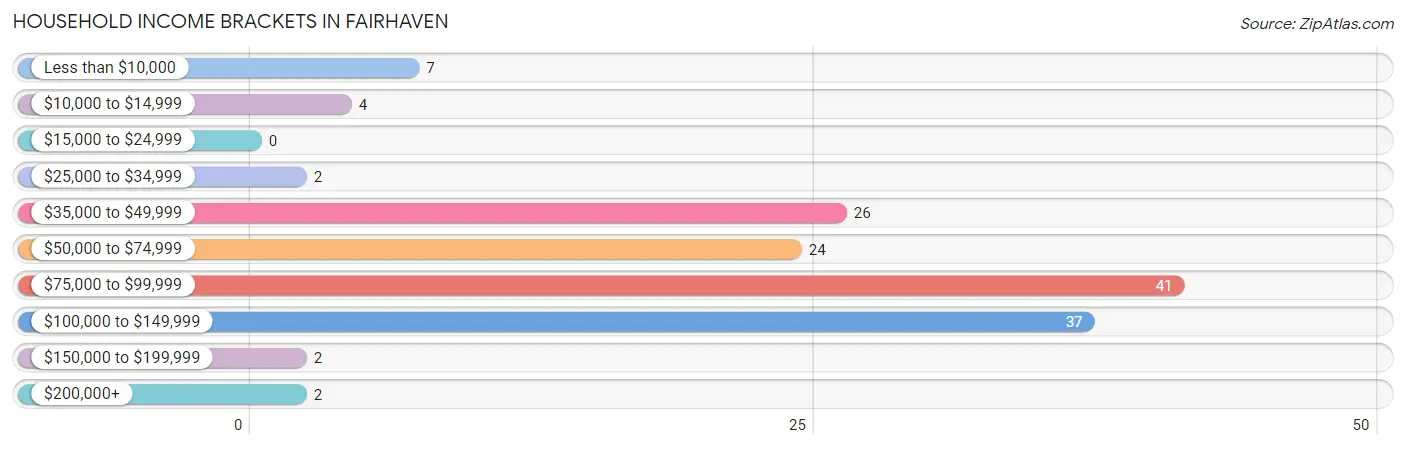
| Income Bracket | # Households | % Households |
| Less than $10,000 | 7 | 4.8% |
| $10,000 to $14,999 | 4 | 2.8% |
| $15,000 to $24,999 | 0 | 0.0% |
| $25,000 to $34,999 | 2 | 1.4% |
| $35,000 to $49,999 | 26 | 17.9% |
| $50,000 to $74,999 | 24 | 16.6% |
| $75,000 to $99,999 | 41 | 28.3% |
| $100,000 to $149,999 | 37 | 25.5% |
| $150,000 to $199,999 | 2 | 1.4% |
| $200,000+ | 2 | 1.4% |
Household Income by Householder Age in Fairhaven
The median household income in Fairhaven is $76,583, with the highest median household income of $96,250 found in the 45 to 64 years age bracket for the primary householder. A total of 64 households (44.1%) fall into this category. Meanwhile, the 15 to 24 years age bracket for the primary householder has the lowest median household income of $0, with 32 households (22.1%) in this group.
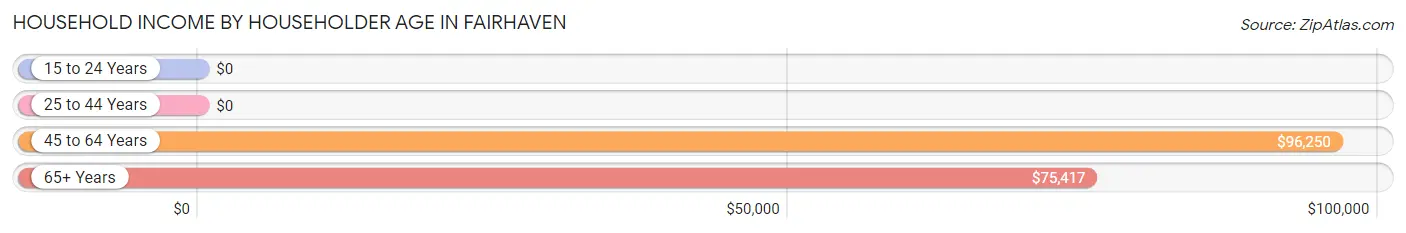
| Income Bracket | # Households | Median Income |
| 15 to 24 Years | 32 (22.1%) | $0 |
| 25 to 44 Years | 16 (11.0%) | $0 |
| 45 to 64 Years | 64 (44.1%) | $96,250 |
| 65+ Years | 33 (22.8%) | $75,417 |
| Total | 145 (100.0%) | $76,583 |
Poverty in Fairhaven
Income Below Poverty by Sex and Age in Fairhaven
With 21.1% poverty level for males and 12.9% for females among the residents of Fairhaven, 35 to 44 year old males and 25 to 34 year old females are the most vulnerable to poverty, with 14 males (82.4%) and 13 females (86.7%) in their respective age groups living below the poverty level.
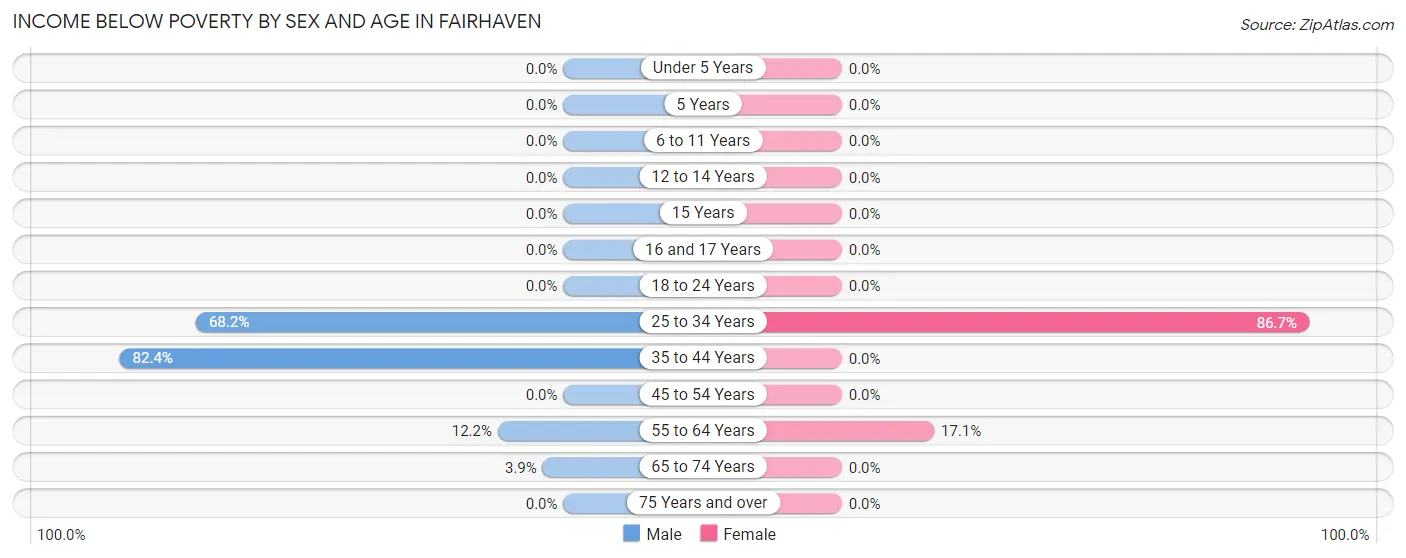
| Age Bracket | Male | Female |
| Under 5 Years | 0 (0.0%) | 0 (0.0%) |
| 5 Years | 0 (0.0%) | 0 (0.0%) |
| 6 to 11 Years | 0 (0.0%) | 0 (0.0%) |
| 12 to 14 Years | 0 (0.0%) | 0 (0.0%) |
| 15 Years | 0 (0.0%) | 0 (0.0%) |
| 16 and 17 Years | 0 (0.0%) | 0 (0.0%) |
| 18 to 24 Years | 0 (0.0%) | 0 (0.0%) |
| 25 to 34 Years | 15 (68.2%) | 13 (86.7%) |
| 35 to 44 Years | 14 (82.4%) | 0 (0.0%) |
| 45 to 54 Years | 0 (0.0%) | 0 (0.0%) |
| 55 to 64 Years | 9 (12.2%) | 6 (17.1%) |
| 65 to 74 Years | 1 (3.8%) | 0 (0.0%) |
| 75 Years and over | 0 (0.0%) | 0 (0.0%) |
| Total | 39 (21.1%) | 19 (12.9%) |
Income Above Poverty by Sex and Age in Fairhaven
According to the poverty statistics in Fairhaven, males aged under 5 years and females aged 6 to 11 years are the age groups that are most secure financially, with 100.0% of males and 100.0% of females in these age groups living above the poverty line.
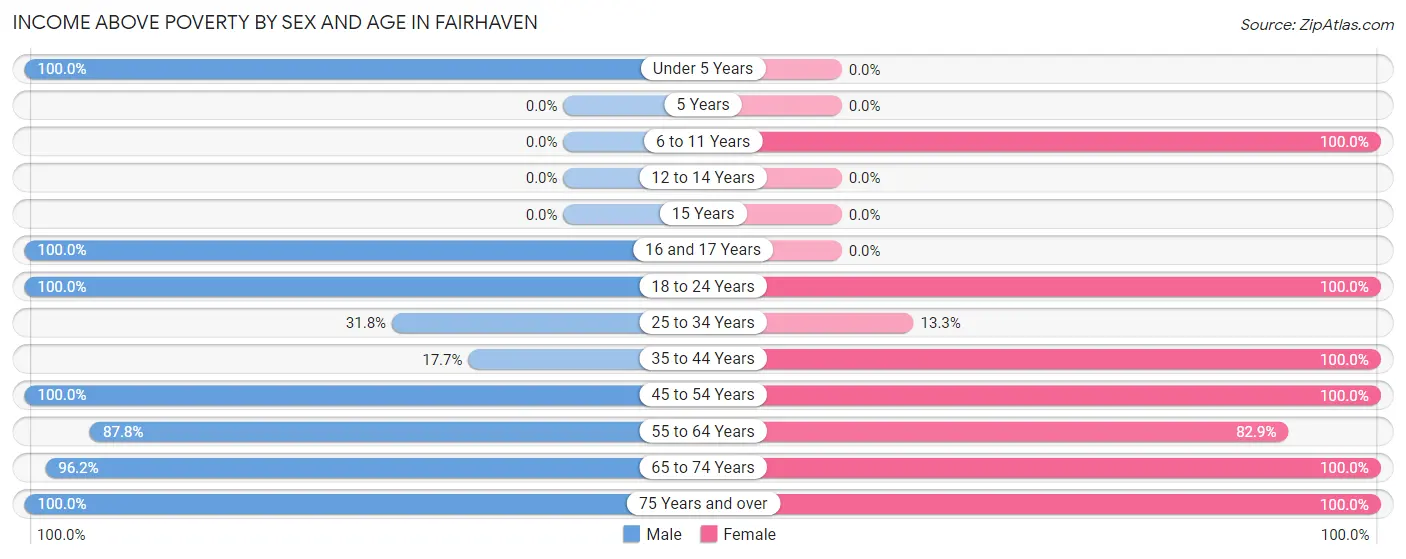
| Age Bracket | Male | Female |
| Under 5 Years | 2 (100.0%) | 0 (0.0%) |
| 5 Years | 0 (0.0%) | 0 (0.0%) |
| 6 to 11 Years | 0 (0.0%) | 6 (100.0%) |
| 12 to 14 Years | 0 (0.0%) | 0 (0.0%) |
| 15 Years | 0 (0.0%) | 0 (0.0%) |
| 16 and 17 Years | 3 (100.0%) | 0 (0.0%) |
| 18 to 24 Years | 32 (100.0%) | 26 (100.0%) |
| 25 to 34 Years | 7 (31.8%) | 2 (13.3%) |
| 35 to 44 Years | 3 (17.6%) | 7 (100.0%) |
| 45 to 54 Years | 3 (100.0%) | 34 (100.0%) |
| 55 to 64 Years | 65 (87.8%) | 29 (82.9%) |
| 65 to 74 Years | 25 (96.2%) | 21 (100.0%) |
| 75 Years and over | 6 (100.0%) | 3 (100.0%) |
| Total | 146 (78.9%) | 128 (87.1%) |
Income Below Poverty Among Married-Couple Families in Fairhaven
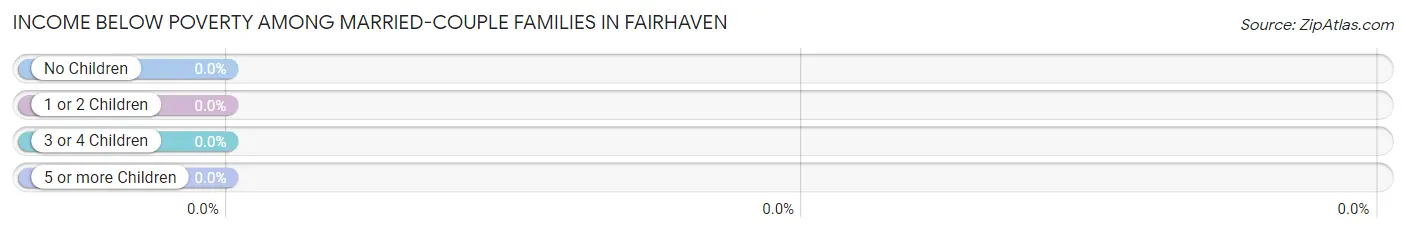
| Children | Above Poverty | Below Poverty |
| No Children | 68 (100.0%) | 0 (0.0%) |
| 1 or 2 Children | 1 (100.0%) | 0 (0.0%) |
| 3 or 4 Children | 0 (0.0%) | 0 (0.0%) |
| 5 or more Children | 0 (0.0%) | 0 (0.0%) |
| Total | 69 (100.0%) | 0 (0.0%) |
Income Below Poverty Among Single-Parent Households in Fairhaven
| Children | Single Father | Single Mother |
| No Children | 0 (0.0%) | 0 (0.0%) |
| 1 or 2 Children | 0 (0.0%) | 0 (0.0%) |
| 3 or 4 Children | 0 (0.0%) | 0 (0.0%) |
| 5 or more Children | 0 (0.0%) | 0 (0.0%) |
| Total | 0 (0.0%) | 0 (0.0%) |
Income Below Poverty Among Married-Couple vs Single-Parent Households in Fairhaven
| Children | Married-Couple Families | Single-Parent Households |
| No Children | 0 (0.0%) | 0 (0.0%) |
| 1 or 2 Children | 0 (0.0%) | 0 (0.0%) |
| 3 or 4 Children | 0 (0.0%) | 0 (0.0%) |
| 5 or more Children | 0 (0.0%) | 0 (0.0%) |
| Total | 0 (0.0%) | 0 (0.0%) |
Race in Fairhaven
The most populous races in Fairhaven are White / Caucasian (278 | 81.5%), Two or more Races (50 | 14.7%), and Hispanic or Latino (22 | 6.5%).
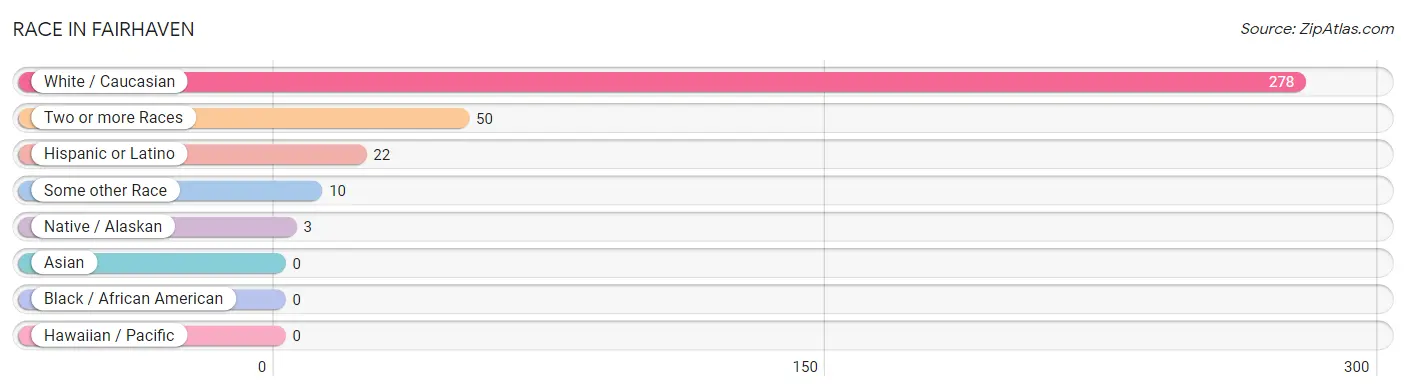
| Race | # Population | % Population |
| Asian | 0 | 0.0% |
| Black / African American | 0 | 0.0% |
| Hawaiian / Pacific | 0 | 0.0% |
| Hispanic or Latino | 22 | 6.5% |
| Native / Alaskan | 3 | 0.9% |
| White / Caucasian | 278 | 81.5% |
| Two or more Races | 50 | 14.7% |
| Some other Race | 10 | 2.9% |
| Total | 341 | 100.0% |
Ancestry in Fairhaven
The most populous ancestries reported in Fairhaven are German (79 | 23.2%), Irish (47 | 13.8%), British (34 | 10.0%), French (22 | 6.5%), and English (21 | 6.2%), together accounting for 59.5% of all Fairhaven residents.
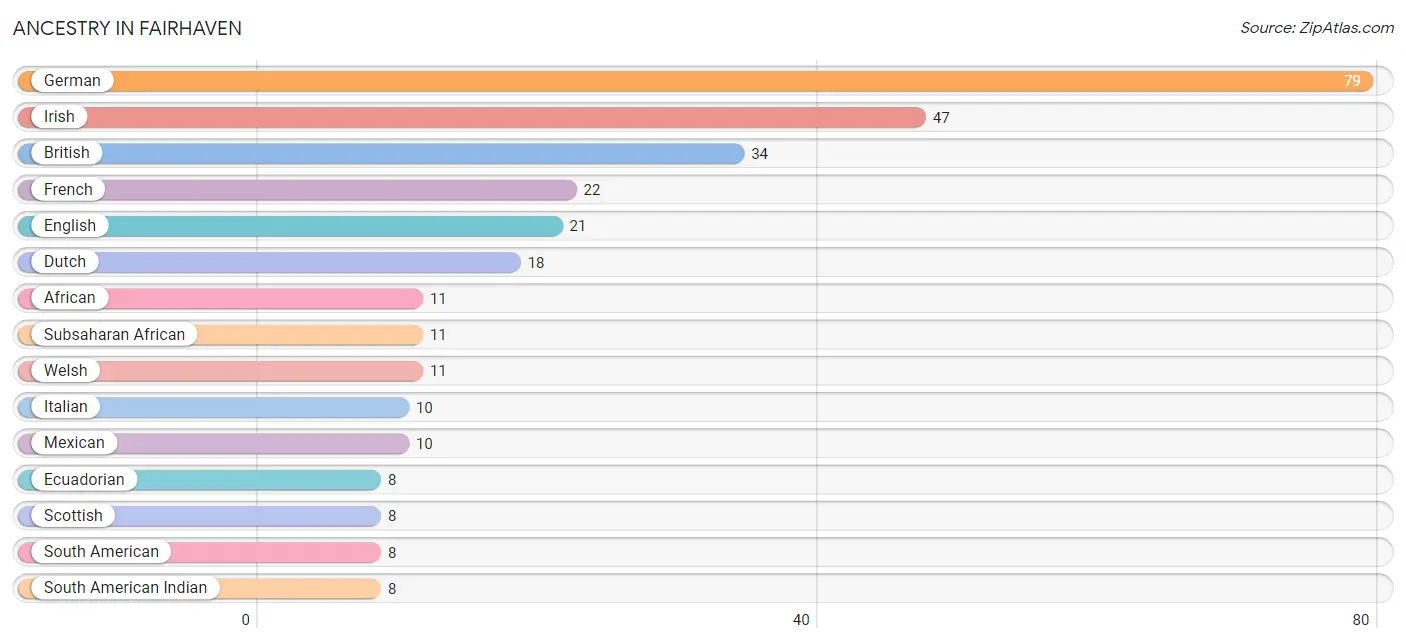
| Ancestry | # Population | % Population |
| African | 11 | 3.2% |
| American | 6 | 1.8% |
| British | 34 | 10.0% |
| Dutch | 18 | 5.3% |
| Ecuadorian | 8 | 2.4% |
| English | 21 | 6.2% |
| European | 3 | 0.9% |
| Finnish | 2 | 0.6% |
| French | 22 | 6.5% |
| German | 79 | 23.2% |
| Irish | 47 | 13.8% |
| Italian | 10 | 2.9% |
| Mexican | 10 | 2.9% |
| Norwegian | 2 | 0.6% |
| Portuguese | 3 | 0.9% |
| Puerto Rican | 4 | 1.2% |
| Scotch-Irish | 6 | 1.8% |
| Scottish | 8 | 2.4% |
| South American | 8 | 2.4% |
| South American Indian | 8 | 2.4% |
| Subsaharan African | 11 | 3.2% |
| Swedish | 6 | 1.8% |
| Swiss | 4 | 1.2% |
| Ukrainian | 2 | 0.6% |
| Welsh | 11 | 3.2% | View All 25 Rows |
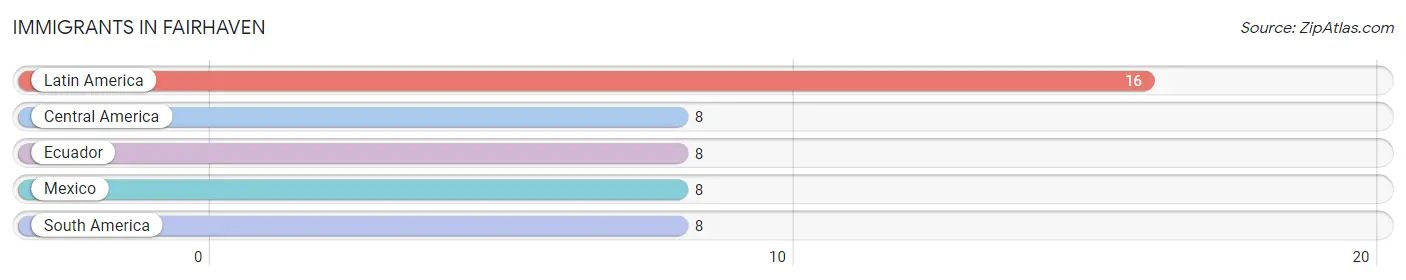
Immigrants in Fairhaven
The most numerous immigrant groups reported in Fairhaven came from Latin America (16 | 4.7%), Central America (8 | 2.4%), Ecuador (8 | 2.4%), Mexico (8 | 2.4%), and South America (8 | 2.4%), together accounting for 14.1% of all Fairhaven residents.
| Immigration Origin | # Population | % Population |
| Central America | 8 | 2.4% |
| Ecuador | 8 | 2.4% |
| Latin America | 16 | 4.7% |
| Mexico | 8 | 2.4% |
| South America | 8 | 2.4% | View All 5 Rows |
Sex and Age in Fairhaven
Sex and Age in Fairhaven
The most populous age groups in Fairhaven are 60 to 64 Years (42 | 21.6%) for men and 20 to 24 Years (24 | 16.3%) for women.
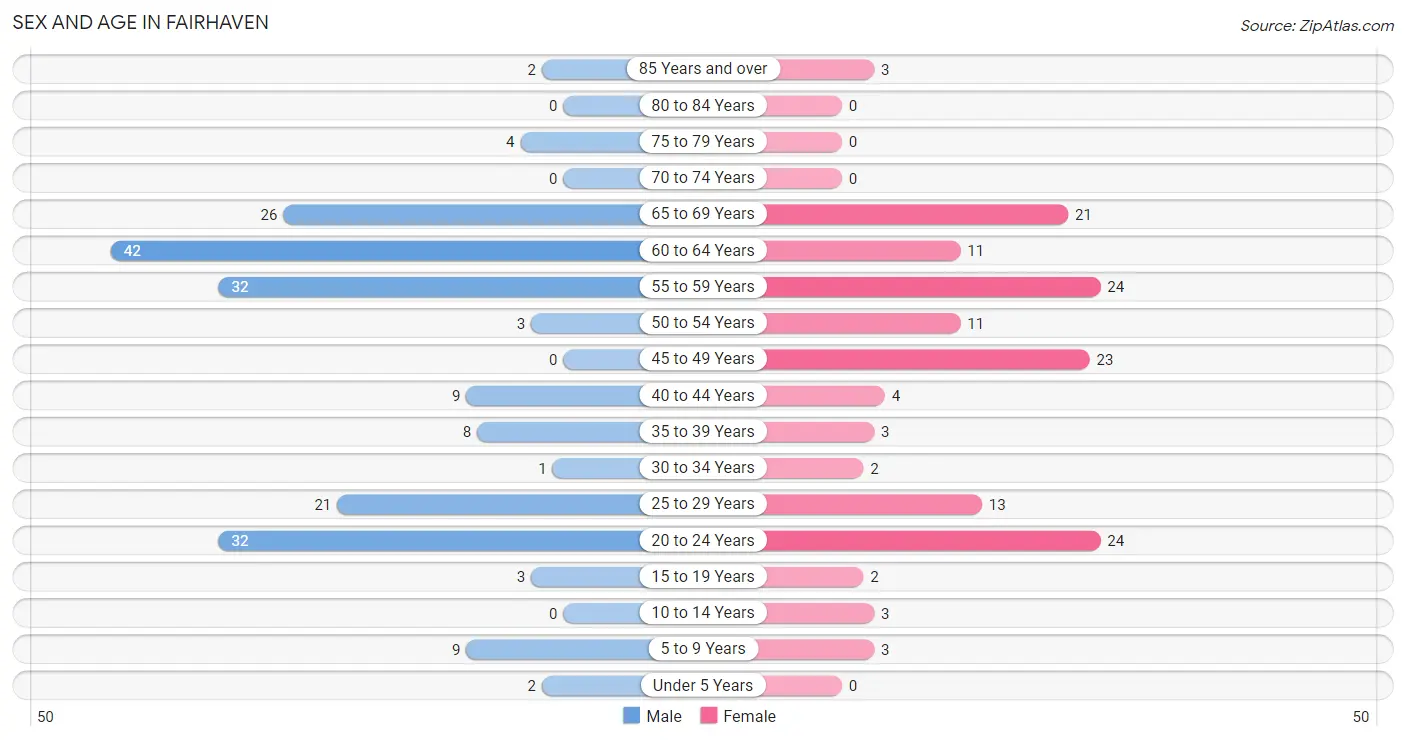
| Age Bracket | Male | Female |
| Under 5 Years | 2 (1.0%) | 0 (0.0%) |
| 5 to 9 Years | 9 (4.6%) | 3 (2.0%) |
| 10 to 14 Years | 0 (0.0%) | 3 (2.0%) |
| 15 to 19 Years | 3 (1.5%) | 2 (1.4%) |
| 20 to 24 Years | 32 (16.5%) | 24 (16.3%) |
| 25 to 29 Years | 21 (10.8%) | 13 (8.8%) |
| 30 to 34 Years | 1 (0.5%) | 2 (1.4%) |
| 35 to 39 Years | 8 (4.1%) | 3 (2.0%) |
| 40 to 44 Years | 9 (4.6%) | 4 (2.7%) |
| 45 to 49 Years | 0 (0.0%) | 23 (15.7%) |
| 50 to 54 Years | 3 (1.5%) | 11 (7.5%) |
| 55 to 59 Years | 32 (16.5%) | 24 (16.3%) |
| 60 to 64 Years | 42 (21.6%) | 11 (7.5%) |
| 65 to 69 Years | 26 (13.4%) | 21 (14.3%) |
| 70 to 74 Years | 0 (0.0%) | 0 (0.0%) |
| 75 to 79 Years | 4 (2.1%) | 0 (0.0%) |
| 80 to 84 Years | 0 (0.0%) | 0 (0.0%) |
| 85 Years and over | 2 (1.0%) | 3 (2.0%) |
| Total | 194 (100.0%) | 147 (100.0%) |
Families and Households in Fairhaven
Median Family Size in Fairhaven
The median family size in Fairhaven is 2.26 persons per family, with single male/father families (7 | 9.0%) accounting for the largest median family size of 3.29 persons per family. On the other hand, married-couple families (69 | 88.5%) represent the smallest median family size with 2.14 persons per family.
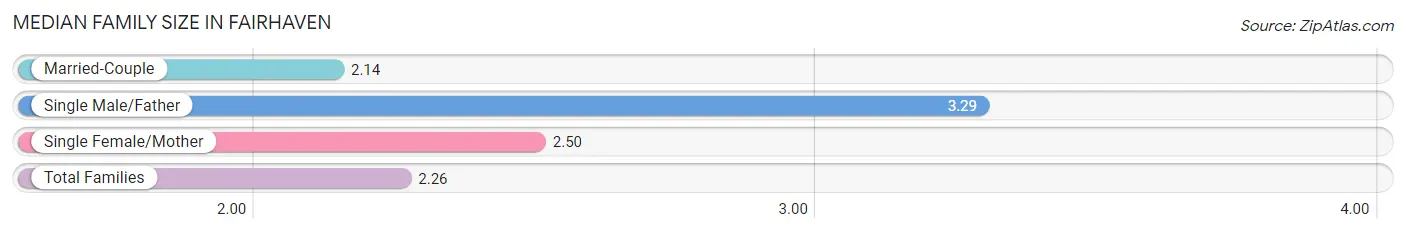
| Family Type | # Families | Family Size |
| Married-Couple | 69 (88.5%) | 2.14 |
| Single Male/Father | 7 (9.0%) | 3.29 |
| Single Female/Mother | 2 (2.6%) | 2.50 |
| Total Families | 78 (100.0%) | 2.26 |
Median Household Size in Fairhaven
The median household size in Fairhaven is 2.23 persons per household, with single male/father households (7 | 4.8%) accounting for the largest median household size of 6.43 persons per household. non-family households (67 | 46.2%) represent the smallest median household size with 1.88 persons per household.
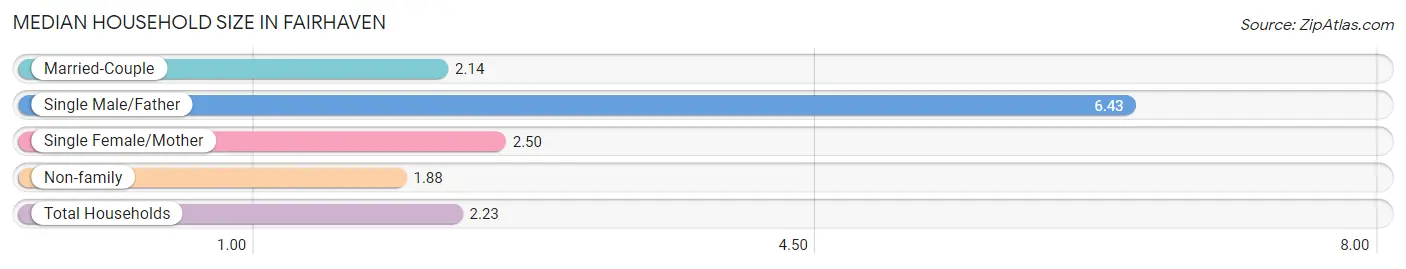
| Household Type | # Households | Household Size |
| Married-Couple | 69 (47.6%) | 2.14 |
| Single Male/Father | 7 (4.8%) | 6.43 |
| Single Female/Mother | 2 (1.4%) | 2.50 |
| Non-family | 67 (46.2%) | 1.88 |
| Total Households | 145 (100.0%) | 2.23 |
Household Size by Marriage Status in Fairhaven
Out of a total of 145 households in Fairhaven, 78 (53.8%) are family households, while 67 (46.2%) are nonfamily households. The most numerous type of family households are 2-person households, comprising 58, and the most common type of nonfamily households are 1-person households, comprising 29.
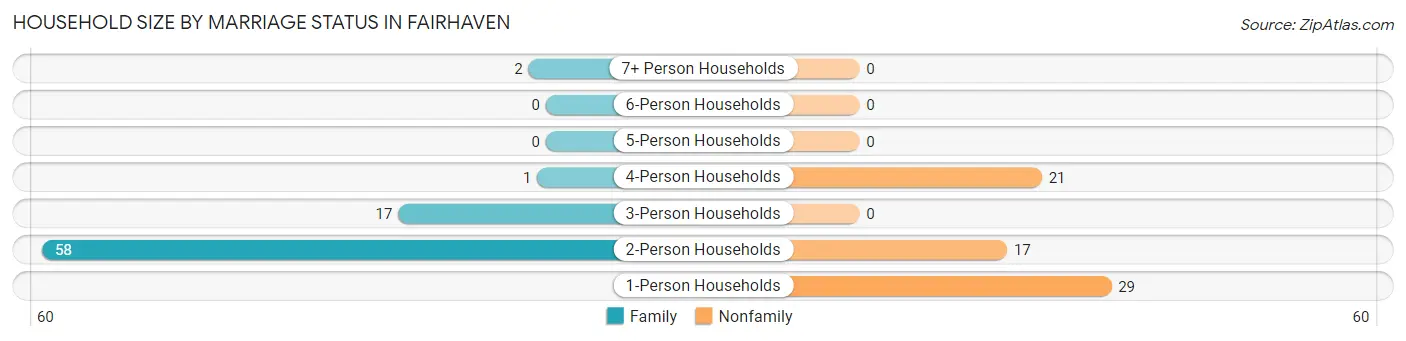
| Household Size | Family Households | Nonfamily Households |
| 1-Person Households | - | 29 (20.0%) |
| 2-Person Households | 58 (40.0%) | 17 (11.7%) |
| 3-Person Households | 17 (11.7%) | 0 (0.0%) |
| 4-Person Households | 1 (0.7%) | 21 (14.5%) |
| 5-Person Households | 0 (0.0%) | 0 (0.0%) |
| 6-Person Households | 0 (0.0%) | 0 (0.0%) |
| 7+ Person Households | 2 (1.4%) | 0 (0.0%) |
| Total | 78 (53.8%) | 67 (46.2%) |
Female Fertility in Fairhaven
Fertility by Age in Fairhaven
| Age Bracket | Women with Births | Births / 1,000 Women |
| 15 to 19 years | 0 (0.0%) | 0.0 |
| 20 to 34 years | 0 (0.0%) | 0.0 |
| 35 to 50 years | 0 (0.0%) | 0.0 |
| Total | 0 (0.0%) | 0.0 |
Fertility by Age by Marriage Status in Fairhaven
| Age Bracket | Married | Unmarried |
| 15 to 19 years | 0 (0.0%) | 0 (0.0%) |
| 20 to 34 years | 0 (0.0%) | 0 (0.0%) |
| 35 to 50 years | 0 (0.0%) | 0 (0.0%) |
| Total | 0 (0.0%) | 0 (0.0%) |
Fertility by Education in Fairhaven
| Educational Attainment | Women with Births | Births / 1,000 Women |
| Less than High School | 0 (0.0%) | 0.0 |
| High School Diploma | 0 (0.0%) | 0.0 |
| College or Associate's Degree | 0 (0.0%) | 0.0 |
| Bachelor's Degree | 0 (0.0%) | 0.0 |
| Graduate Degree | 0 (0.0%) | 0.0 |
| Total | 0 (0.0%) | 0.0 |
Fertility by Education by Marriage Status in Fairhaven
| Educational Attainment | Married | Unmarried |
| Less than High School | 0 (0.0%) | 0 (0.0%) |
| High School Diploma | 0 (0.0%) | 0 (0.0%) |
| College or Associate's Degree | 0 (0.0%) | 0 (0.0%) |
| Bachelor's Degree | 0 (0.0%) | 0 (0.0%) |
| Graduate Degree | 0 (0.0%) | 0 (0.0%) |
| Total | 0 (0.0%) | 0 (0.0%) |
Employment Characteristics in Fairhaven
Employment by Class of Employer in Fairhaven
Among the 210 employed individuals in Fairhaven, private company employees (113 | 53.8%), self-employed (not incorporated) (46 | 21.9%), and local government employees (30 | 14.3%) make up the most common classes of employment.
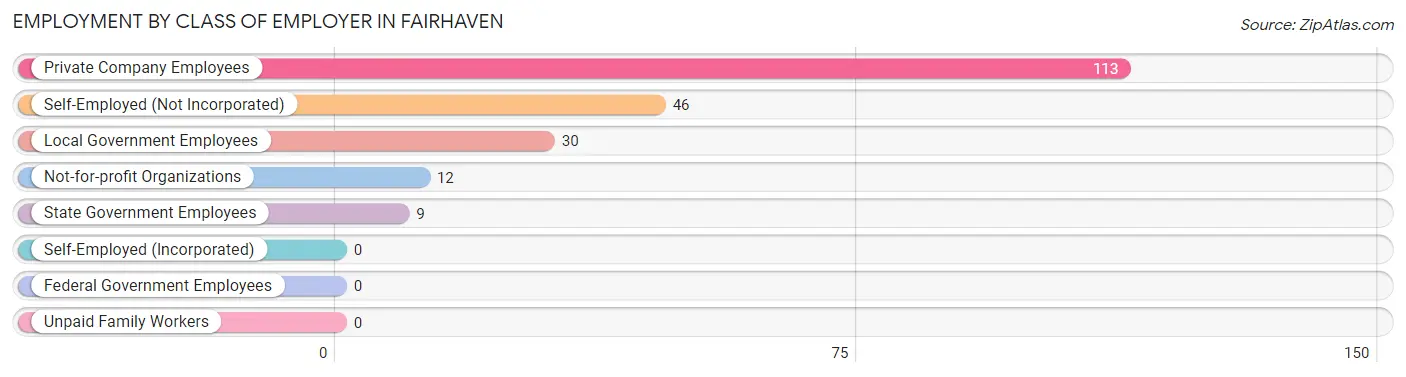
| Employer Class | # Employees | % Employees |
| Private Company Employees | 113 | 53.8% |
| Self-Employed (Incorporated) | 0 | 0.0% |
| Self-Employed (Not Incorporated) | 46 | 21.9% |
| Not-for-profit Organizations | 12 | 5.7% |
| Local Government Employees | 30 | 14.3% |
| State Government Employees | 9 | 4.3% |
| Federal Government Employees | 0 | 0.0% |
| Unpaid Family Workers | 0 | 0.0% |
| Total | 210 | 100.0% |
Employment Status by Age in Fairhaven
According to the labor force statistics for Fairhaven, out of the total population over 16 years of age (324), 69.4% or 225 individuals are in the labor force, with 6.7% or 15 of them unemployed. The age group with the highest labor force participation rate is 16 to 19 years, with 100.0% or 5 individuals in the labor force. Within the labor force, the 25 to 29 years age range has the highest percentage of unemployed individuals, with 38.2% or 13 of them being unemployed.
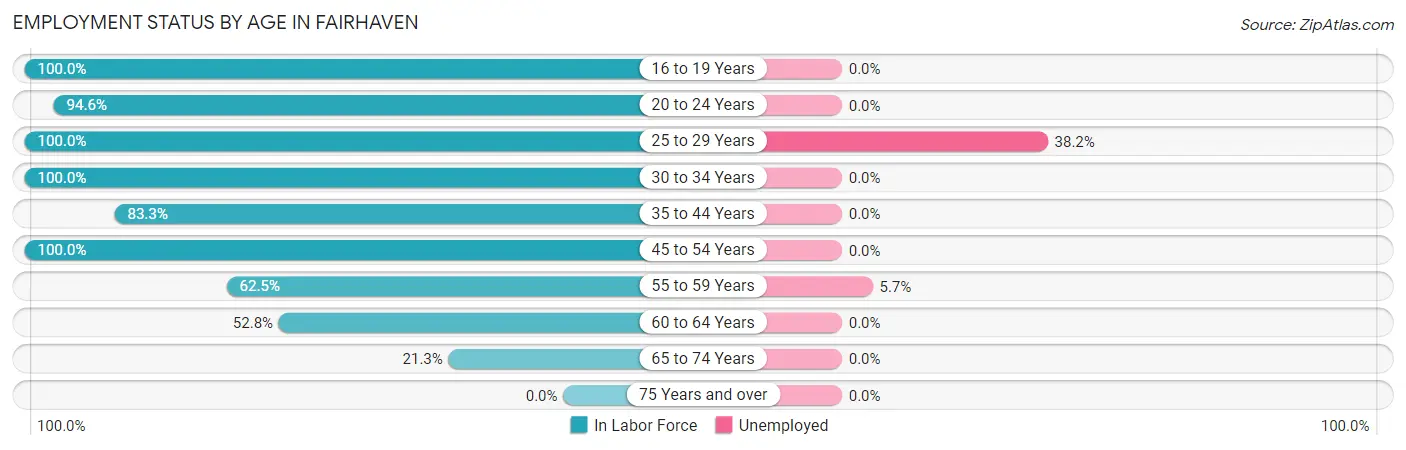
| Age Bracket | In Labor Force | Unemployed |
| 16 to 19 Years | 5 (100.0%) | 0 (0.0%) |
| 20 to 24 Years | 53 (94.6%) | 0 (0.0%) |
| 25 to 29 Years | 34 (100.0%) | 13 (38.2%) |
| 30 to 34 Years | 3 (100.0%) | 0 (0.0%) |
| 35 to 44 Years | 20 (83.3%) | 0 (0.0%) |
| 45 to 54 Years | 37 (100.0%) | 0 (0.0%) |
| 55 to 59 Years | 35 (62.5%) | 2 (5.7%) |
| 60 to 64 Years | 28 (52.8%) | 0 (0.0%) |
| 65 to 74 Years | 10 (21.3%) | 0 (0.0%) |
| 75 Years and over | 0 (0.0%) | 0 (0.0%) |
| Total | 225 (69.4%) | 15 (6.7%) |
Employment Status by Educational Attainment in Fairhaven
According to labor force statistics for Fairhaven, 75.8% of individuals (157) out of the total population between 25 and 64 years of age (207) are in the labor force, with 9.6% or 15 of them being unemployed. The group with the highest labor force participation rate are those with the educational attainment of bachelor's degree or higher, with 91.2% or 31 individuals in the labor force. Within the labor force, individuals with high school diploma education have the highest percentage of unemployment, with 31.7% or 13 of them being unemployed.
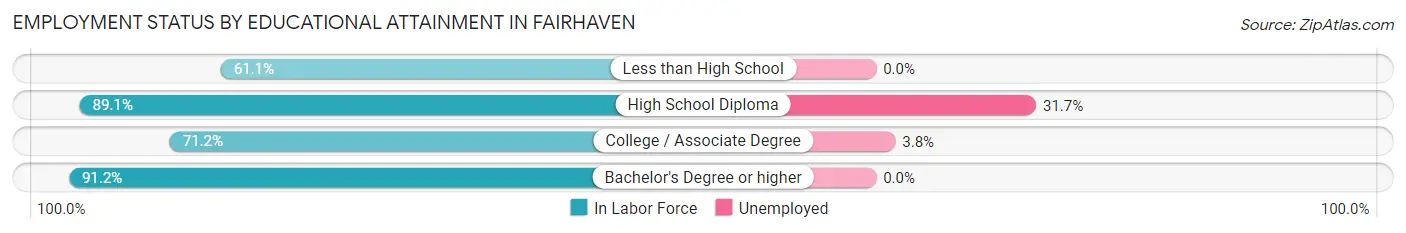
| Educational Attainment | In Labor Force | Unemployed |
| Less than High School | 33 (61.1%) | 0 (0.0%) |
| High School Diploma | 41 (89.1%) | 15 (31.7%) |
| College / Associate Degree | 52 (71.2%) | 3 (3.8%) |
| Bachelor's Degree or higher | 31 (91.2%) | 0 (0.0%) |
| Total | 157 (75.8%) | 20 (9.6%) |
Employment Occupations by Sex in Fairhaven
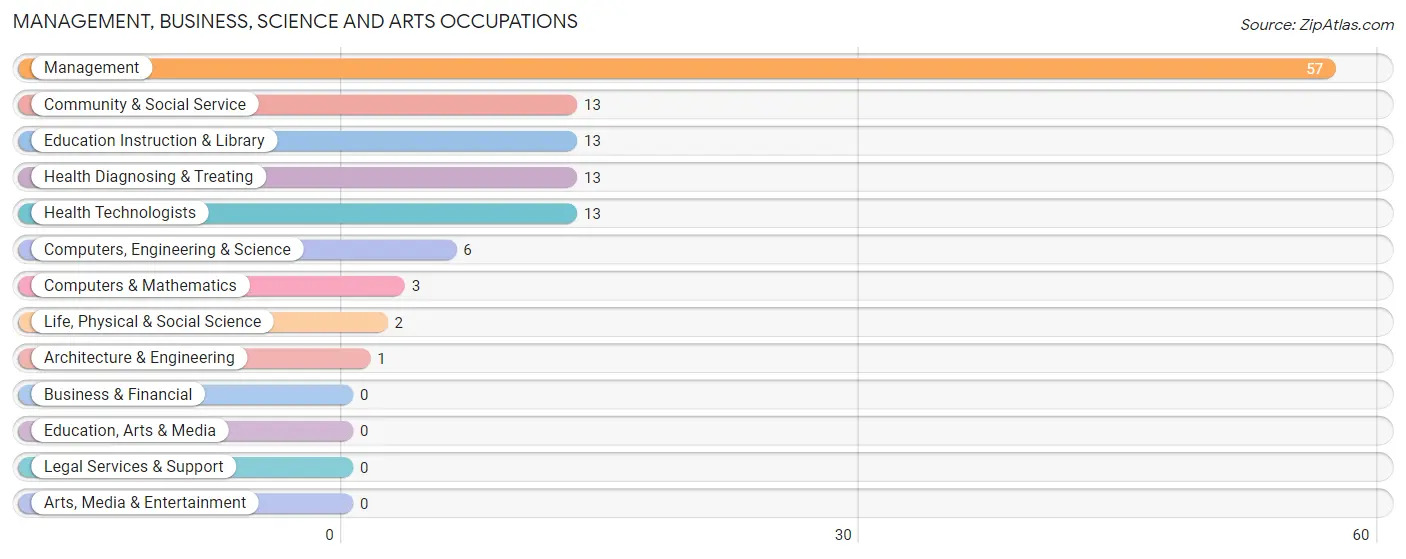
Management, Business, Science and Arts Occupations
The most common Management, Business, Science and Arts occupations in Fairhaven are Management (57 | 27.1%), Community & Social Service (13 | 6.2%), Education Instruction & Library (13 | 6.2%), Health Diagnosing & Treating (13 | 6.2%), and Health Technologists (13 | 6.2%).
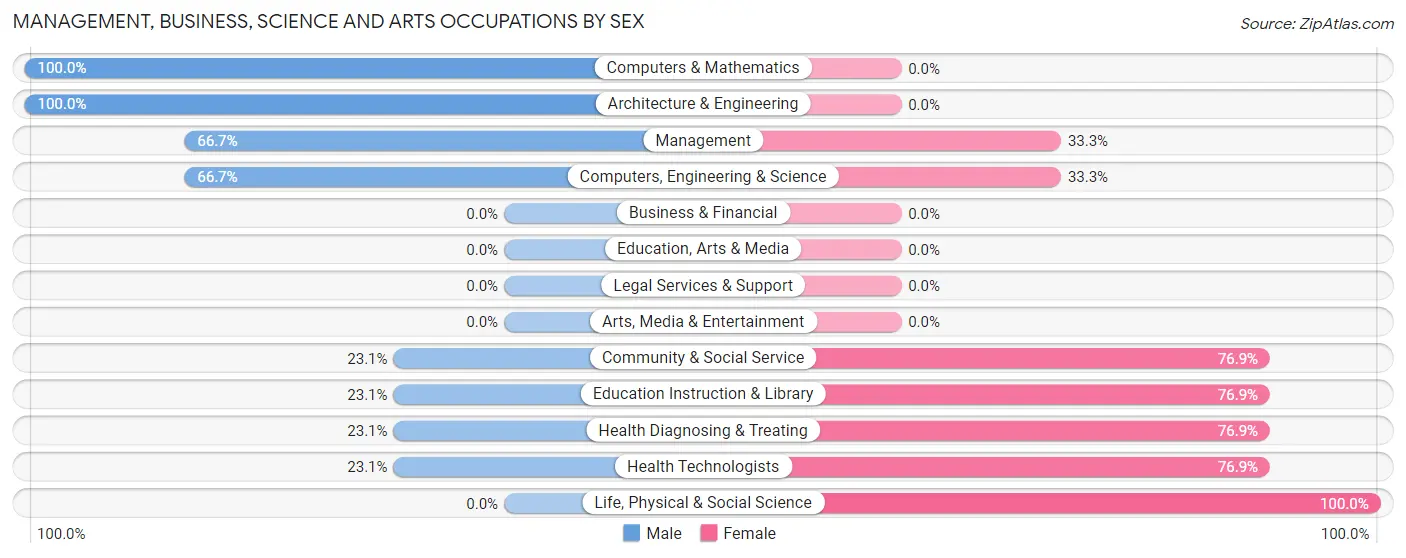
Management, Business, Science and Arts Occupations by Sex
Within the Management, Business, Science and Arts occupations in Fairhaven, the most male-oriented occupations are Computers & Mathematics (100.0%), Architecture & Engineering (100.0%), and Management (66.7%), while the most female-oriented occupations are Life, Physical & Social Science (100.0%), Community & Social Service (76.9%), and Education Instruction & Library (76.9%).
| Occupation | Male | Female |
| Management | 38 (66.7%) | 19 (33.3%) |
| Business & Financial | 0 (0.0%) | 0 (0.0%) |
| Computers, Engineering & Science | 4 (66.7%) | 2 (33.3%) |
| Computers & Mathematics | 3 (100.0%) | 0 (0.0%) |
| Architecture & Engineering | 1 (100.0%) | 0 (0.0%) |
| Life, Physical & Social Science | 0 (0.0%) | 2 (100.0%) |
| Community & Social Service | 3 (23.1%) | 10 (76.9%) |
| Education, Arts & Media | 0 (0.0%) | 0 (0.0%) |
| Legal Services & Support | 0 (0.0%) | 0 (0.0%) |
| Education Instruction & Library | 3 (23.1%) | 10 (76.9%) |
| Arts, Media & Entertainment | 0 (0.0%) | 0 (0.0%) |
| Health Diagnosing & Treating | 3 (23.1%) | 10 (76.9%) |
| Health Technologists | 3 (23.1%) | 10 (76.9%) |
| Total (Category) | 48 (53.9%) | 41 (46.1%) |
| Total (Overall) | 115 (54.8%) | 95 (45.2%) |
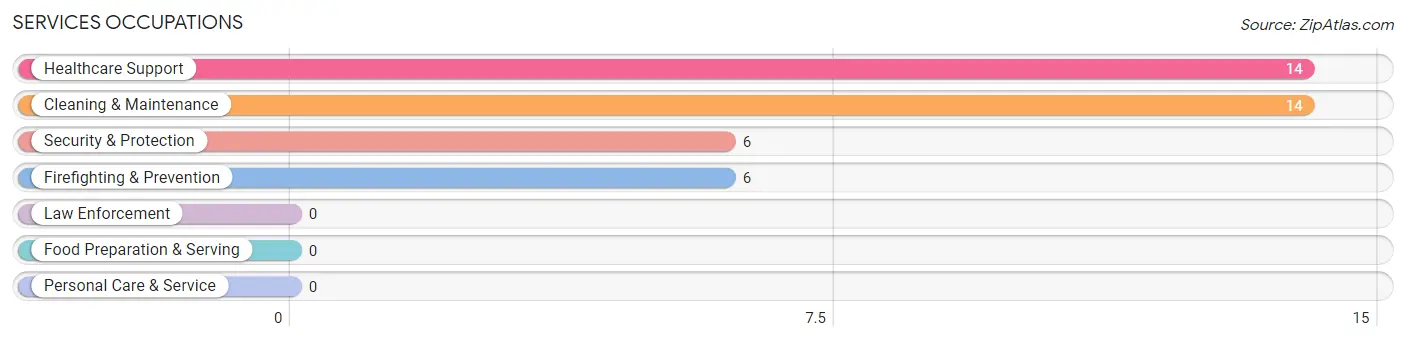
Services Occupations
The most common Services occupations in Fairhaven are Healthcare Support (14 | 6.7%), Cleaning & Maintenance (14 | 6.7%), Security & Protection (6 | 2.9%), and Firefighting & Prevention (6 | 2.9%).
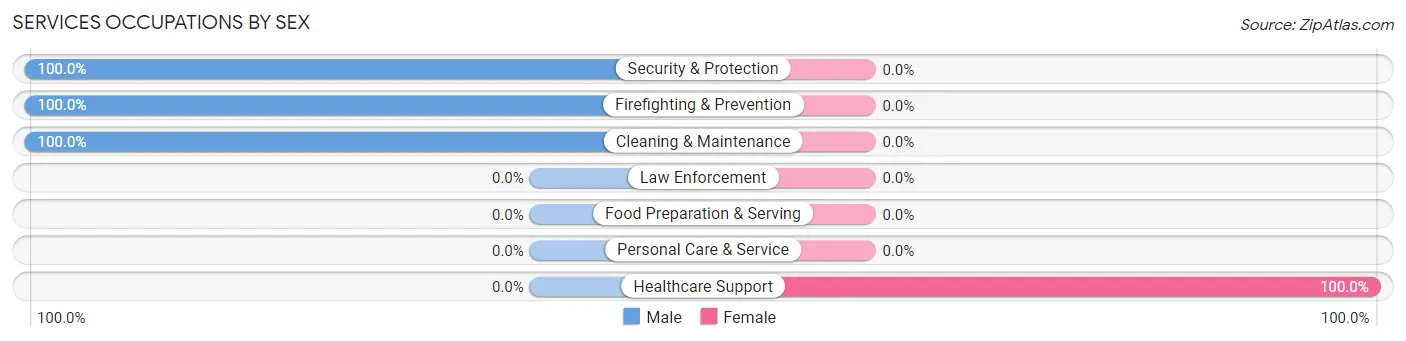
Services Occupations by Sex
| Occupation | Male | Female |
| Healthcare Support | 0 (0.0%) | 14 (100.0%) |
| Security & Protection | 6 (100.0%) | 0 (0.0%) |
| Firefighting & Prevention | 6 (100.0%) | 0 (0.0%) |
| Law Enforcement | 0 (0.0%) | 0 (0.0%) |
| Food Preparation & Serving | 0 (0.0%) | 0 (0.0%) |
| Cleaning & Maintenance | 14 (100.0%) | 0 (0.0%) |
| Personal Care & Service | 0 (0.0%) | 0 (0.0%) |
| Total (Category) | 20 (58.8%) | 14 (41.2%) |
| Total (Overall) | 115 (54.8%) | 95 (45.2%) |
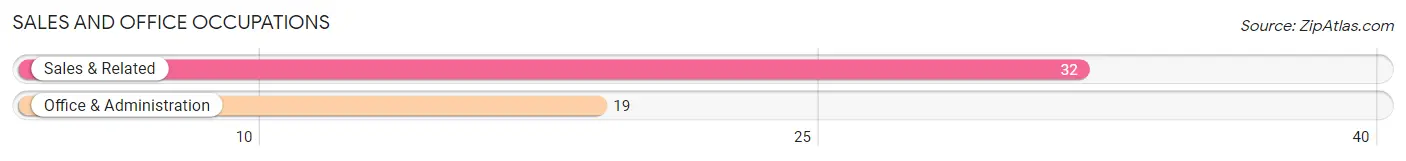
Sales and Office Occupations
The most common Sales and Office occupations in Fairhaven are Sales & Related (32 | 15.2%), and Office & Administration (19 | 9.0%).
Sales and Office Occupations by Sex
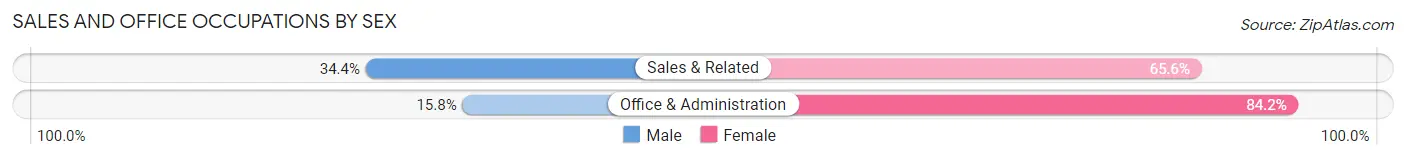
| Occupation | Male | Female |
| Sales & Related | 11 (34.4%) | 21 (65.6%) |
| Office & Administration | 3 (15.8%) | 16 (84.2%) |
| Total (Category) | 14 (27.5%) | 37 (72.6%) |
| Total (Overall) | 115 (54.8%) | 95 (45.2%) |
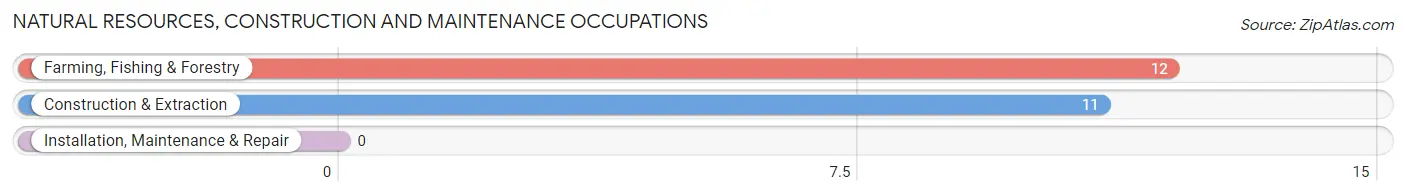
Natural Resources, Construction and Maintenance Occupations
The most common Natural Resources, Construction and Maintenance occupations in Fairhaven are Farming, Fishing & Forestry (12 | 5.7%), and Construction & Extraction (11 | 5.2%).
Natural Resources, Construction and Maintenance Occupations by Sex
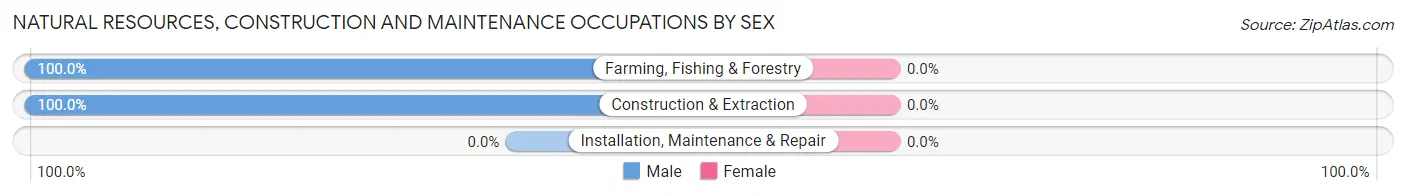
| Occupation | Male | Female |
| Farming, Fishing & Forestry | 12 (100.0%) | 0 (0.0%) |
| Construction & Extraction | 11 (100.0%) | 0 (0.0%) |
| Installation, Maintenance & Repair | 0 (0.0%) | 0 (0.0%) |
| Total (Category) | 23 (100.0%) | 0 (0.0%) |
| Total (Overall) | 115 (54.8%) | 95 (45.2%) |
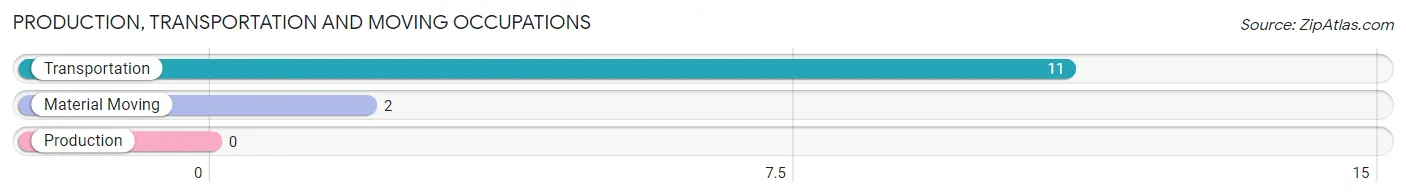
Production, Transportation and Moving Occupations
The most common Production, Transportation and Moving occupations in Fairhaven are Transportation (11 | 5.2%), and Material Moving (2 | 0.9%).
Production, Transportation and Moving Occupations by Sex
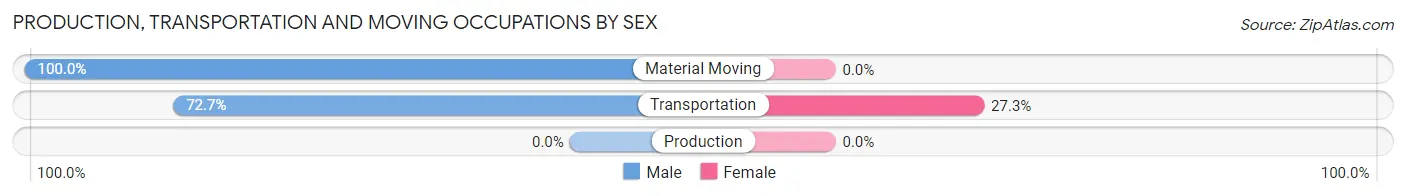
| Occupation | Male | Female |
| Production | 0 (0.0%) | 0 (0.0%) |
| Transportation | 8 (72.7%) | 3 (27.3%) |
| Material Moving | 2 (100.0%) | 0 (0.0%) |
| Total (Category) | 10 (76.9%) | 3 (23.1%) |
| Total (Overall) | 115 (54.8%) | 95 (45.2%) |
Employment Industries by Sex in Fairhaven
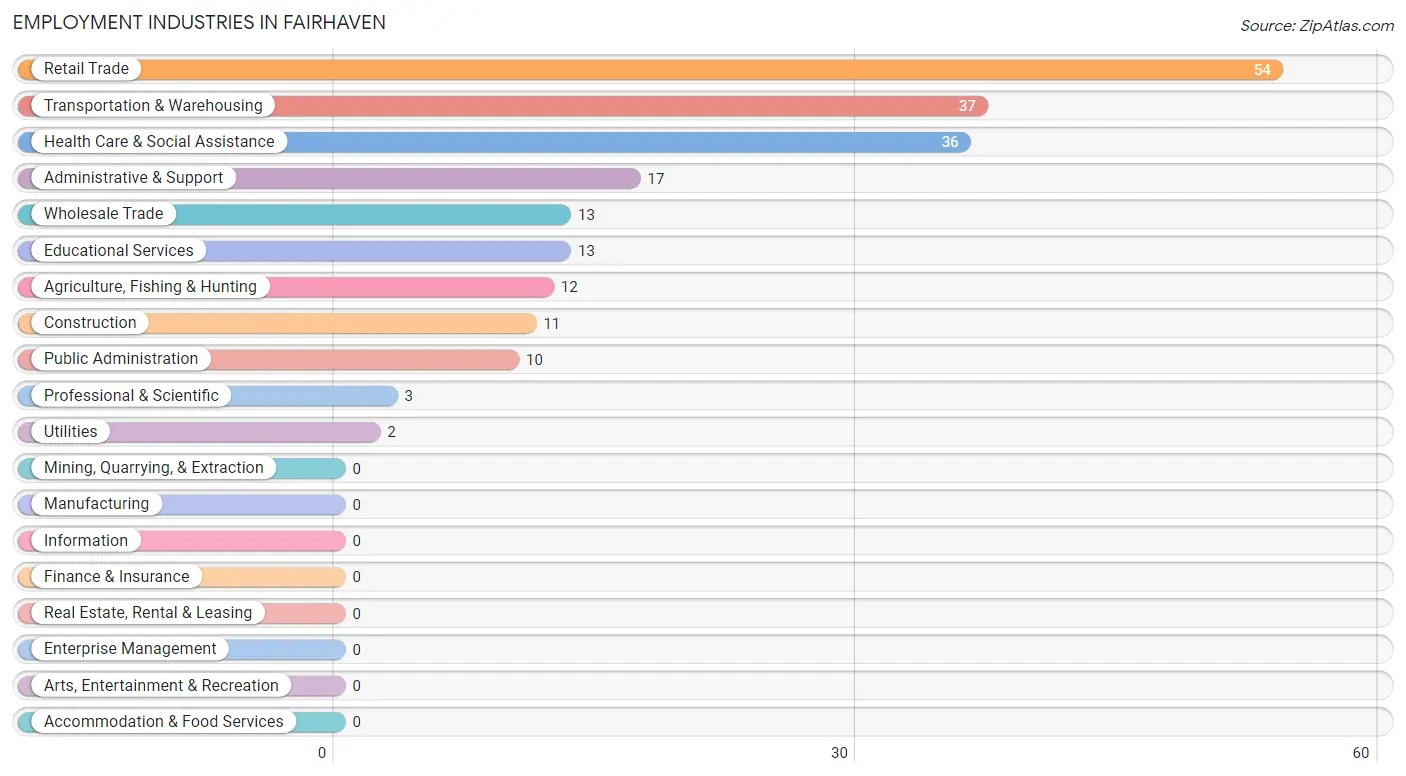
Employment Industries in Fairhaven
The major employment industries in Fairhaven include Retail Trade (54 | 25.7%), Transportation & Warehousing (37 | 17.6%), Health Care & Social Assistance (36 | 17.1%), Administrative & Support (17 | 8.1%), and Wholesale Trade (13 | 6.2%).
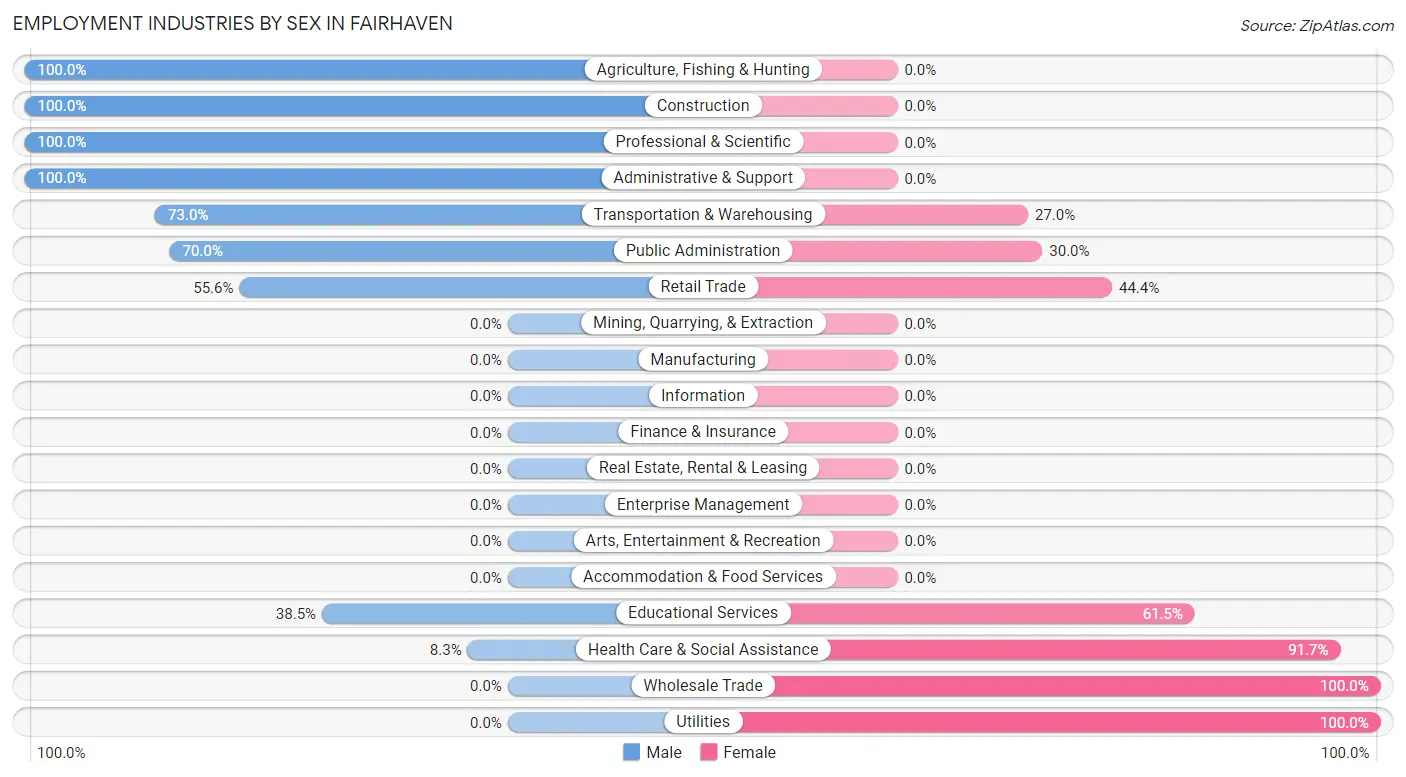
Employment Industries by Sex in Fairhaven
The Fairhaven industries that see more men than women are Agriculture, Fishing & Hunting (100.0%), Construction (100.0%), and Professional & Scientific (100.0%), whereas the industries that tend to have a higher number of women are Wholesale Trade (100.0%), Utilities (100.0%), and Health Care & Social Assistance (91.7%).
| Industry | Male | Female |
| Agriculture, Fishing & Hunting | 12 (100.0%) | 0 (0.0%) |
| Mining, Quarrying, & Extraction | 0 (0.0%) | 0 (0.0%) |
| Construction | 11 (100.0%) | 0 (0.0%) |
| Manufacturing | 0 (0.0%) | 0 (0.0%) |
| Wholesale Trade | 0 (0.0%) | 13 (100.0%) |
| Retail Trade | 30 (55.6%) | 24 (44.4%) |
| Transportation & Warehousing | 27 (73.0%) | 10 (27.0%) |
| Utilities | 0 (0.0%) | 2 (100.0%) |
| Information | 0 (0.0%) | 0 (0.0%) |
| Finance & Insurance | 0 (0.0%) | 0 (0.0%) |
| Real Estate, Rental & Leasing | 0 (0.0%) | 0 (0.0%) |
| Professional & Scientific | 3 (100.0%) | 0 (0.0%) |
| Enterprise Management | 0 (0.0%) | 0 (0.0%) |
| Administrative & Support | 17 (100.0%) | 0 (0.0%) |
| Educational Services | 5 (38.5%) | 8 (61.5%) |
| Health Care & Social Assistance | 3 (8.3%) | 33 (91.7%) |
| Arts, Entertainment & Recreation | 0 (0.0%) | 0 (0.0%) |
| Accommodation & Food Services | 0 (0.0%) | 0 (0.0%) |
| Public Administration | 7 (70.0%) | 3 (30.0%) |
| Total | 115 (54.8%) | 95 (45.2%) |
Education in Fairhaven
School Enrollment in Fairhaven
The most common levels of schooling among the 50 students in Fairhaven are graduate / professional (21 | 42.0%), elementary school (12 | 24.0%), and college / undergraduate (11 | 22.0%).
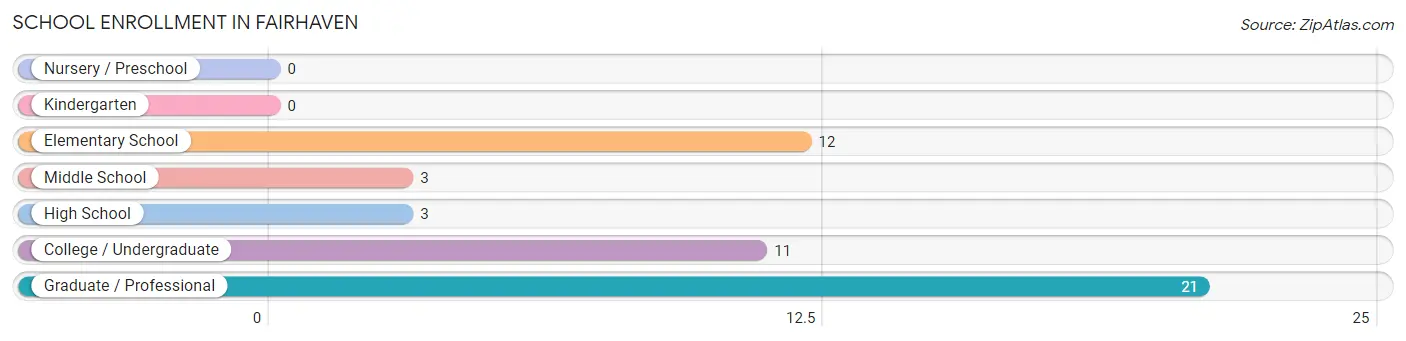
| School Level | # Students | % Students |
| Nursery / Preschool | 0 | 0.0% |
| Kindergarten | 0 | 0.0% |
| Elementary School | 12 | 24.0% |
| Middle School | 3 | 6.0% |
| High School | 3 | 6.0% |
| College / Undergraduate | 11 | 22.0% |
| Graduate / Professional | 21 | 42.0% |
| Total | 50 | 100.0% |
School Enrollment by Age by Funding Source in Fairhaven
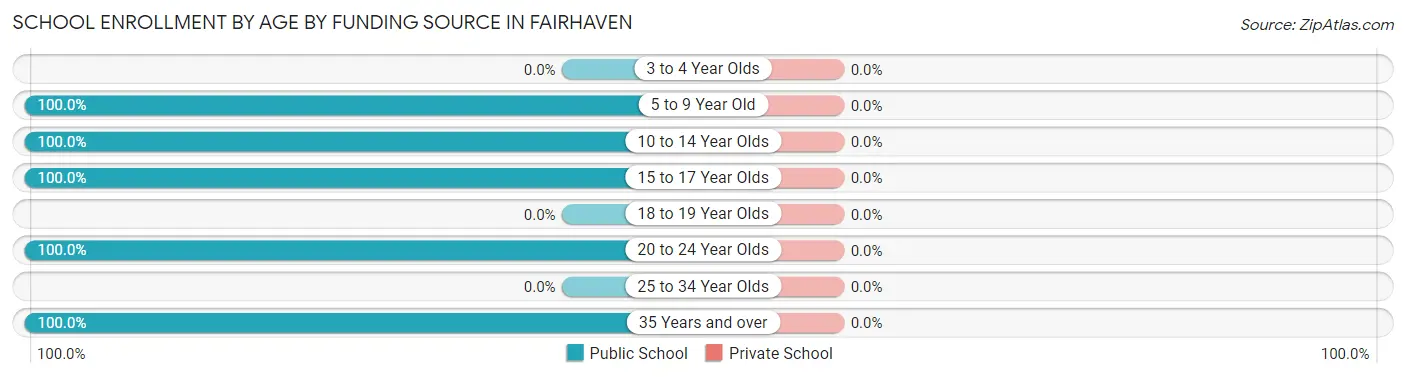
| Age Bracket | Public School | Private School |
| 3 to 4 Year Olds | 0 (0.0%) | 0 (0.0%) |
| 5 to 9 Year Old | 12 (100.0%) | 0 (0.0%) |
| 10 to 14 Year Olds | 3 (100.0%) | 0 (0.0%) |
| 15 to 17 Year Olds | 3 (100.0%) | 0 (0.0%) |
| 18 to 19 Year Olds | 0 (0.0%) | 0 (0.0%) |
| 20 to 24 Year Olds | 21 (100.0%) | 0 (0.0%) |
| 25 to 34 Year Olds | 0 (0.0%) | 0 (0.0%) |
| 35 Years and over | 11 (100.0%) | 0 (0.0%) |
| Total | 50 (100.0%) | 0 (0.0%) |
Educational Attainment by Field of Study in Fairhaven
Science & technology (9 | 22.0%), education (8 | 19.5%), social sciences (5 | 12.2%), literature & languages (5 | 12.2%), and bio, nature & agricultural (4 | 9.8%) are the most common fields of study among 41 individuals in Fairhaven who have obtained a bachelor's degree or higher.
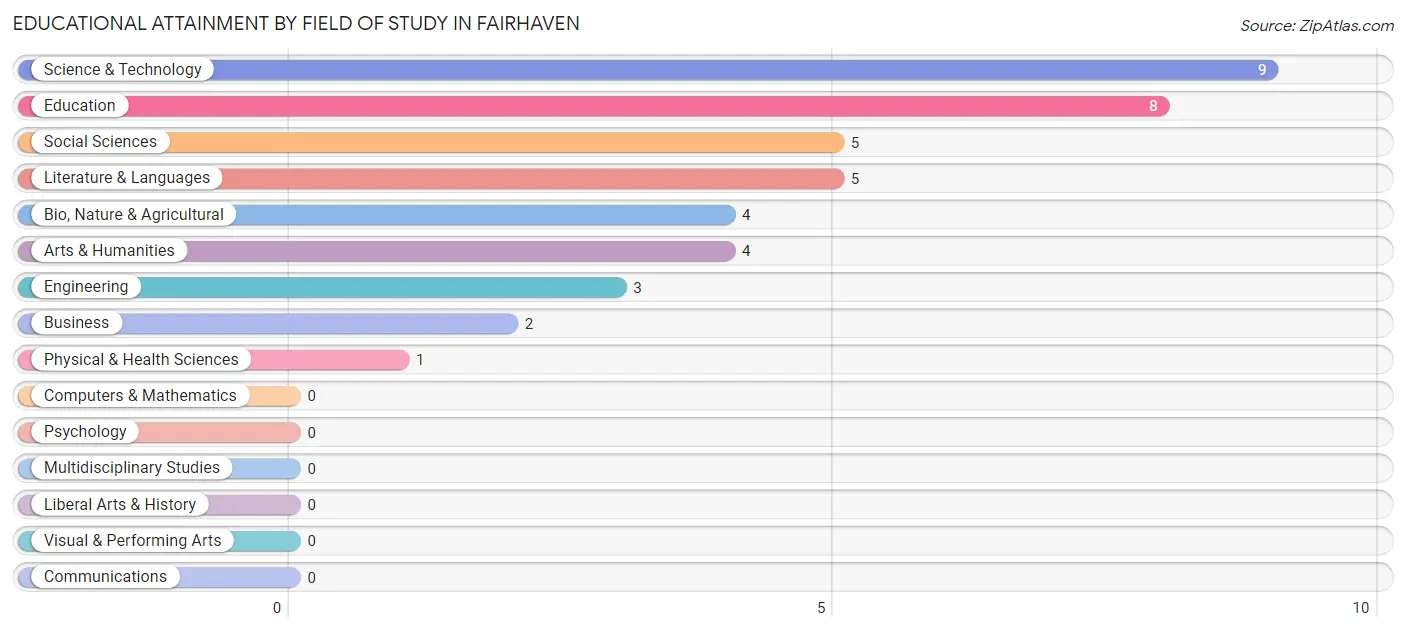
| Field of Study | # Graduates | % Graduates |
| Computers & Mathematics | 0 | 0.0% |
| Bio, Nature & Agricultural | 4 | 9.8% |
| Physical & Health Sciences | 1 | 2.4% |
| Psychology | 0 | 0.0% |
| Social Sciences | 5 | 12.2% |
| Engineering | 3 | 7.3% |
| Multidisciplinary Studies | 0 | 0.0% |
| Science & Technology | 9 | 22.0% |
| Business | 2 | 4.9% |
| Education | 8 | 19.5% |
| Literature & Languages | 5 | 12.2% |
| Liberal Arts & History | 0 | 0.0% |
| Visual & Performing Arts | 0 | 0.0% |
| Communications | 0 | 0.0% |
| Arts & Humanities | 4 | 9.8% |
| Total | 41 | 100.0% |
Transportation & Commute in Fairhaven
Vehicle Availability by Sex in Fairhaven
The most prevalent vehicle ownership categories in Fairhaven are males with 3 vehicles (33, accounting for 30.8%) and females with 3 vehicles (12, making up 34.7%).
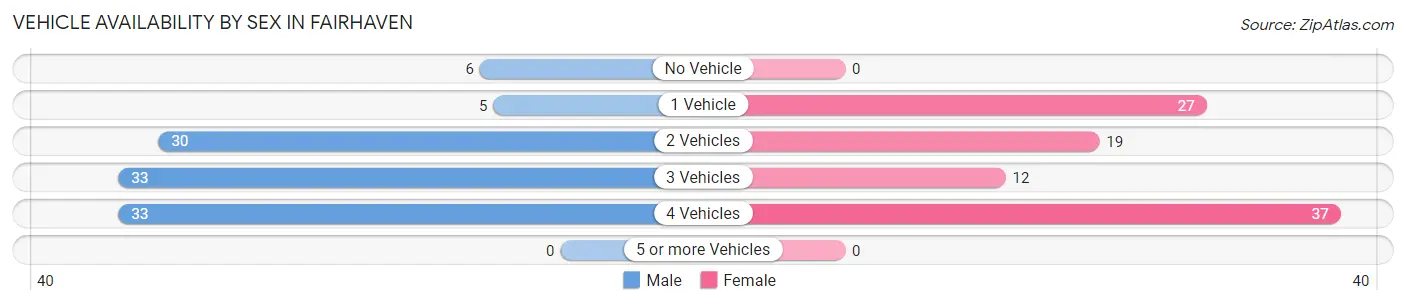
| Vehicles Available | Male | Female |
| No Vehicle | 6 (5.6%) | 0 (0.0%) |
| 1 Vehicle | 5 (4.7%) | 27 (28.4%) |
| 2 Vehicles | 30 (28.0%) | 19 (20.0%) |
| 3 Vehicles | 33 (30.8%) | 12 (12.6%) |
| 4 Vehicles | 33 (30.8%) | 37 (39.0%) |
| 5 or more Vehicles | 0 (0.0%) | 0 (0.0%) |
| Total | 107 (100.0%) | 95 (100.0%) |
Commute Time in Fairhaven
The most frequently occuring commute durations in Fairhaven are 15 to 19 minutes (91 commuters, 57.2%), 20 to 24 minutes (24 commuters, 15.1%), and 40 to 44 minutes (22 commuters, 13.8%).
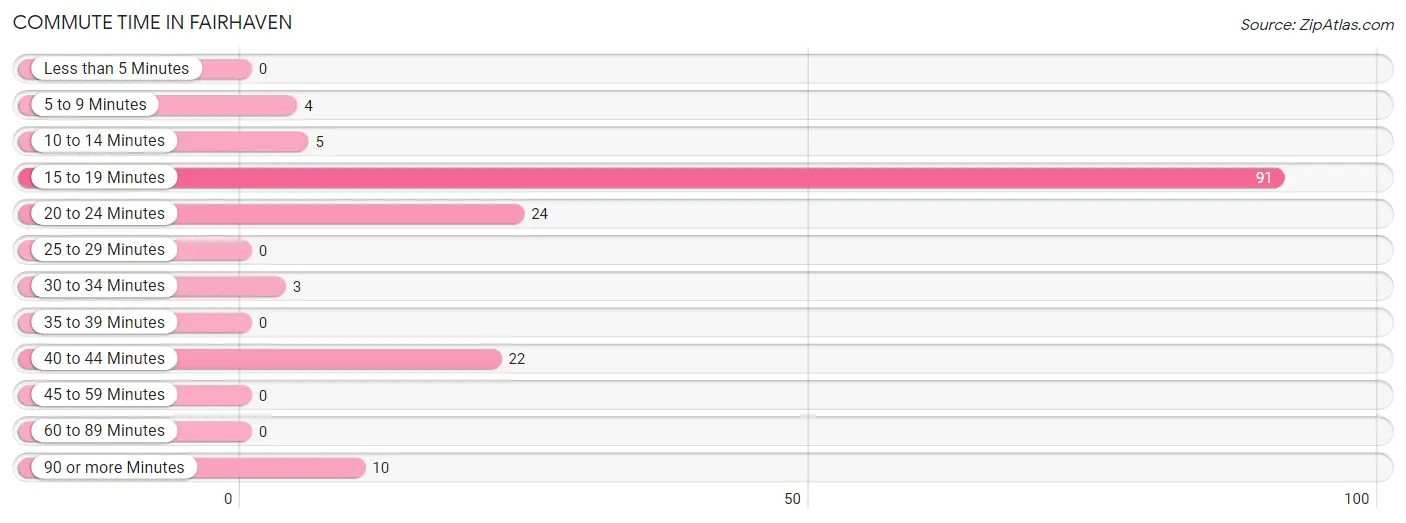
| Commute Time | # Commuters | % Commuters |
| Less than 5 Minutes | 0 | 0.0% |
| 5 to 9 Minutes | 4 | 2.5% |
| 10 to 14 Minutes | 5 | 3.1% |
| 15 to 19 Minutes | 91 | 57.2% |
| 20 to 24 Minutes | 24 | 15.1% |
| 25 to 29 Minutes | 0 | 0.0% |
| 30 to 34 Minutes | 3 | 1.9% |
| 35 to 39 Minutes | 0 | 0.0% |
| 40 to 44 Minutes | 22 | 13.8% |
| 45 to 59 Minutes | 0 | 0.0% |
| 60 to 89 Minutes | 0 | 0.0% |
| 90 or more Minutes | 10 | 6.3% |
Commute Time by Sex in Fairhaven
The most common commute times in Fairhaven are 15 to 19 minutes (47 commuters, 59.5%) for males and 15 to 19 minutes (44 commuters, 55.0%) for females.
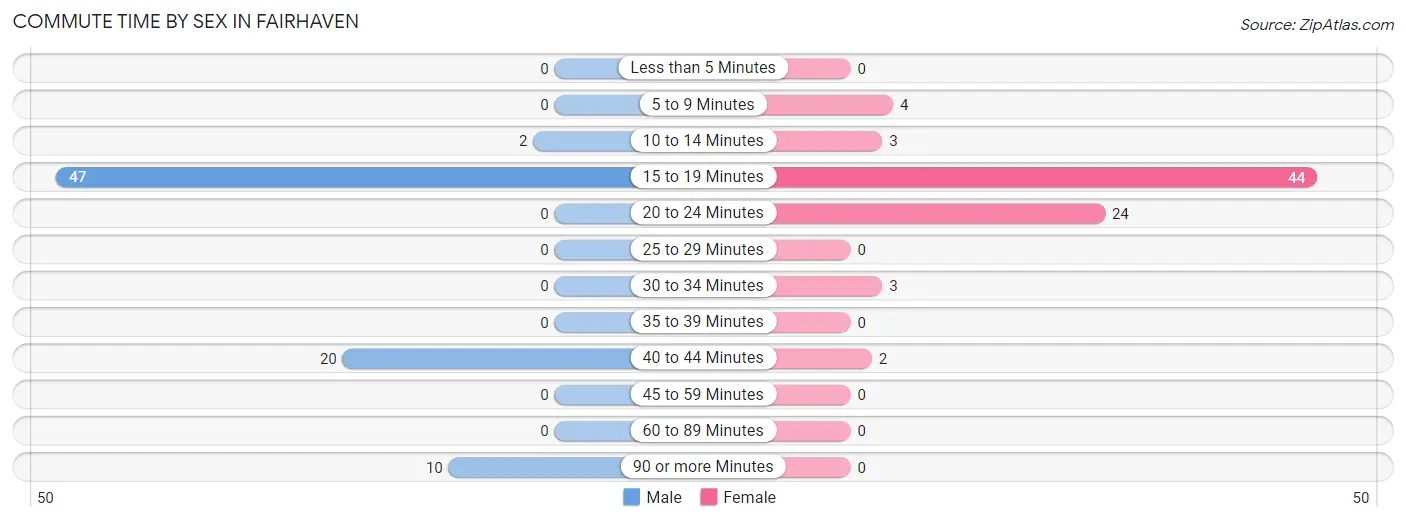
| Commute Time | Male | Female |
| Less than 5 Minutes | 0 (0.0%) | 0 (0.0%) |
| 5 to 9 Minutes | 0 (0.0%) | 4 (5.0%) |
| 10 to 14 Minutes | 2 (2.5%) | 3 (3.7%) |
| 15 to 19 Minutes | 47 (59.5%) | 44 (55.0%) |
| 20 to 24 Minutes | 0 (0.0%) | 24 (30.0%) |
| 25 to 29 Minutes | 0 (0.0%) | 0 (0.0%) |
| 30 to 34 Minutes | 0 (0.0%) | 3 (3.7%) |
| 35 to 39 Minutes | 0 (0.0%) | 0 (0.0%) |
| 40 to 44 Minutes | 20 (25.3%) | 2 (2.5%) |
| 45 to 59 Minutes | 0 (0.0%) | 0 (0.0%) |
| 60 to 89 Minutes | 0 (0.0%) | 0 (0.0%) |
| 90 or more Minutes | 10 (12.7%) | 0 (0.0%) |
Time of Departure to Work by Sex in Fairhaven
The most frequent times of departure to work in Fairhaven are 6:30 AM to 6:59 AM (28, 35.4%) for males and 6:00 AM to 6:29 AM (36, 45.0%) for females.
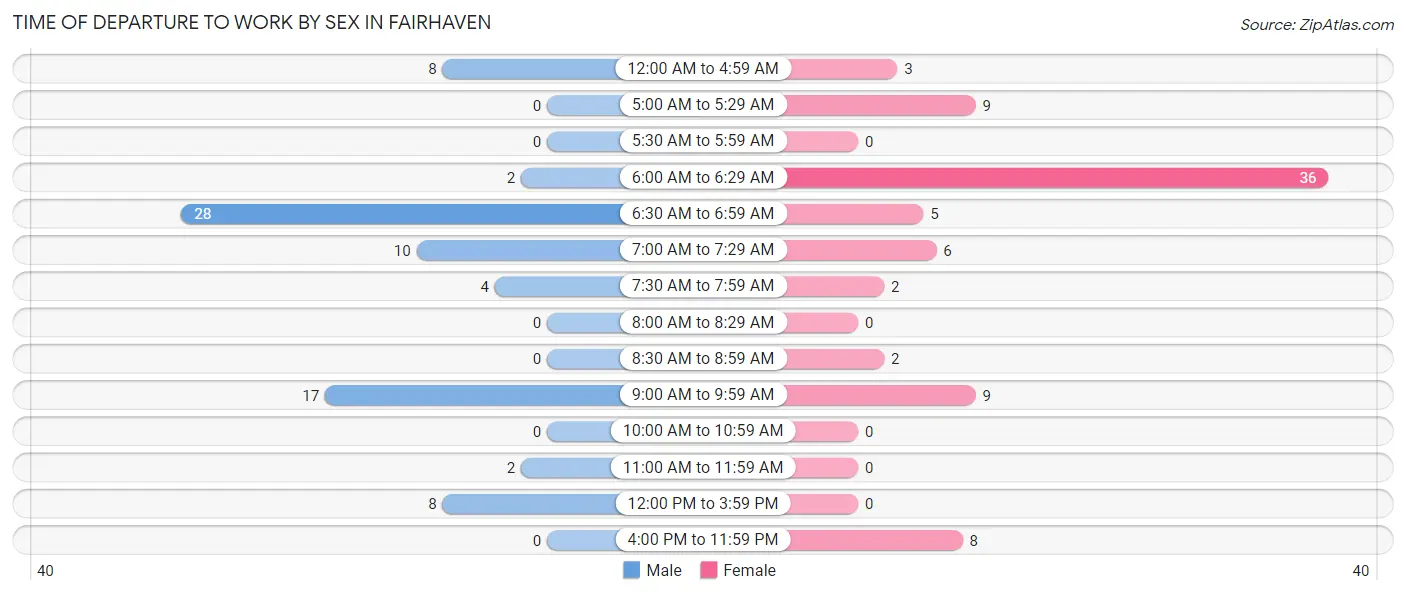
| Time of Departure | Male | Female |
| 12:00 AM to 4:59 AM | 8 (10.1%) | 3 (3.7%) |
| 5:00 AM to 5:29 AM | 0 (0.0%) | 9 (11.3%) |
| 5:30 AM to 5:59 AM | 0 (0.0%) | 0 (0.0%) |
| 6:00 AM to 6:29 AM | 2 (2.5%) | 36 (45.0%) |
| 6:30 AM to 6:59 AM | 28 (35.4%) | 5 (6.2%) |
| 7:00 AM to 7:29 AM | 10 (12.7%) | 6 (7.5%) |
| 7:30 AM to 7:59 AM | 4 (5.1%) | 2 (2.5%) |
| 8:00 AM to 8:29 AM | 0 (0.0%) | 0 (0.0%) |
| 8:30 AM to 8:59 AM | 0 (0.0%) | 2 (2.5%) |
| 9:00 AM to 9:59 AM | 17 (21.5%) | 9 (11.3%) |
| 10:00 AM to 10:59 AM | 0 (0.0%) | 0 (0.0%) |
| 11:00 AM to 11:59 AM | 2 (2.5%) | 0 (0.0%) |
| 12:00 PM to 3:59 PM | 8 (10.1%) | 0 (0.0%) |
| 4:00 PM to 11:59 PM | 0 (0.0%) | 8 (10.0%) |
| Total | 79 (100.0%) | 80 (100.0%) |
Housing Occupancy in Fairhaven
Occupancy by Ownership in Fairhaven
Of the total 145 dwellings in Fairhaven, owner-occupied units account for 69 (47.6%), while renter-occupied units make up 76 (52.4%).
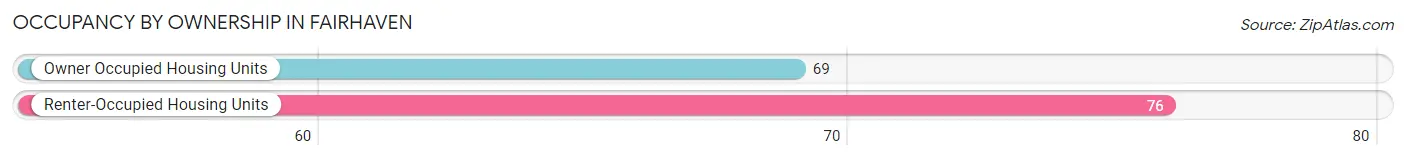
| Occupancy | # Housing Units | % Housing Units |
| Owner Occupied Housing Units | 69 | 47.6% |
| Renter-Occupied Housing Units | 76 | 52.4% |
| Total Occupied Housing Units | 145 | 100.0% |
Occupancy by Household Size in Fairhaven
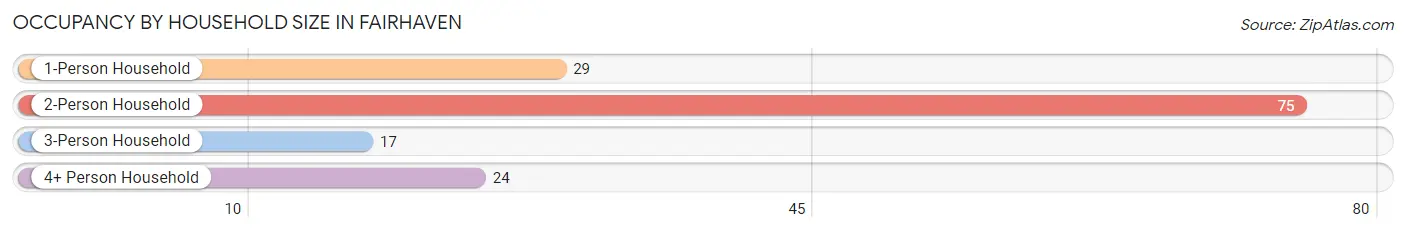
| Household Size | # Housing Units | % Housing Units |
| 1-Person Household | 29 | 20.0% |
| 2-Person Household | 75 | 51.7% |
| 3-Person Household | 17 | 11.7% |
| 4+ Person Household | 24 | 16.6% |
| Total Housing Units | 145 | 100.0% |
Occupancy by Ownership by Household Size in Fairhaven
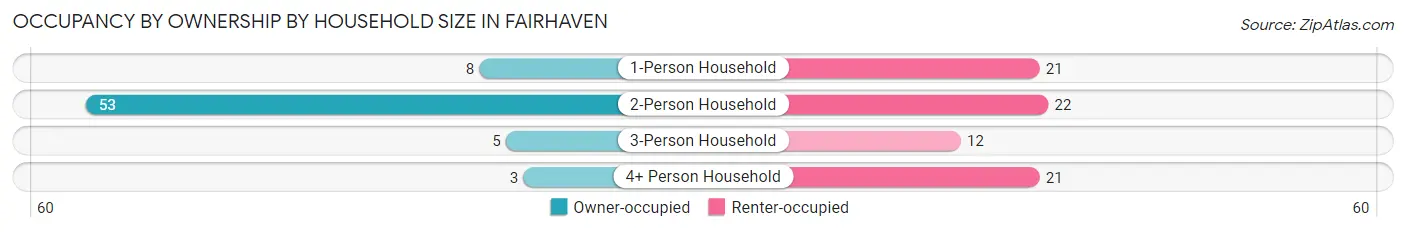
| Household Size | Owner-occupied | Renter-occupied |
| 1-Person Household | 8 (27.6%) | 21 (72.4%) |
| 2-Person Household | 53 (70.7%) | 22 (29.3%) |
| 3-Person Household | 5 (29.4%) | 12 (70.6%) |
| 4+ Person Household | 3 (12.5%) | 21 (87.5%) |
| Total Housing Units | 69 (47.6%) | 76 (52.4%) |
Occupancy by Educational Attainment in Fairhaven
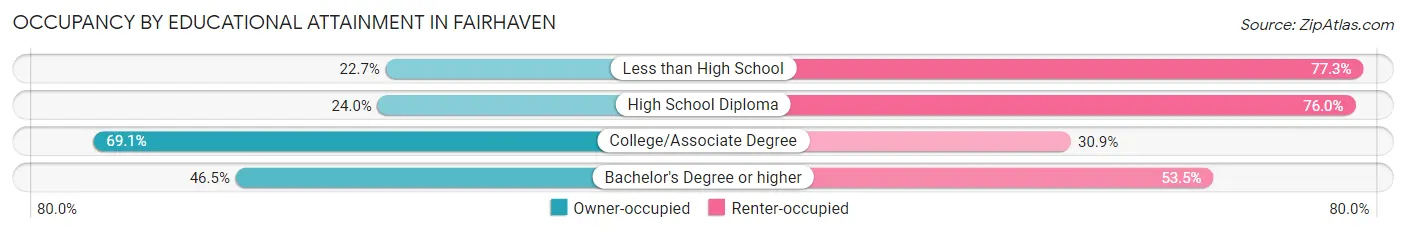
| Household Size | Owner-occupied | Renter-occupied |
| Less than High School | 5 (22.7%) | 17 (77.3%) |
| High School Diploma | 6 (24.0%) | 19 (76.0%) |
| College/Associate Degree | 38 (69.1%) | 17 (30.9%) |
| Bachelor's Degree or higher | 20 (46.5%) | 23 (53.5%) |
Occupancy by Age of Householder in Fairhaven
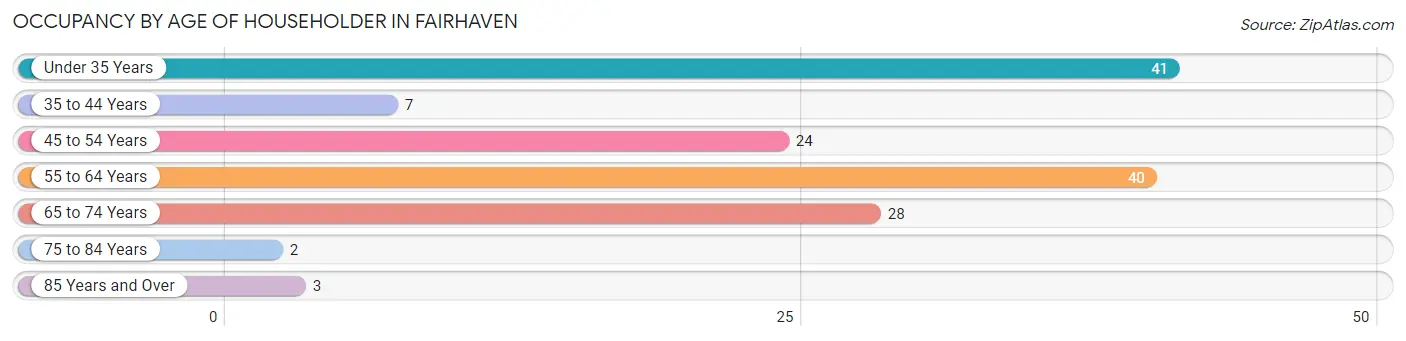
| Age Bracket | # Households | % Households |
| Under 35 Years | 41 | 28.3% |
| 35 to 44 Years | 7 | 4.8% |
| 45 to 54 Years | 24 | 16.6% |
| 55 to 64 Years | 40 | 27.6% |
| 65 to 74 Years | 28 | 19.3% |
| 75 to 84 Years | 2 | 1.4% |
| 85 Years and Over | 3 | 2.1% |
| Total | 145 | 100.0% |
Housing Finances in Fairhaven
Median Income by Occupancy in Fairhaven
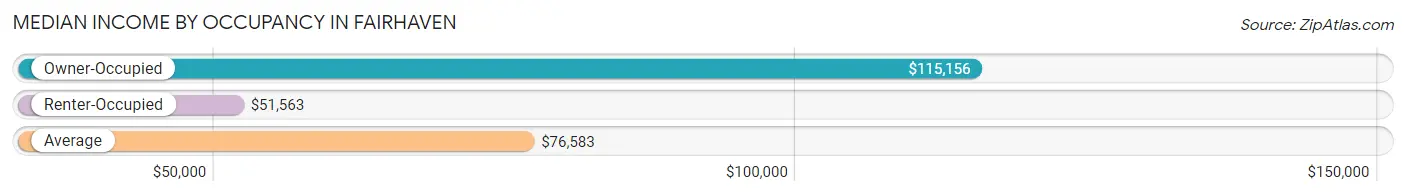
| Occupancy Type | # Households | Median Income |
| Owner-Occupied | 69 (47.6%) | $115,156 |
| Renter-Occupied | 76 (52.4%) | $51,563 |
| Average | 145 (100.0%) | $76,583 |
Occupancy by Householder Income Bracket in Fairhaven
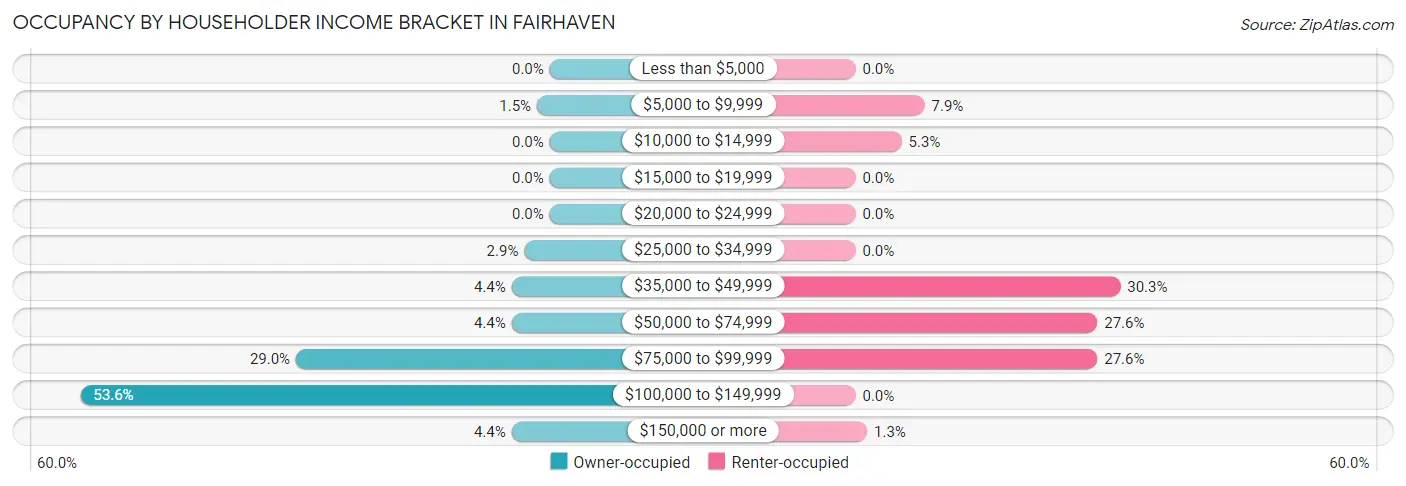
| Income Bracket | Owner-occupied | Renter-occupied |
| Less than $5,000 | 0 (0.0%) | 0 (0.0%) |
| $5,000 to $9,999 | 1 (1.5%) | 6 (7.9%) |
| $10,000 to $14,999 | 0 (0.0%) | 4 (5.3%) |
| $15,000 to $19,999 | 0 (0.0%) | 0 (0.0%) |
| $20,000 to $24,999 | 0 (0.0%) | 0 (0.0%) |
| $25,000 to $34,999 | 2 (2.9%) | 0 (0.0%) |
| $35,000 to $49,999 | 3 (4.3%) | 23 (30.3%) |
| $50,000 to $74,999 | 3 (4.3%) | 21 (27.6%) |
| $75,000 to $99,999 | 20 (29.0%) | 21 (27.6%) |
| $100,000 to $149,999 | 37 (53.6%) | 0 (0.0%) |
| $150,000 or more | 3 (4.3%) | 1 (1.3%) |
| Total | 69 (100.0%) | 76 (100.0%) |
Monthly Housing Cost Tiers in Fairhaven
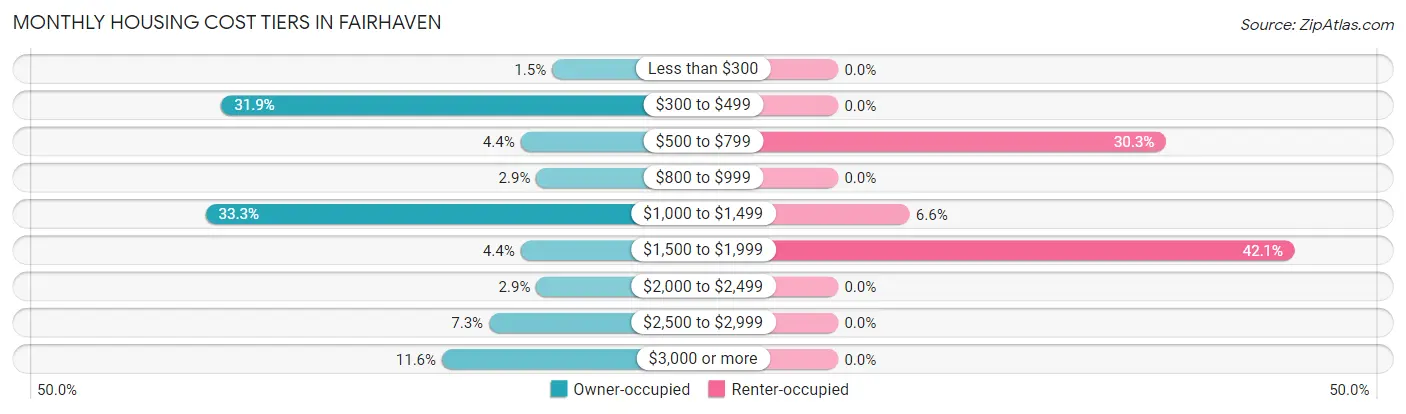
| Monthly Cost | Owner-occupied | Renter-occupied |
| Less than $300 | 1 (1.5%) | 0 (0.0%) |
| $300 to $499 | 22 (31.9%) | 0 (0.0%) |
| $500 to $799 | 3 (4.3%) | 23 (30.3%) |
| $800 to $999 | 2 (2.9%) | 0 (0.0%) |
| $1,000 to $1,499 | 23 (33.3%) | 5 (6.6%) |
| $1,500 to $1,999 | 3 (4.3%) | 32 (42.1%) |
| $2,000 to $2,499 | 2 (2.9%) | 0 (0.0%) |
| $2,500 to $2,999 | 5 (7.2%) | 0 (0.0%) |
| $3,000 or more | 8 (11.6%) | 0 (0.0%) |
| Total | 69 (100.0%) | 76 (100.0%) |
Physical Housing Characteristics in Fairhaven
Housing Structures in Fairhaven
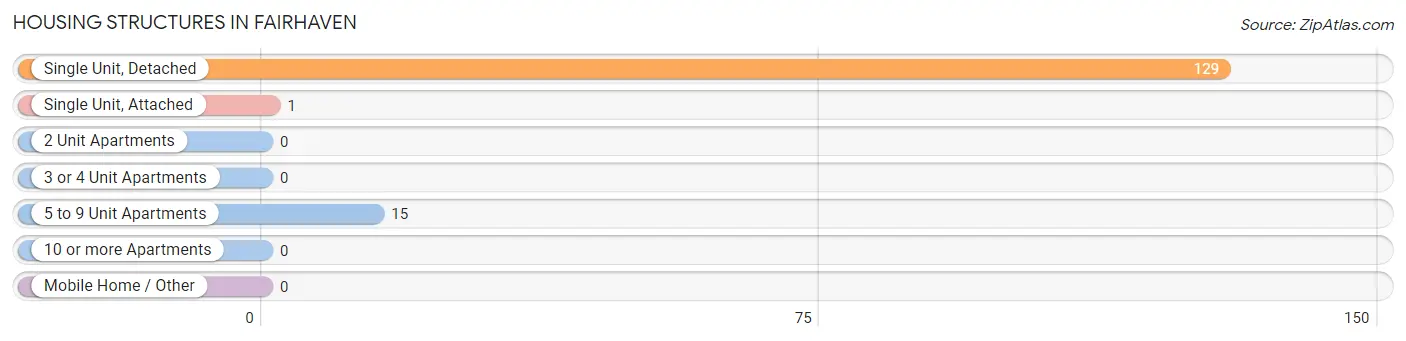
| Structure Type | # Housing Units | % Housing Units |
| Single Unit, Detached | 129 | 89.0% |
| Single Unit, Attached | 1 | 0.7% |
| 2 Unit Apartments | 0 | 0.0% |
| 3 or 4 Unit Apartments | 0 | 0.0% |
| 5 to 9 Unit Apartments | 15 | 10.3% |
| 10 or more Apartments | 0 | 0.0% |
| Mobile Home / Other | 0 | 0.0% |
| Total | 145 | 100.0% |
Housing Structures by Occupancy in Fairhaven
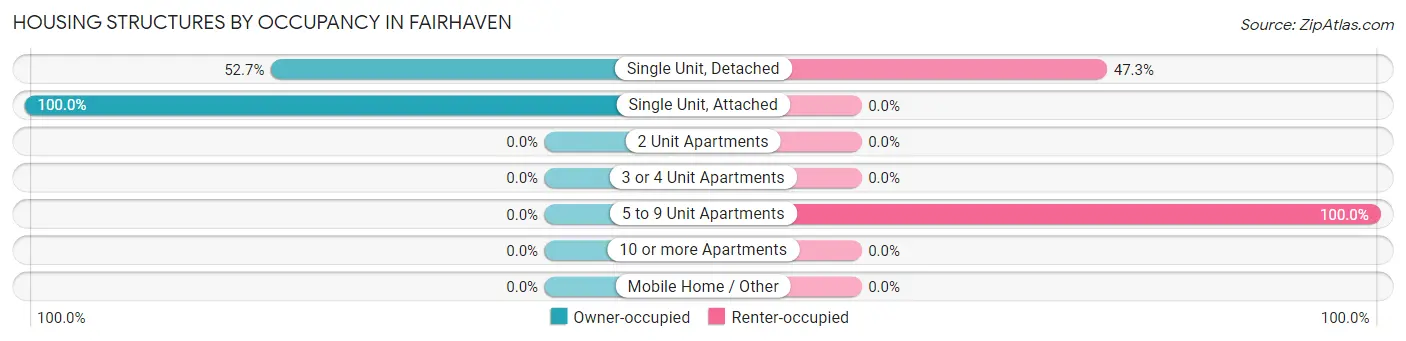
| Structure Type | Owner-occupied | Renter-occupied |
| Single Unit, Detached | 68 (52.7%) | 61 (47.3%) |
| Single Unit, Attached | 1 (100.0%) | 0 (0.0%) |
| 2 Unit Apartments | 0 (0.0%) | 0 (0.0%) |
| 3 or 4 Unit Apartments | 0 (0.0%) | 0 (0.0%) |
| 5 to 9 Unit Apartments | 0 (0.0%) | 15 (100.0%) |
| 10 or more Apartments | 0 (0.0%) | 0 (0.0%) |
| Mobile Home / Other | 0 (0.0%) | 0 (0.0%) |
| Total | 69 (47.6%) | 76 (52.4%) |
Housing Structures by Number of Rooms in Fairhaven
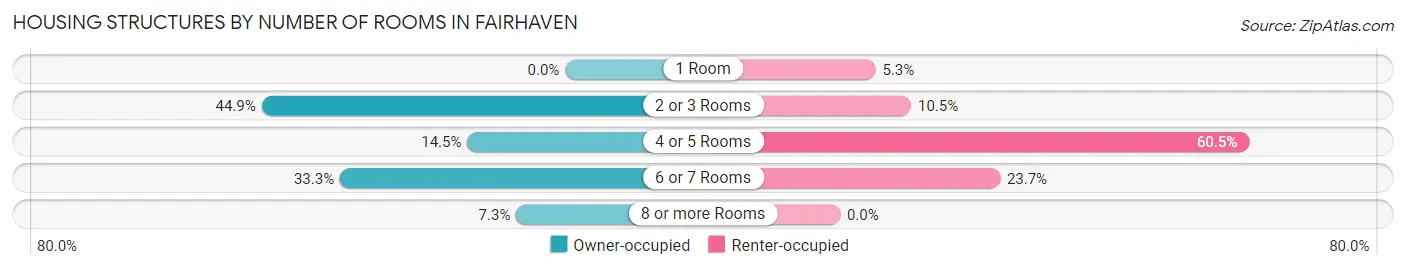
| Number of Rooms | Owner-occupied | Renter-occupied |
| 1 Room | 0 (0.0%) | 4 (5.3%) |
| 2 or 3 Rooms | 31 (44.9%) | 8 (10.5%) |
| 4 or 5 Rooms | 10 (14.5%) | 46 (60.5%) |
| 6 or 7 Rooms | 23 (33.3%) | 18 (23.7%) |
| 8 or more Rooms | 5 (7.2%) | 0 (0.0%) |
| Total | 69 (100.0%) | 76 (100.0%) |
Housing Structure by Heating Type in Fairhaven
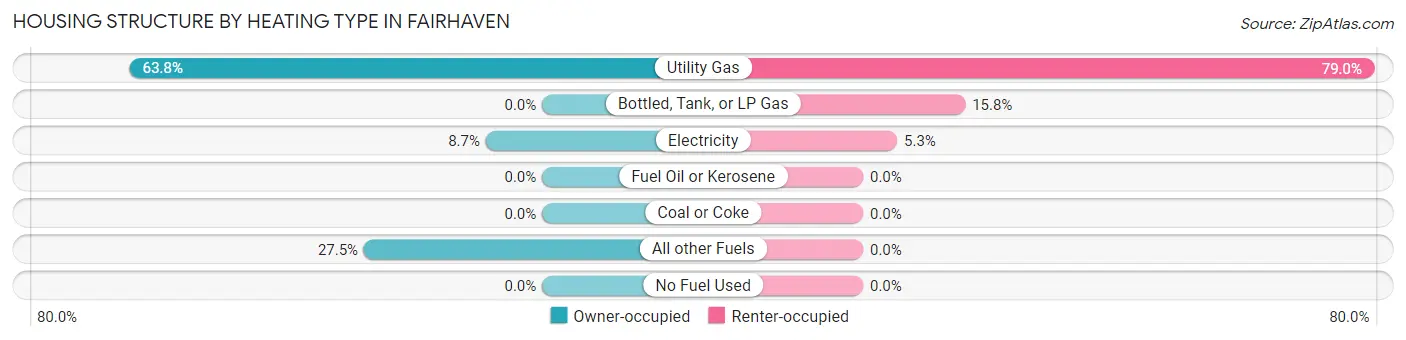
| Heating Type | Owner-occupied | Renter-occupied |
| Utility Gas | 44 (63.8%) | 60 (78.9%) |
| Bottled, Tank, or LP Gas | 0 (0.0%) | 12 (15.8%) |
| Electricity | 6 (8.7%) | 4 (5.3%) |
| Fuel Oil or Kerosene | 0 (0.0%) | 0 (0.0%) |
| Coal or Coke | 0 (0.0%) | 0 (0.0%) |
| All other Fuels | 19 (27.5%) | 0 (0.0%) |
| No Fuel Used | 0 (0.0%) | 0 (0.0%) |
| Total | 69 (100.0%) | 76 (100.0%) |
Household Vehicle Usage in Fairhaven
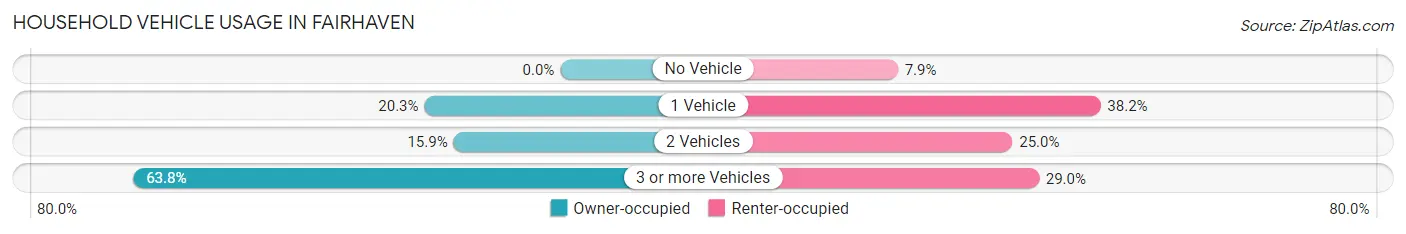
| Vehicles per Household | Owner-occupied | Renter-occupied |
| No Vehicle | 0 (0.0%) | 6 (7.9%) |
| 1 Vehicle | 14 (20.3%) | 29 (38.2%) |
| 2 Vehicles | 11 (15.9%) | 19 (25.0%) |
| 3 or more Vehicles | 44 (63.8%) | 22 (28.9%) |
| Total | 69 (100.0%) | 76 (100.0%) |
Real Estate & Mortgages in Fairhaven
Real Estate and Mortgage Overview in Fairhaven
| Characteristic | Without Mortgage | With Mortgage |
| Housing Units | 44 | 25 |
| Median Property Value | - | - |
| Median Household Income | $135,263 | $1 |
| Monthly Housing Costs | - | - |
| Real Estate Taxes | - | - |
Property Value by Mortgage Status in Fairhaven
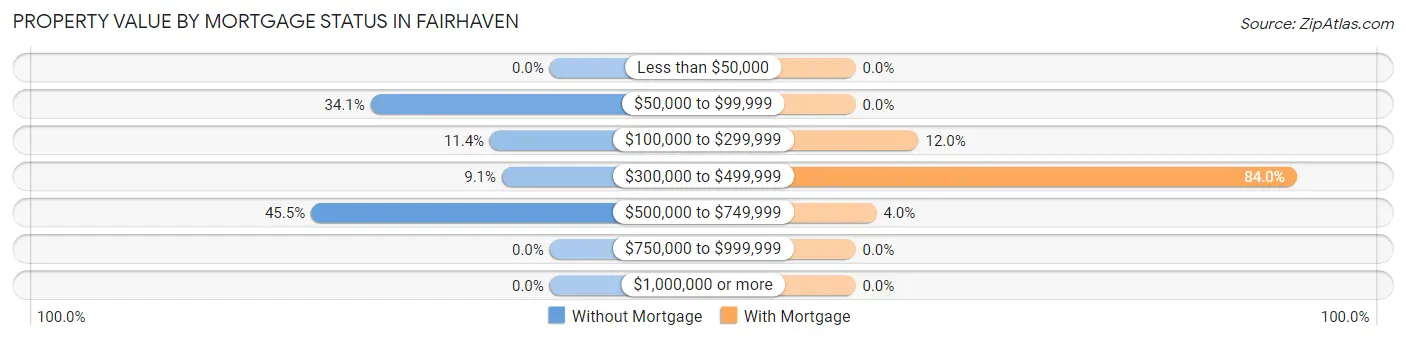
| Property Value | Without Mortgage | With Mortgage |
| Less than $50,000 | 0 (0.0%) | 0 (0.0%) |
| $50,000 to $99,999 | 15 (34.1%) | 0 (0.0%) |
| $100,000 to $299,999 | 5 (11.4%) | 3 (12.0%) |
| $300,000 to $499,999 | 4 (9.1%) | 21 (84.0%) |
| $500,000 to $749,999 | 20 (45.5%) | 1 (4.0%) |
| $750,000 to $999,999 | 0 (0.0%) | 0 (0.0%) |
| $1,000,000 or more | 0 (0.0%) | 0 (0.0%) |
| Total | 44 (100.0%) | 25 (100.0%) |
Household Income by Mortgage Status in Fairhaven
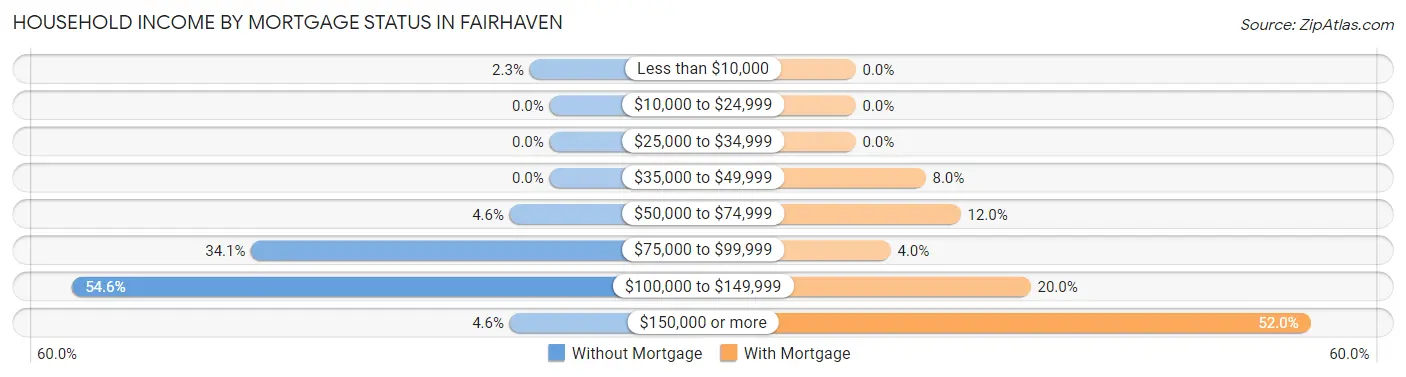
| Household Income | Without Mortgage | With Mortgage |
| Less than $10,000 | 1 (2.3%) | 0 (0.0%) |
| $10,000 to $24,999 | 0 (0.0%) | 0 (0.0%) |
| $25,000 to $34,999 | 0 (0.0%) | 0 (0.0%) |
| $35,000 to $49,999 | 0 (0.0%) | 2 (8.0%) |
| $50,000 to $74,999 | 2 (4.5%) | 3 (12.0%) |
| $75,000 to $99,999 | 15 (34.1%) | 1 (4.0%) |
| $100,000 to $149,999 | 24 (54.5%) | 5 (20.0%) |
| $150,000 or more | 2 (4.5%) | 13 (52.0%) |
| Total | 44 (100.0%) | 25 (100.0%) |
Property Value to Household Income Ratio in Fairhaven
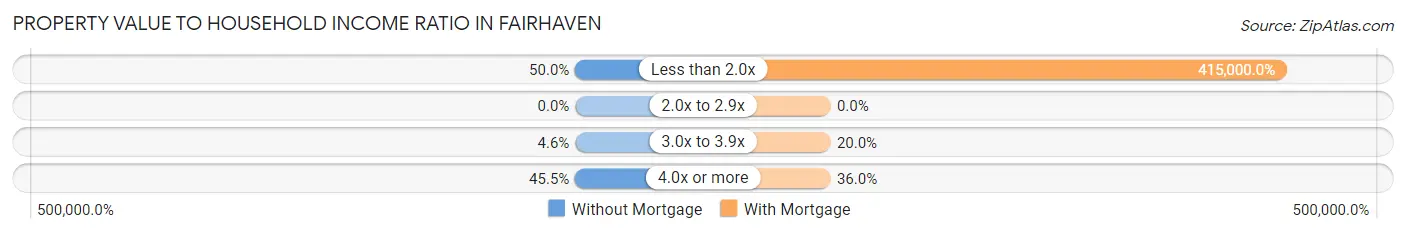
| Value-to-Income Ratio | Without Mortgage | With Mortgage |
| Less than 2.0x | 22 (50.0%) | 103,750 (415,000.0%) |
| 2.0x to 2.9x | 0 (0.0%) | 0 (0.0%) |
| 3.0x to 3.9x | 2 (4.5%) | 5 (20.0%) |
| 4.0x or more | 20 (45.5%) | 9 (36.0%) |
| Total | 44 (100.0%) | 25 (100.0%) |
Real Estate Taxes by Mortgage Status in Fairhaven
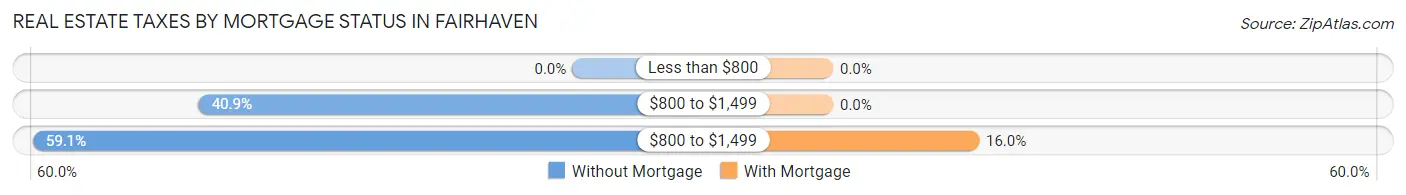
| Property Taxes | Without Mortgage | With Mortgage |
| Less than $800 | 0 (0.0%) | 0 (0.0%) |
| $800 to $1,499 | 18 (40.9%) | 0 (0.0%) |
| $800 to $1,499 | 26 (59.1%) | 4 (16.0%) |
| Total | 44 (100.0%) | 25 (100.0%) |
Health & Disability in Fairhaven
Health Insurance Coverage by Age in Fairhaven
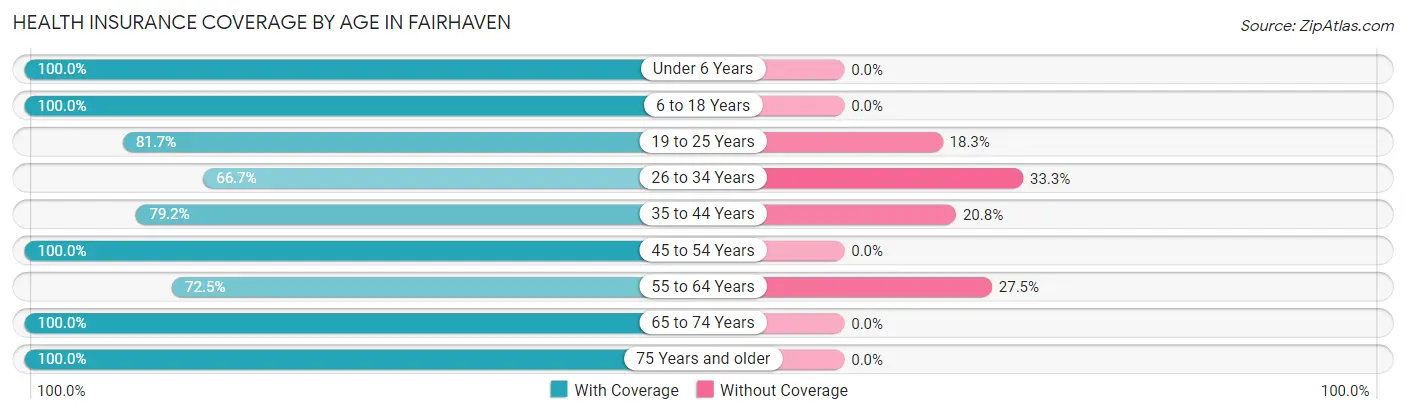
| Age Bracket | With Coverage | Without Coverage |
| Under 6 Years | 2 (100.0%) | 0 (0.0%) |
| 6 to 18 Years | 20 (100.0%) | 0 (0.0%) |
| 19 to 25 Years | 49 (81.7%) | 11 (18.3%) |
| 26 to 34 Years | 22 (66.7%) | 11 (33.3%) |
| 35 to 44 Years | 19 (79.2%) | 5 (20.8%) |
| 45 to 54 Years | 37 (100.0%) | 0 (0.0%) |
| 55 to 64 Years | 79 (72.5%) | 30 (27.5%) |
| 65 to 74 Years | 47 (100.0%) | 0 (0.0%) |
| 75 Years and older | 9 (100.0%) | 0 (0.0%) |
| Total | 284 (83.3%) | 57 (16.7%) |
Health Insurance Coverage by Citizenship Status in Fairhaven
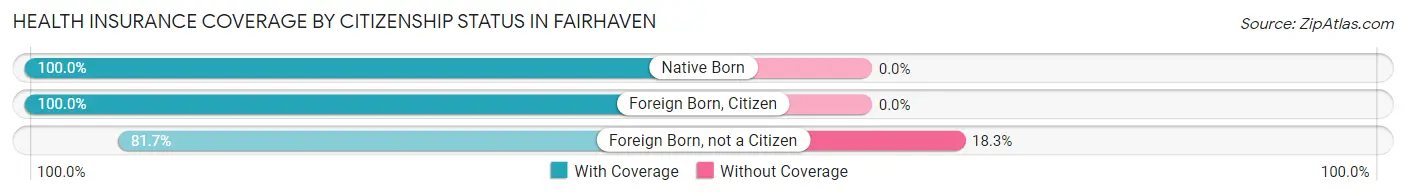
| Citizenship Status | With Coverage | Without Coverage |
| Native Born | 2 (100.0%) | 0 (0.0%) |
| Foreign Born, Citizen | 20 (100.0%) | 0 (0.0%) |
| Foreign Born, not a Citizen | 49 (81.7%) | 11 (18.3%) |
Health Insurance Coverage by Household Income in Fairhaven
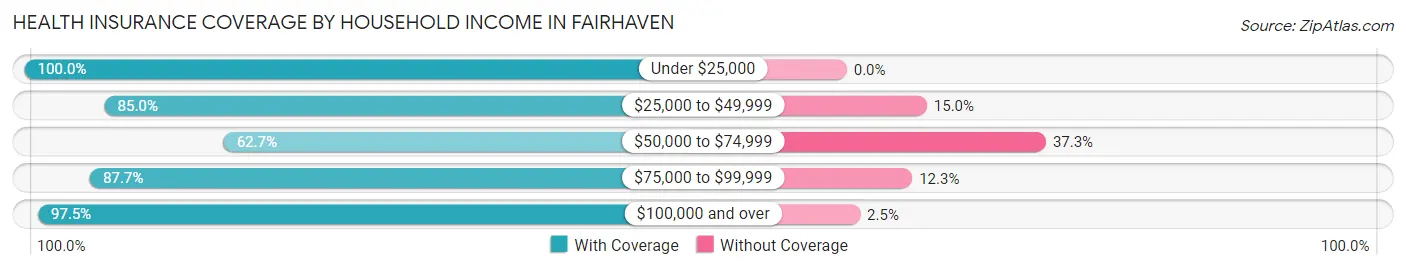
| Household Income | With Coverage | Without Coverage |
| Under $25,000 | 11 (100.0%) | 0 (0.0%) |
| $25,000 to $49,999 | 51 (85.0%) | 9 (15.0%) |
| $50,000 to $74,999 | 42 (62.7%) | 25 (37.3%) |
| $75,000 to $99,999 | 93 (87.7%) | 13 (12.3%) |
| $100,000 and over | 78 (97.5%) | 2 (2.5%) |
Public vs Private Health Insurance Coverage by Age in Fairhaven
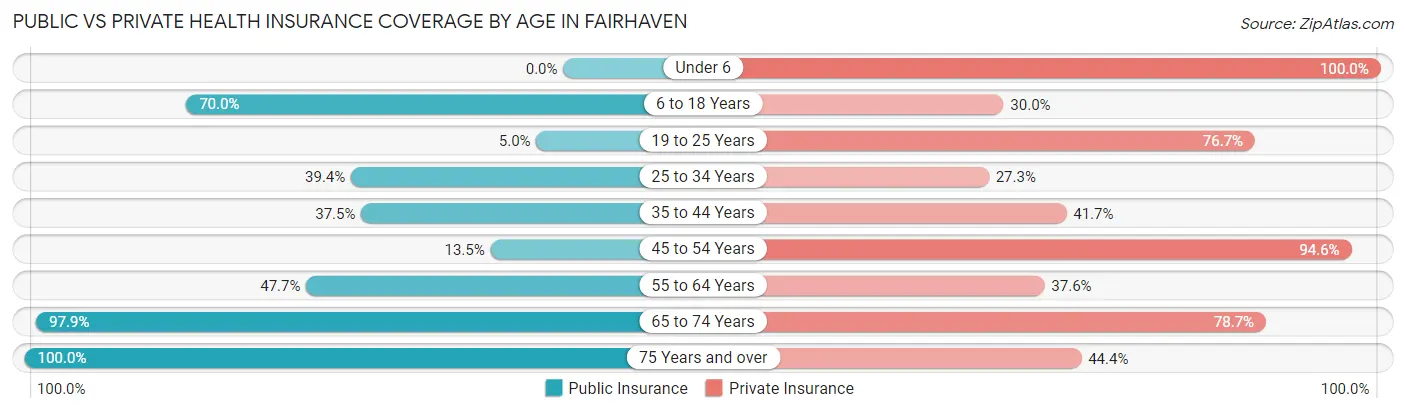
| Age Bracket | Public Insurance | Private Insurance |
| Under 6 | 0 (0.0%) | 2 (100.0%) |
| 6 to 18 Years | 14 (70.0%) | 6 (30.0%) |
| 19 to 25 Years | 3 (5.0%) | 46 (76.7%) |
| 25 to 34 Years | 13 (39.4%) | 9 (27.3%) |
| 35 to 44 Years | 9 (37.5%) | 10 (41.7%) |
| 45 to 54 Years | 5 (13.5%) | 35 (94.6%) |
| 55 to 64 Years | 52 (47.7%) | 41 (37.6%) |
| 65 to 74 Years | 46 (97.9%) | 37 (78.7%) |
| 75 Years and over | 9 (100.0%) | 4 (44.4%) |
| Total | 151 (44.3%) | 190 (55.7%) |
Disability Status by Sex by Age in Fairhaven
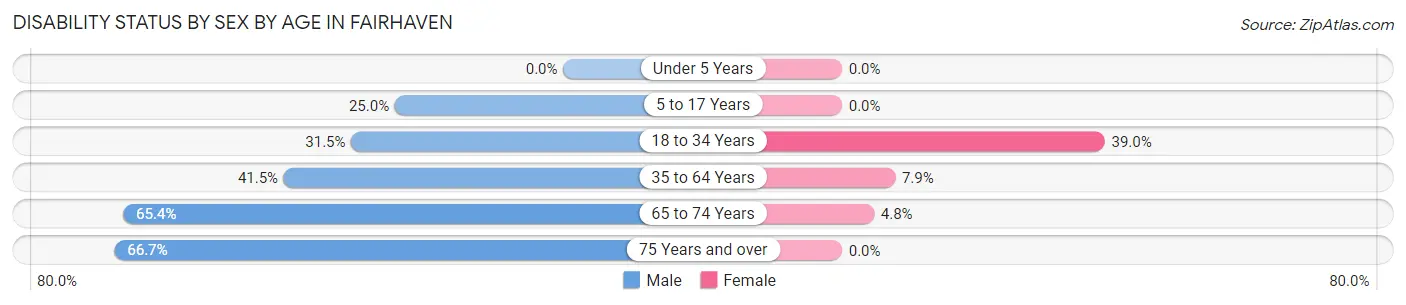
| Age Bracket | Male | Female |
| Under 5 Years | 0 (0.0%) | 0 (0.0%) |
| 5 to 17 Years | 3 (25.0%) | 0 (0.0%) |
| 18 to 34 Years | 17 (31.5%) | 16 (39.0%) |
| 35 to 64 Years | 39 (41.5%) | 6 (7.9%) |
| 65 to 74 Years | 17 (65.4%) | 1 (4.8%) |
| 75 Years and over | 4 (66.7%) | 0 (0.0%) |
Disability Class by Sex by Age in Fairhaven
Disability Class: Hearing Difficulty
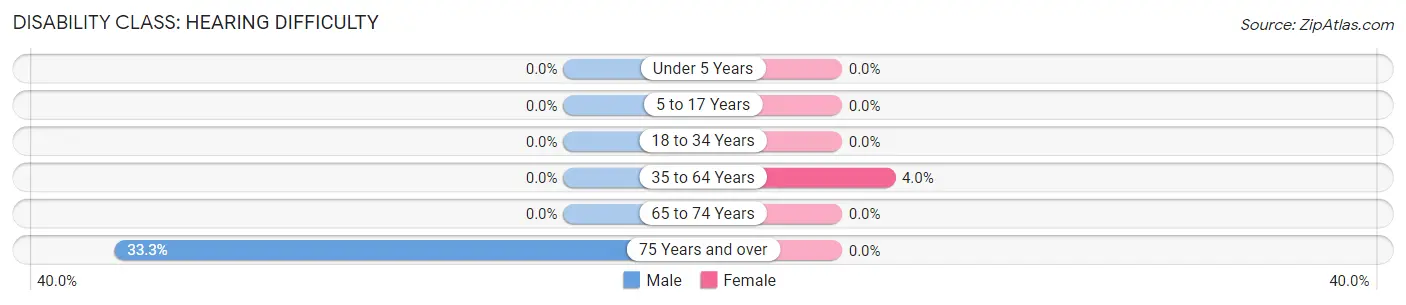
| Age Bracket | Male | Female |
| Under 5 Years | 0 (0.0%) | 0 (0.0%) |
| 5 to 17 Years | 0 (0.0%) | 0 (0.0%) |
| 18 to 34 Years | 0 (0.0%) | 0 (0.0%) |
| 35 to 64 Years | 0 (0.0%) | 3 (4.0%) |
| 65 to 74 Years | 0 (0.0%) | 0 (0.0%) |
| 75 Years and over | 2 (33.3%) | 0 (0.0%) |
Disability Class: Vision Difficulty
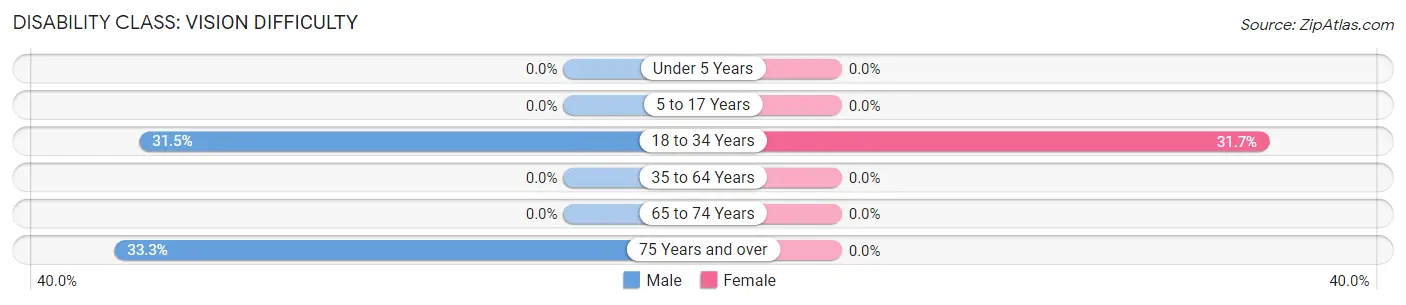
| Age Bracket | Male | Female |
| Under 5 Years | 0 (0.0%) | 0 (0.0%) |
| 5 to 17 Years | 0 (0.0%) | 0 (0.0%) |
| 18 to 34 Years | 17 (31.5%) | 13 (31.7%) |
| 35 to 64 Years | 0 (0.0%) | 0 (0.0%) |
| 65 to 74 Years | 0 (0.0%) | 0 (0.0%) |
| 75 Years and over | 2 (33.3%) | 0 (0.0%) |
Disability Class: Cognitive Difficulty
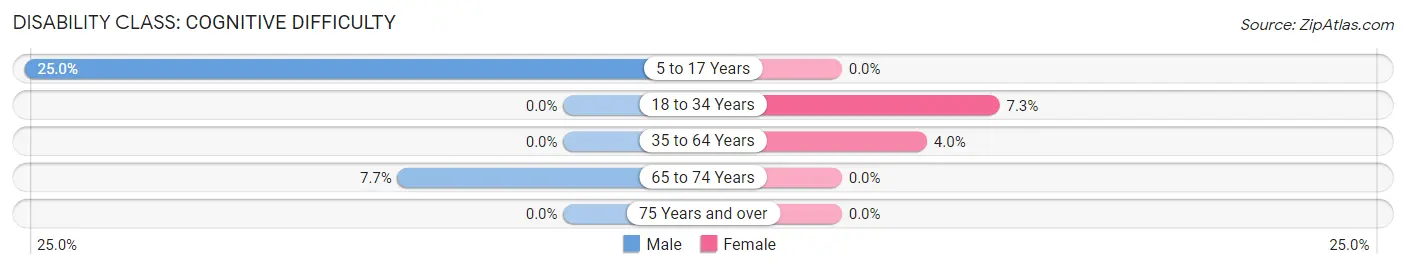
| Age Bracket | Male | Female |
| 5 to 17 Years | 3 (25.0%) | 0 (0.0%) |
| 18 to 34 Years | 0 (0.0%) | 3 (7.3%) |
| 35 to 64 Years | 0 (0.0%) | 3 (4.0%) |
| 65 to 74 Years | 2 (7.7%) | 0 (0.0%) |
| 75 Years and over | 0 (0.0%) | 0 (0.0%) |
Disability Class: Ambulatory Difficulty
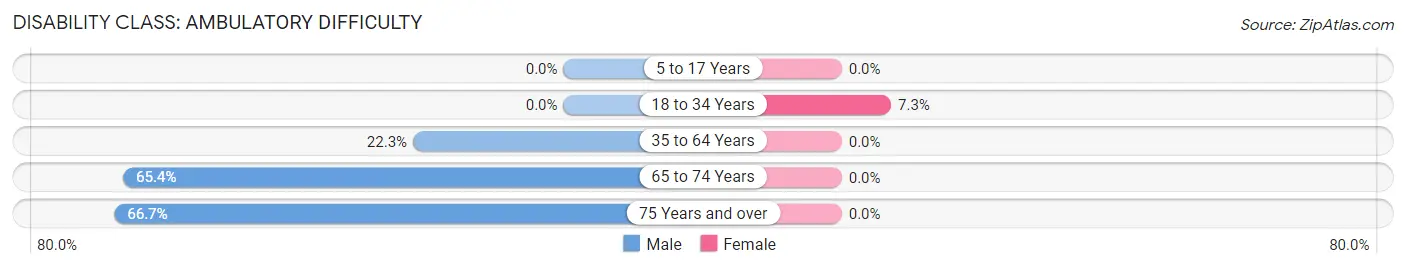
| Age Bracket | Male | Female |
| 5 to 17 Years | 0 (0.0%) | 0 (0.0%) |
| 18 to 34 Years | 0 (0.0%) | 3 (7.3%) |
| 35 to 64 Years | 21 (22.3%) | 0 (0.0%) |
| 65 to 74 Years | 17 (65.4%) | 0 (0.0%) |
| 75 Years and over | 4 (66.7%) | 0 (0.0%) |
Disability Class: Self-Care Difficulty
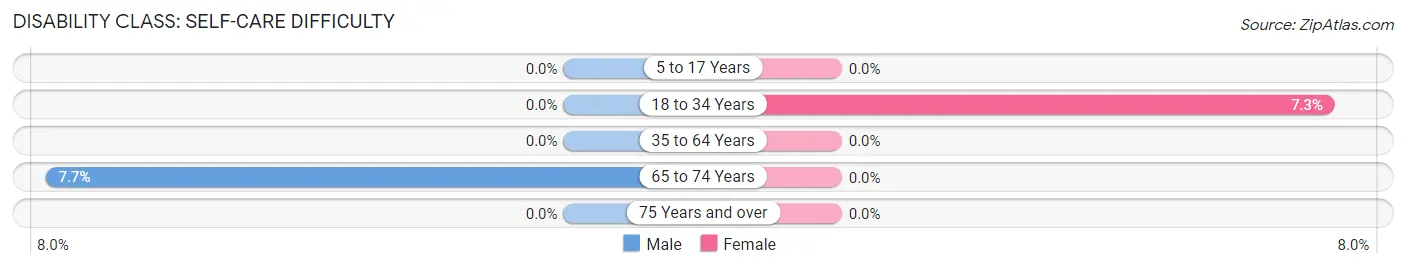
| Age Bracket | Male | Female |
| 5 to 17 Years | 0 (0.0%) | 0 (0.0%) |
| 18 to 34 Years | 0 (0.0%) | 3 (7.3%) |
| 35 to 64 Years | 0 (0.0%) | 0 (0.0%) |
| 65 to 74 Years | 2 (7.7%) | 0 (0.0%) |
| 75 Years and over | 0 (0.0%) | 0 (0.0%) |
Technology Access in Fairhaven
Computing Device Access in Fairhaven
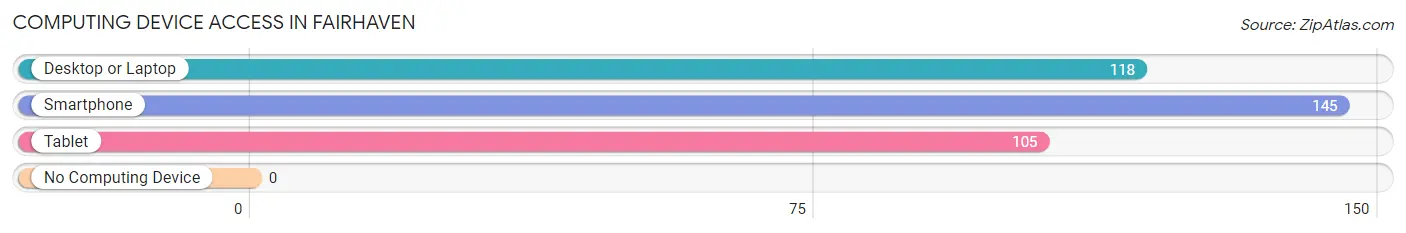
| Device Type | # Households | % Households |
| Desktop or Laptop | 118 | 81.4% |
| Smartphone | 145 | 100.0% |
| Tablet | 105 | 72.4% |
| No Computing Device | 0 | 0.0% |
| Total | 145 | 100.0% |
Internet Access in Fairhaven
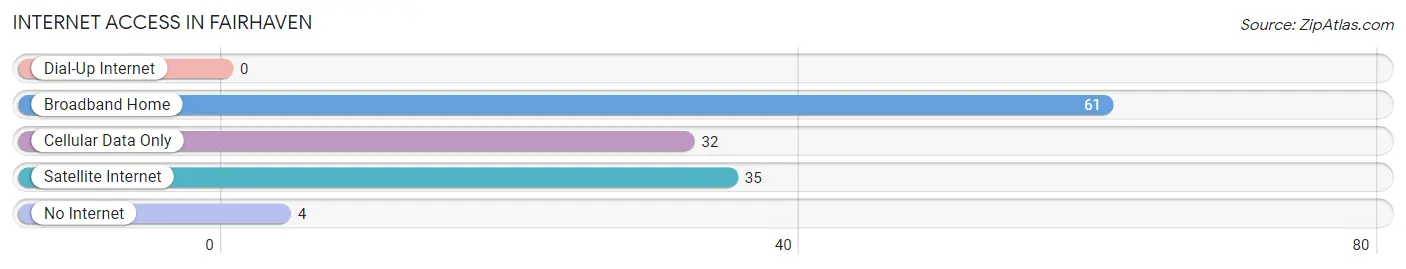
| Internet Type | # Households | % Households |
| Dial-Up Internet | 0 | 0.0% |
| Broadband Home | 61 | 42.1% |
| Cellular Data Only | 32 | 22.1% |
| Satellite Internet | 35 | 24.1% |
| No Internet | 4 | 2.8% |
| Total | 145 | 100.0% |
Fairhaven Summary
History
Fairhaven is a small unincorporated community located in the San Benito County of California. It is situated in the foothills of the Diablo Range, approximately 8 miles east of Hollister. The area was first settled in the late 1800s by a group of settlers from the nearby town of Tres Pinos. The settlers named the area Fairhaven, after the nearby Fairhaven Ranch.
The area was primarily used for ranching and farming, and the town grew slowly over the years. In the early 1900s, the town was home to a post office, a general store, a blacksmith shop, and a few other businesses. The town also had a school, which was built in the early 1900s and served the local community until the 1950s.
In the 1950s, the town began to experience a period of growth and development. The population increased, and new businesses opened up. The town also saw the construction of a new school, which opened in the late 1950s.
In the late 1960s, the town experienced a period of decline. Many of the businesses closed, and the population decreased. In the 1970s, the town was revitalized with the construction of a new shopping center and the opening of a new post office.
Geography
Fairhaven is located in the foothills of the Diablo Range in San Benito County, California. The town is situated at an elevation of approximately 1,000 feet above sea level. The area is characterized by rolling hills and open grasslands. The climate is mild, with temperatures ranging from the mid-50s to the mid-80s in the summer months.
The town is located approximately 8 miles east of Hollister, and is accessible via State Route 25. The nearest major cities are San Jose and Salinas, which are both located approximately 40 miles away.
Economy
The economy of Fairhaven is primarily based on agriculture and tourism. The town is home to several farms, which produce a variety of crops, including grapes, olives, and almonds. The town is also home to several wineries, which produce a variety of wines.
The town is also a popular tourist destination, due to its proximity to the Diablo Range and its scenic views. The town is home to several bed and breakfasts, as well as a few restaurants and shops.
Demographics
As of the 2010 census, the population of Fairhaven was 1,845. The racial makeup of the town was 75.3% White, 0.7% African American, 0.3% Native American, 0.7% Asian, 0.1% Pacific Islander, and 22.1% from other races. The median household income was $45,000, and the median age was 39.
Conclusion
Fairhaven is a small unincorporated community located in the San Benito County of California. It is situated in the foothills of the Diablo Range, approximately 8 miles east of Hollister. The area was first settled in the late 1800s by a group of settlers from the nearby town of Tres Pinos. The town is characterized by rolling hills and open grasslands, and the climate is mild. The economy of Fairhaven is primarily based on agriculture and tourism. As of the 2010 census, the population of Fairhaven was 1,845.
Common Questions
What is Per Capita Income in Fairhaven?
Per Capita income in Fairhaven is $33,714.
What is the Median Family Income in Fairhaven?
Median Family Income in Fairhaven is $76,500.
What is the Median Household income in Fairhaven?
Median Household Income in Fairhaven is $76,583.
What is Income or Wage Gap in Fairhaven?
Income or Wage Gap in Fairhaven is 18.4%.
Women in Fairhaven earn 81.6 cents for every dollar earned by a man.
What is Inequality or Gini Index in Fairhaven?
Inequality or Gini Index in Fairhaven is 0.31.
What is the Total Population of Fairhaven?
Total Population of Fairhaven is 341.
What is the Total Male Population of Fairhaven?
Total Male Population of Fairhaven is 194.
What is the Total Female Population of Fairhaven?
Total Female Population of Fairhaven is 147.
What is the Ratio of Males per 100 Females in Fairhaven?
There are 131.97 Males per 100 Females in Fairhaven.
What is the Ratio of Females per 100 Males in Fairhaven?
There are 75.77 Females per 100 Males in Fairhaven.
What is the Median Population Age in Fairhaven?
Median Population Age in Fairhaven is 54.4 Years.
What is the Average Family Size in Fairhaven
Average Family Size in Fairhaven is 2.3 People.
What is the Average Household Size in Fairhaven
Average Household Size in Fairhaven is 2.2 People.
How Large is the Labor Force in Fairhaven?
There are 225 People in the Labor Forcein in Fairhaven.
What is the Percentage of People in the Labor Force in Fairhaven?
69.4% of People are in the Labor Force in Fairhaven.
What is the Unemployment Rate in Fairhaven?
Unemployment Rate in Fairhaven is 6.7%.