Cities with the Highest Percentage of Population Employed in Accommodation & Food Services in Delaware
RELATED REPORTS & OPTIONS
Accommodation & Food Services
Delaware
Compare Cities
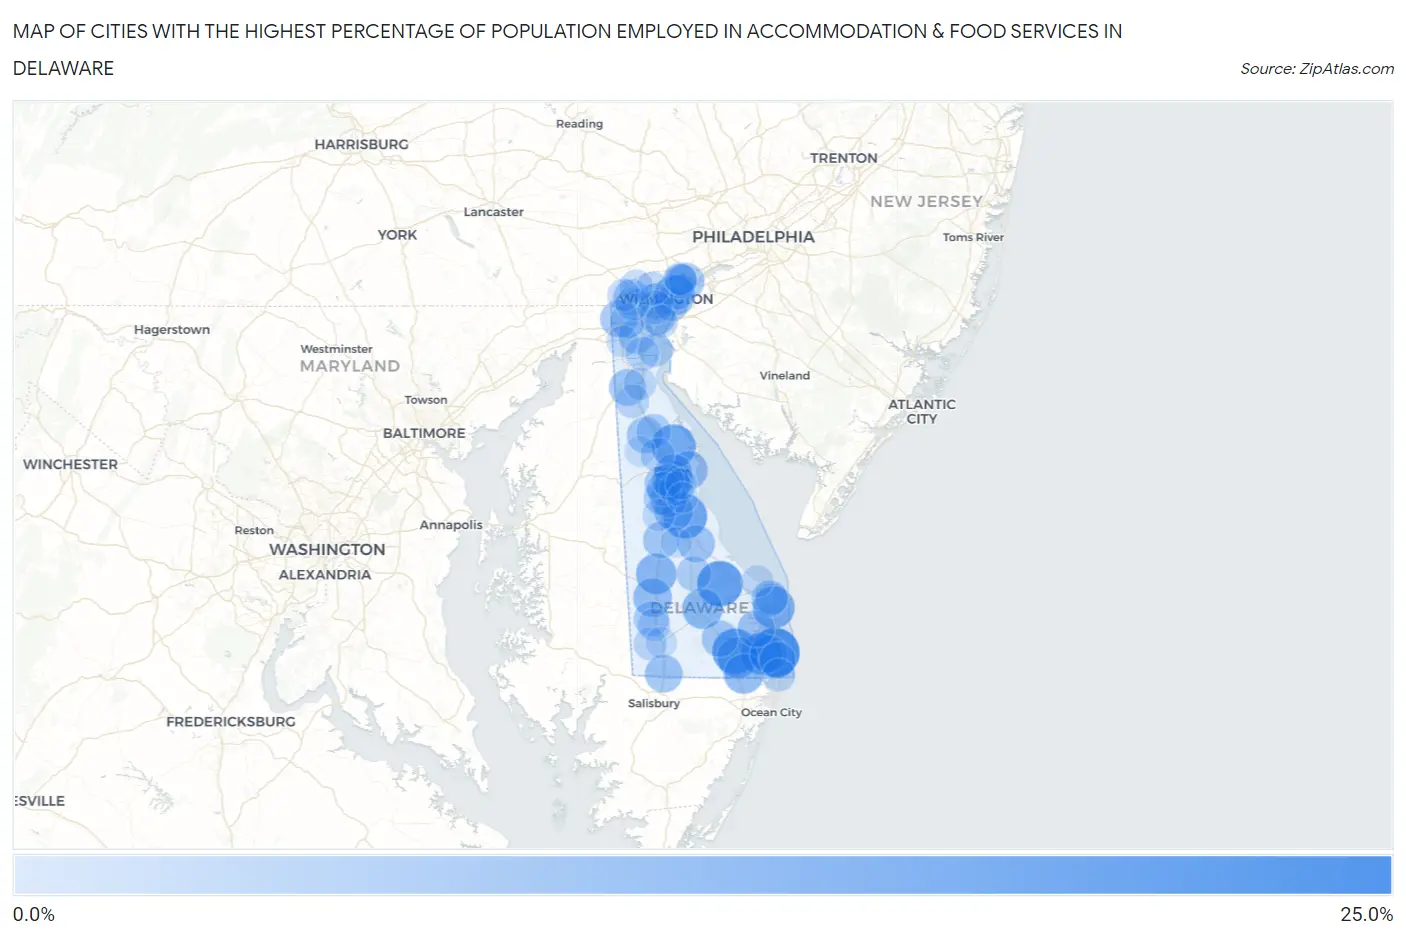
Map of Cities with the Highest Percentage of Population Employed in Accommodation & Food Services in Delaware
0.0%
25.0%
Cities with the Highest Percentage of Population Employed in Accommodation & Food Services in Delaware
| City | % Employed | vs State | vs National | |
| 1. | Bethany Beach | 23.8% | 6.3%(+17.5)#1 | 6.9%(+16.9)#837 |
| 2. | Milton | 19.0% | 6.3%(+12.7)#2 | 6.9%(+12.1)#1,424 |
| 3. | Dagsboro | 18.6% | 6.3%(+12.2)#3 | 6.9%(+11.7)#1,496 |
| 4. | Frederica | 17.4% | 6.3%(+11.0)#4 | 6.9%(+10.5)#1,746 |
| 5. | Leipsic | 16.9% | 6.3%(+10.5)#5 | 6.9%(+9.97)#1,866 |
| 6. | Dewey Beach | 14.5% | 6.3%(+8.13)#6 | 6.9%(+7.57)#2,655 |
| 7. | Millville | 14.3% | 6.3%(+7.96)#7 | 6.9%(+7.40)#2,710 |
| 8. | Frankford | 12.9% | 6.3%(+6.57)#8 | 6.9%(+6.02)#3,426 |
| 9. | Greenwood | 12.7% | 6.3%(+6.33)#9 | 6.9%(+5.78)#3,577 |
| 10. | Georgetown | 12.5% | 6.3%(+6.14)#10 | 6.9%(+5.59)#3,710 |
| 11. | Edgemoor | 12.4% | 6.3%(+6.07)#11 | 6.9%(+5.51)#3,750 |
| 12. | Selbyville | 11.9% | 6.3%(+5.60)#12 | 6.9%(+5.04)#4,066 |
| 13. | Riverview | 10.5% | 6.3%(+4.20)#13 | 6.9%(+3.65)#5,187 |
| 14. | Kent Acres | 10.5% | 6.3%(+4.17)#14 | 6.9%(+3.61)#5,227 |
| 15. | Bridgeville | 10.4% | 6.3%(+4.10)#15 | 6.9%(+3.54)#5,294 |
| 16. | Little Creek | 9.6% | 6.3%(+3.24)#16 | 6.9%(+2.68)#6,313 |
| 17. | Ocean View | 9.1% | 6.3%(+2.81)#17 | 6.9%(+2.25)#6,887 |
| 18. | Delmar | 9.1% | 6.3%(+2.77)#18 | 6.9%(+2.21)#6,940 |
| 19. | Woodside East | 8.9% | 6.3%(+2.56)#19 | 6.9%(+2.00)#7,303 |
| 20. | Milford | 8.6% | 6.3%(+2.29)#20 | 6.9%(+1.73)#7,693 |
| 21. | Dover | 8.6% | 6.3%(+2.26)#21 | 6.9%(+1.70)#7,722 |
| 22. | Newark | 8.5% | 6.3%(+2.16)#22 | 6.9%(+1.61)#7,894 |
| 23. | Long Neck | 8.5% | 6.3%(+2.14)#23 | 6.9%(+1.58)#7,944 |
| 24. | Middletown | 8.2% | 6.3%(+1.90)#24 | 6.9%(+1.34)#8,360 |
| 25. | Rehoboth Beach | 8.0% | 6.3%(+1.72)#25 | 6.9%(+1.17)#8,679 |
| 26. | Millsboro | 7.8% | 6.3%(+1.46)#26 | 6.9%(+0.899)#9,151 |
| 27. | Harrington | 7.7% | 6.3%(+1.36)#27 | 6.9%(+0.807)#9,360 |
| 28. | South Bethany | 7.6% | 6.3%(+1.32)#28 | 6.9%(+0.758)#9,441 |
| 29. | Claymont | 7.6% | 6.3%(+1.28)#29 | 6.9%(+0.727)#9,515 |
| 30. | Clayton | 7.5% | 6.3%(+1.22)#30 | 6.9%(+0.661)#9,660 |
| 31. | Wyoming | 7.1% | 6.3%(+0.809)#31 | 6.9%(+0.252)#10,531 |
| 32. | Pike Creek | 6.9% | 6.3%(+0.604)#32 | 6.9%(+0.046)#10,968 |
| 33. | Elsmere | 6.7% | 6.3%(+0.408)#33 | 6.9%(-0.149)#11,455 |
| 34. | Highland Acres | 6.7% | 6.3%(+0.343)#34 | 6.9%(-0.214)#11,571 |
| 35. | Woodside | 6.2% | 6.3%(-0.073)#35 | 6.9%(-0.631)#12,600 |
| 36. | Bear | 6.2% | 6.3%(-0.095)#36 | 6.9%(-0.652)#12,648 |
| 37. | Wilmington Manor | 6.2% | 6.3%(-0.139)#37 | 6.9%(-0.696)#12,785 |
| 38. | Seaford | 6.0% | 6.3%(-0.284)#38 | 6.9%(-0.841)#13,148 |
| 39. | Ellendale | 5.9% | 6.3%(-0.472)#39 | 6.9%(-1.03)#13,616 |
| 40. | Wilmington | 5.8% | 6.3%(-0.492)#40 | 6.9%(-1.05)#13,661 |
| 41. | Smyrna | 5.7% | 6.3%(-0.620)#41 | 6.9%(-1.18)#13,977 |
| 42. | Brookside | 5.5% | 6.3%(-0.873)#42 | 6.9%(-1.43)#14,613 |
| 43. | Bellefonte | 5.3% | 6.3%(-0.990)#43 | 6.9%(-1.55)#14,887 |
| 44. | Ardencroft | 5.3% | 6.3%(-1.06)#44 | 6.9%(-1.62)#15,078 |
| 45. | Camden | 5.3% | 6.3%(-1.07)#45 | 6.9%(-1.63)#15,105 |
| 46. | Cheswold | 5.0% | 6.3%(-1.34)#46 | 6.9%(-1.90)#15,789 |
| 47. | Newport | 4.8% | 6.3%(-1.52)#47 | 6.9%(-2.08)#16,215 |
| 48. | Delaware City | 4.8% | 6.3%(-1.54)#48 | 6.9%(-2.10)#16,278 |
| 49. | Greenville | 4.7% | 6.3%(-1.58)#49 | 6.9%(-2.14)#16,386 |
| 50. | Pike Creek Valley | 4.7% | 6.3%(-1.67)#50 | 6.9%(-2.23)#16,603 |
| 51. | St Georges | 4.5% | 6.3%(-1.79)#51 | 6.9%(-2.35)#16,944 |
| 52. | Rising Sun Lebanon | 4.5% | 6.3%(-1.82)#52 | 6.9%(-2.37)#17,004 |
| 53. | Townsend | 4.0% | 6.3%(-2.28)#53 | 6.9%(-2.84)#18,117 |
| 54. | New Castle | 3.8% | 6.3%(-2.50)#54 | 6.9%(-3.06)#18,627 |
| 55. | Fenwick Island | 3.7% | 6.3%(-2.59)#55 | 6.9%(-3.14)#18,844 |
| 56. | Hockessin | 3.6% | 6.3%(-2.70)#56 | 6.9%(-3.26)#19,129 |
| 57. | Bethel | 3.4% | 6.3%(-2.96)#57 | 6.9%(-3.52)#19,759 |
| 58. | Blades | 3.3% | 6.3%(-3.03)#58 | 6.9%(-3.59)#19,920 |
| 59. | North Star | 3.2% | 6.3%(-3.11)#59 | 6.9%(-3.67)#20,109 |
| 60. | Henlopen Acres | 3.1% | 6.3%(-3.20)#60 | 6.9%(-3.76)#20,292 |
| 61. | Odessa | 3.0% | 6.3%(-3.31)#61 | 6.9%(-3.87)#20,554 |
| 62. | Arden | 3.0% | 6.3%(-3.31)#62 | 6.9%(-3.87)#20,559 |
| 63. | Rodney Village | 2.9% | 6.3%(-3.40)#63 | 6.9%(-3.96)#20,740 |
| 64. | Felton | 2.7% | 6.3%(-3.59)#64 | 6.9%(-4.15)#21,162 |
| 65. | Glasgow | 2.6% | 6.3%(-3.71)#65 | 6.9%(-4.27)#21,428 |
| 66. | Lewes | 2.4% | 6.3%(-3.96)#66 | 6.9%(-4.52)#21,957 |
| 67. | Ardentown | 2.0% | 6.3%(-4.32)#67 | 6.9%(-4.88)#22,665 |
| 68. | Dover Base Housing | 1.9% | 6.3%(-4.37)#68 | 6.9%(-4.93)#22,754 |
| 69. | Laurel | 1.8% | 6.3%(-4.49)#69 | 6.9%(-5.05)#22,944 |
| 70. | Kenton | 1.2% | 6.3%(-5.12)#70 | 6.9%(-5.68)#23,897 |
| 71. | Magnolia | 1.1% | 6.3%(-5.17)#71 | 6.9%(-5.73)#23,972 |
| 72. | Houston | 0.79% | 6.3%(-5.53)#72 | 6.9%(-6.09)#24,410 |
| 73. | Lincoln | 0.18% | 6.3%(-6.14)#73 | 6.9%(-6.70)#24,793 |
1
Common Questions
What are the Top 10 Cities with the Highest Percentage of Population Employed in Accommodation & Food Services in Delaware?
Top 10 Cities with the Highest Percentage of Population Employed in Accommodation & Food Services in Delaware are:
#1
23.8%
#2
19.0%
#3
18.6%
#4
17.4%
#5
16.9%
#6
14.5%
#7
14.3%
#8
12.9%
#9
12.7%
#10
12.5%
What city has the Highest Percentage of Population Employed in Accommodation & Food Services in Delaware?
Bethany Beach has the Highest Percentage of Population Employed in Accommodation & Food Services in Delaware with 23.8%.
What is the Percentage of Population Employed in Accommodation & Food Services in the State of Delaware?
Percentage of Population Employed in Accommodation & Food Services in Delaware is 6.3%.
What is the Percentage of Population Employed in Accommodation & Food Services in the United States?
Percentage of Population Employed in Accommodation & Food Services in the United States is 6.9%.