Cities with the Highest Percentage of Population Employed in Accommodation & Food Services in Maine
RELATED REPORTS & OPTIONS
Accommodation & Food Services
Maine
Compare Cities
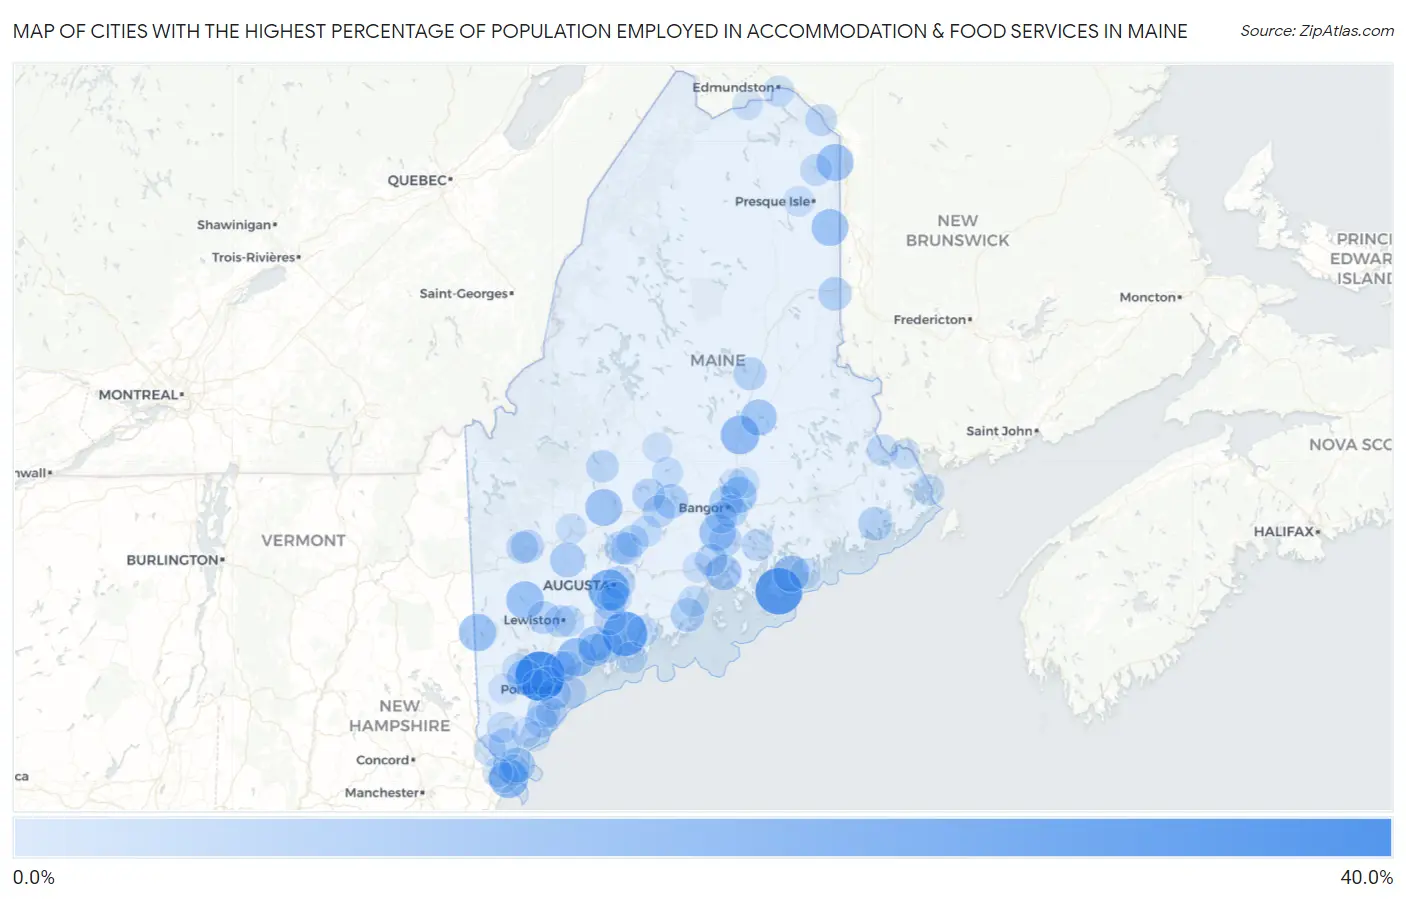
Map of Cities with the Highest Percentage of Population Employed in Accommodation & Food Services in Maine
0.0%
40.0%
Cities with the Highest Percentage of Population Employed in Accommodation & Food Services in Maine
| City | % Employed | vs State | vs National | |
| 1. | South Windham | 35.3% | 6.1%(+29.2)#1 | 6.9%(+28.4)#345 |
| 2. | Southwest Harbor | 30.6% | 6.1%(+24.5)#2 | 6.9%(+23.7)#464 |
| 3. | Wiscasset | 27.1% | 6.1%(+21.0)#3 | 6.9%(+20.2)#605 |
| 4. | Cornish | 24.7% | 6.1%(+18.6)#4 | 6.9%(+17.8)#762 |
| 5. | North Anson | 24.1% | 6.1%(+18.0)#5 | 6.9%(+17.2)#812 |
| 6. | Hallowell | 21.5% | 6.1%(+15.4)#6 | 6.9%(+14.7)#1,054 |
| 7. | Kittery Point | 17.7% | 6.1%(+11.6)#7 | 6.9%(+10.9)#1,672 |
| 8. | Howland | 17.6% | 6.1%(+11.5)#8 | 6.9%(+10.7)#1,699 |
| 9. | Freeport | 17.4% | 6.1%(+11.3)#9 | 6.9%(+10.6)#1,728 |
| 10. | Dunstan | 17.0% | 6.1%(+10.9)#10 | 6.9%(+10.1)#1,842 |
| 11. | Norway | 15.7% | 6.1%(+9.64)#11 | 6.9%(+8.86)#2,191 |
| 12. | Fryeburg | 15.7% | 6.1%(+9.60)#12 | 6.9%(+8.83)#2,197 |
| 13. | Corinna | 15.0% | 6.1%(+8.90)#13 | 6.9%(+8.12)#2,442 |
| 14. | Limestone | 14.9% | 6.1%(+8.82)#14 | 6.9%(+8.04)#2,476 |
| 15. | Mars Hill | 14.8% | 6.1%(+8.73)#15 | 6.9%(+7.96)#2,508 |
| 16. | Madison | 14.8% | 6.1%(+8.69)#16 | 6.9%(+7.92)#2,521 |
| 17. | Winterport | 14.2% | 6.1%(+8.10)#17 | 6.9%(+7.32)#2,776 |
| 18. | Rangeley | 14.2% | 6.1%(+8.10)#18 | 6.9%(+7.32)#2,777 |
| 19. | Bar Harbor | 14.2% | 6.1%(+8.06)#19 | 6.9%(+7.28)#2,796 |
| 20. | Lincoln | 13.6% | 6.1%(+7.54)#20 | 6.9%(+6.77)#3,020 |
| 21. | Orono | 13.5% | 6.1%(+7.35)#21 | 6.9%(+6.58)#3,137 |
| 22. | Standish | 13.3% | 6.1%(+7.15)#22 | 6.9%(+6.37)#3,235 |
| 23. | Castine | 12.7% | 6.1%(+6.58)#23 | 6.9%(+5.80)#3,560 |
| 24. | Topsham | 12.0% | 6.1%(+5.94)#24 | 6.9%(+5.17)#3,972 |
| 25. | Cape Neddick | 11.8% | 6.1%(+5.72)#25 | 6.9%(+4.94)#4,136 |
| 26. | Livermore Falls | 11.6% | 6.1%(+5.46)#26 | 6.9%(+4.68)#4,319 |
| 27. | Newport | 10.8% | 6.1%(+4.69)#27 | 6.9%(+3.92)#4,952 |
| 28. | Bangor | 10.2% | 6.1%(+4.11)#28 | 6.9%(+3.33)#5,546 |
| 29. | Rockland | 9.7% | 6.1%(+3.62)#29 | 6.9%(+2.84)#6,113 |
| 30. | Machias | 9.7% | 6.1%(+3.60)#30 | 6.9%(+2.82)#6,136 |
| 31. | Bath | 9.7% | 6.1%(+3.58)#31 | 6.9%(+2.80)#6,153 |
| 32. | Kezar Falls | 9.7% | 6.1%(+3.56)#32 | 6.9%(+2.79)#6,174 |
| 33. | Houlton | 9.5% | 6.1%(+3.38)#33 | 6.9%(+2.60)#6,404 |
| 34. | Mechanic Falls | 9.1% | 6.1%(+2.98)#34 | 6.9%(+2.20)#6,982 |
| 35. | Oakland | 9.0% | 6.1%(+2.92)#35 | 6.9%(+2.15)#7,050 |
| 36. | Mexico | 9.0% | 6.1%(+2.86)#36 | 6.9%(+2.08)#7,160 |
| 37. | North Berwick | 9.0% | 6.1%(+2.85)#37 | 6.9%(+2.08)#7,168 |
| 38. | East Millinocket | 8.8% | 6.1%(+2.74)#38 | 6.9%(+1.97)#7,343 |
| 39. | Saco | 8.8% | 6.1%(+2.74)#39 | 6.9%(+1.96)#7,351 |
| 40. | Brunswick | 8.8% | 6.1%(+2.72)#40 | 6.9%(+1.94)#7,385 |
| 41. | Northeast Harbor | 8.8% | 6.1%(+2.70)#41 | 6.9%(+1.92)#7,399 |
| 42. | Augusta | 8.7% | 6.1%(+2.62)#42 | 6.9%(+1.84)#7,508 |
| 43. | Hartland | 8.7% | 6.1%(+2.58)#43 | 6.9%(+1.80)#7,577 |
| 44. | Bucksport | 8.6% | 6.1%(+2.51)#44 | 6.9%(+1.74)#7,671 |
| 45. | Richmond | 8.4% | 6.1%(+2.28)#45 | 6.9%(+1.50)#8,075 |
| 46. | Cumberland Center | 8.3% | 6.1%(+2.19)#46 | 6.9%(+1.41)#8,244 |
| 47. | Biddeford | 8.3% | 6.1%(+2.17)#47 | 6.9%(+1.40)#8,269 |
| 48. | Portland | 8.3% | 6.1%(+2.15)#48 | 6.9%(+1.37)#8,304 |
| 49. | Brewer | 8.2% | 6.1%(+2.09)#49 | 6.9%(+1.31)#8,417 |
| 50. | Pittsfield | 8.1% | 6.1%(+2.03)#50 | 6.9%(+1.25)#8,509 |
| 51. | Searsport | 8.0% | 6.1%(+1.88)#51 | 6.9%(+1.10)#8,788 |
| 52. | Bingham | 8.0% | 6.1%(+1.87)#52 | 6.9%(+1.09)#8,811 |
| 53. | Turner | 7.9% | 6.1%(+1.81)#53 | 6.9%(+1.03)#8,932 |
| 54. | South Portland | 7.8% | 6.1%(+1.75)#54 | 6.9%(+0.969)#9,024 |
| 55. | Fairfield | 7.7% | 6.1%(+1.59)#55 | 6.9%(+0.811)#9,319 |
| 56. | Waterville | 7.6% | 6.1%(+1.49)#56 | 6.9%(+0.718)#9,530 |
| 57. | Auburn | 7.6% | 6.1%(+1.48)#57 | 6.9%(+0.707)#9,558 |
| 58. | Rumford | 7.6% | 6.1%(+1.47)#58 | 6.9%(+0.694)#9,601 |
| 59. | Ellsworth | 7.5% | 6.1%(+1.42)#59 | 6.9%(+0.639)#9,712 |
| 60. | Berwick | 7.4% | 6.1%(+1.29)#60 | 6.9%(+0.510)#10,011 |
| 61. | Hampden | 7.4% | 6.1%(+1.26)#61 | 6.9%(+0.485)#10,061 |
| 62. | Westbrook | 7.4% | 6.1%(+1.25)#62 | 6.9%(+0.475)#10,071 |
| 63. | Van Buren | 7.3% | 6.1%(+1.16)#63 | 6.9%(+0.379)#10,251 |
| 64. | Caribou | 7.1% | 6.1%(+0.972)#64 | 6.9%(+0.195)#10,632 |
| 65. | Gardiner | 6.8% | 6.1%(+0.720)#65 | 6.9%(-0.057)#11,225 |
| 66. | Boothbay Harbor | 6.8% | 6.1%(+0.700)#66 | 6.9%(-0.077)#11,273 |
| 67. | Woodland | 6.7% | 6.1%(+0.549)#67 | 6.9%(-0.228)#11,636 |
| 68. | Damariscotta | 6.4% | 6.1%(+0.333)#68 | 6.9%(-0.444)#12,156 |
| 69. | York Harbor | 6.4% | 6.1%(+0.259)#69 | 6.9%(-0.518)#12,329 |
| 70. | Farmingdale | 6.2% | 6.1%(+0.146)#70 | 6.9%(-0.631)#12,579 |
| 71. | Lewiston | 6.2% | 6.1%(+0.112)#71 | 6.9%(-0.664)#12,690 |
| 72. | Clinton | 6.2% | 6.1%(+0.094)#72 | 6.9%(-0.683)#12,743 |
| 73. | Eastport | 6.1% | 6.1%(+0.023)#73 | 6.9%(-0.754)#12,922 |
| 74. | Randolph | 6.1% | 6.1%(+0.001)#74 | 6.9%(-0.775)#12,975 |
| 75. | Madawaska | 6.1% | 6.1%(-0.009)#75 | 6.9%(-0.786)#13,006 |
| 76. | Milford | 6.1% | 6.1%(-0.044)#76 | 6.9%(-0.820)#13,081 |
| 77. | Bethel | 6.0% | 6.1%(-0.058)#77 | 6.9%(-0.834)#13,127 |
| 78. | Sanford | 6.0% | 6.1%(-0.139)#78 | 6.9%(-0.916)#13,339 |
| 79. | Camden | 5.8% | 6.1%(-0.280)#79 | 6.9%(-1.06)#13,683 |
| 80. | Gorham | 5.8% | 6.1%(-0.289)#80 | 6.9%(-1.07)#13,704 |
| 81. | Island Falls | 5.8% | 6.1%(-0.319)#81 | 6.9%(-1.10)#13,779 |
| 82. | Dexter | 5.6% | 6.1%(-0.481)#82 | 6.9%(-1.26)#14,179 |
| 83. | Old Orchard Beach | 5.5% | 6.1%(-0.570)#83 | 6.9%(-1.35)#14,386 |
| 84. | Steep Falls | 5.5% | 6.1%(-0.606)#84 | 6.9%(-1.38)#14,475 |
| 85. | Jonesport | 5.4% | 6.1%(-0.699)#85 | 6.9%(-1.48)#14,707 |
| 86. | Kittery | 5.4% | 6.1%(-0.702)#86 | 6.9%(-1.48)#14,722 |
| 87. | Mapleton | 5.3% | 6.1%(-0.757)#87 | 6.9%(-1.53)#14,853 |
| 88. | Patten | 5.3% | 6.1%(-0.794)#88 | 6.9%(-1.57)#14,953 |
| 89. | Winter Harbor | 5.3% | 6.1%(-0.841)#89 | 6.9%(-1.62)#15,070 |
| 90. | Calais | 5.2% | 6.1%(-0.943)#90 | 6.9%(-1.72)#15,311 |
| 91. | Farmington | 5.1% | 6.1%(-1.04)#91 | 6.9%(-1.81)#15,538 |
| 92. | Lake Arrowhead | 5.0% | 6.1%(-1.08)#92 | 6.9%(-1.86)#15,643 |
| 93. | Yarmouth | 4.9% | 6.1%(-1.23)#93 | 6.9%(-2.01)#16,059 |
| 94. | Fort Kent | 4.8% | 6.1%(-1.28)#94 | 6.9%(-2.06)#16,180 |
| 95. | Kennebunkport | 4.8% | 6.1%(-1.29)#95 | 6.9%(-2.06)#16,192 |
| 96. | Belfast | 4.6% | 6.1%(-1.50)#96 | 6.9%(-2.28)#16,733 |
| 97. | Old Town | 4.4% | 6.1%(-1.70)#97 | 6.9%(-2.47)#17,260 |
| 98. | Guilford | 4.4% | 6.1%(-1.74)#98 | 6.9%(-2.51)#17,349 |
| 99. | South Eliot | 4.3% | 6.1%(-1.81)#99 | 6.9%(-2.58)#17,530 |
| 100. | Kennebunk | 4.3% | 6.1%(-1.82)#100 | 6.9%(-2.60)#17,571 |
1
2Common Questions
What are the Top 10 Cities with the Highest Percentage of Population Employed in Accommodation & Food Services in Maine?
Top 10 Cities with the Highest Percentage of Population Employed in Accommodation & Food Services in Maine are:
#1
35.3%
#2
30.6%
#3
27.1%
#4
21.5%
#5
17.7%
#6
17.6%
#7
17.4%
#8
15.7%
#9
15.7%
#10
14.9%
What city has the Highest Percentage of Population Employed in Accommodation & Food Services in Maine?
South Windham has the Highest Percentage of Population Employed in Accommodation & Food Services in Maine with 35.3%.
What is the Percentage of Population Employed in Accommodation & Food Services in the State of Maine?
Percentage of Population Employed in Accommodation & Food Services in Maine is 6.1%.
What is the Percentage of Population Employed in Accommodation & Food Services in the United States?
Percentage of Population Employed in Accommodation & Food Services in the United States is 6.9%.