South Lake Tahoe, CA Map & Demographics
South Lake Tahoe Map
South Lake Tahoe Overview
$46,093
PER CAPITA INCOME
$86,588
AVG FAMILY INCOME
$67,686
AVG HOUSEHOLD INCOME
15.3%
WAGE / INCOME GAP [ % ]
84.7¢/ $1
WAGE / INCOME GAP [ $ ]
0.53
INEQUALITY / GINI INDEX
21,346
TOTAL POPULATION
10,775
MALE POPULATION
10,571
FEMALE POPULATION
101.93
MALES / 100 FEMALES
98.11
FEMALES / 100 MALES
38.9
MEDIAN AGE
2.9
AVG FAMILY SIZE
2.3
AVG HOUSEHOLD SIZE
12,669
LABOR FORCE [ PEOPLE ]
69.3%
PERCENT IN LABOR FORCE
4.6%
UNEMPLOYMENT RATE
South Lake Tahoe Zip Codes
South Lake Tahoe Area Codes
Income in South Lake Tahoe
Income Overview in South Lake Tahoe
Per Capita Income in South Lake Tahoe is $46,093, while median incomes of families and households are $86,588 and $67,686 respectively.
| Characteristic | Number | Measure |
| Per Capita Income | 21,346 | $46,093 |
| Median Family Income | 4,932 | $86,588 |
| Mean Family Income | 4,932 | $136,203 |
| Median Household Income | 9,125 | $67,686 |
| Mean Household Income | 9,125 | $106,983 |
| Income Deficit | 4,932 | $0 |
| Wage / Income Gap (%) | 21,346 | 15.29% |
| Wage / Income Gap ($) | 21,346 | 84.71¢ per $1 |
| Gini / Inequality Index | 21,346 | 0.53 |
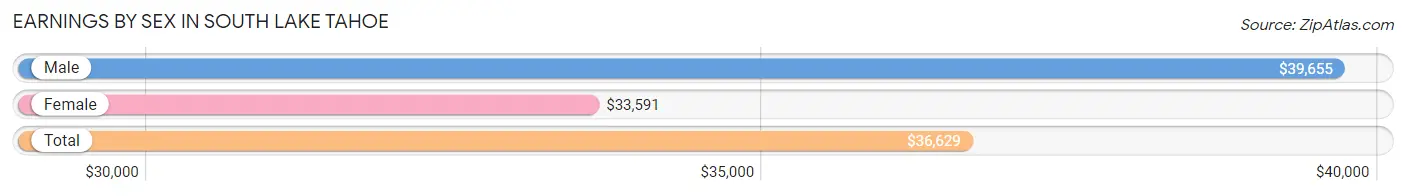
Earnings by Sex in South Lake Tahoe
Average Earnings in South Lake Tahoe are $36,629, $39,655 for men and $33,591 for women, a difference of 15.3%.
| Sex | Number | Average Earnings |
| Male | 7,068 (54.2%) | $39,655 |
| Female | 5,969 (45.8%) | $33,591 |
| Total | 13,037 (100.0%) | $36,629 |
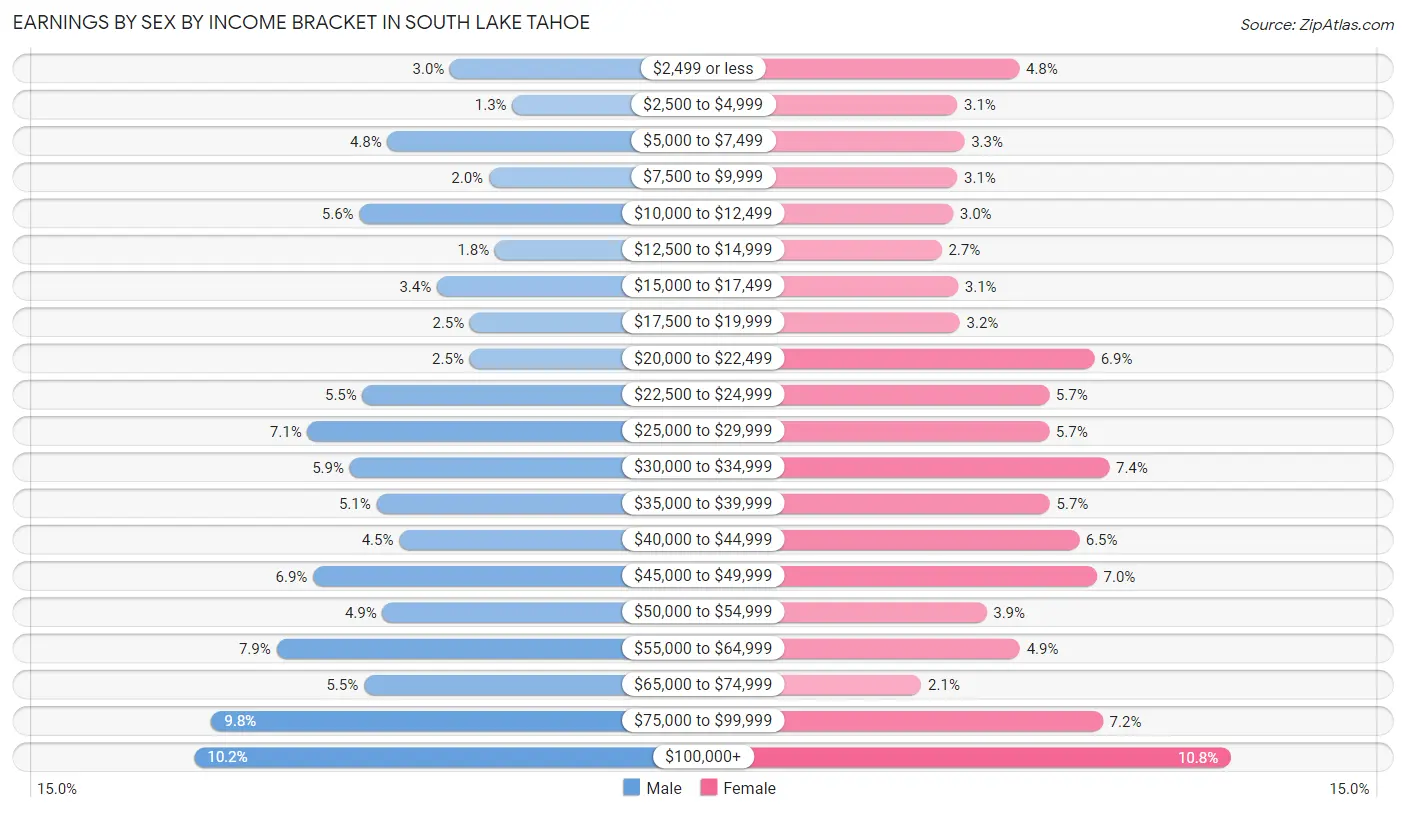
Earnings by Sex by Income Bracket in South Lake Tahoe
The most common earnings brackets in South Lake Tahoe are $100,000+ for men (723 | 10.2%) and $100,000+ for women (643 | 10.8%).
| Income | Male | Female |
| $2,499 or less | 215 (3.0%) | 289 (4.8%) |
| $2,500 to $4,999 | 91 (1.3%) | 185 (3.1%) |
| $5,000 to $7,499 | 339 (4.8%) | 197 (3.3%) |
| $7,500 to $9,999 | 138 (1.9%) | 185 (3.1%) |
| $10,000 to $12,499 | 395 (5.6%) | 178 (3.0%) |
| $12,500 to $14,999 | 126 (1.8%) | 159 (2.7%) |
| $15,000 to $17,499 | 241 (3.4%) | 186 (3.1%) |
| $17,500 to $19,999 | 175 (2.5%) | 189 (3.2%) |
| $20,000 to $22,499 | 176 (2.5%) | 414 (6.9%) |
| $22,500 to $24,999 | 389 (5.5%) | 339 (5.7%) |
| $25,000 to $29,999 | 498 (7.0%) | 339 (5.7%) |
| $30,000 to $34,999 | 414 (5.9%) | 440 (7.4%) |
| $35,000 to $39,999 | 361 (5.1%) | 340 (5.7%) |
| $40,000 to $44,999 | 316 (4.5%) | 389 (6.5%) |
| $45,000 to $49,999 | 487 (6.9%) | 419 (7.0%) |
| $50,000 to $54,999 | 349 (4.9%) | 234 (3.9%) |
| $55,000 to $64,999 | 560 (7.9%) | 290 (4.9%) |
| $65,000 to $74,999 | 386 (5.5%) | 125 (2.1%) |
| $75,000 to $99,999 | 689 (9.8%) | 429 (7.2%) |
| $100,000+ | 723 (10.2%) | 643 (10.8%) |
| Total | 7,068 (100.0%) | 5,969 (100.0%) |
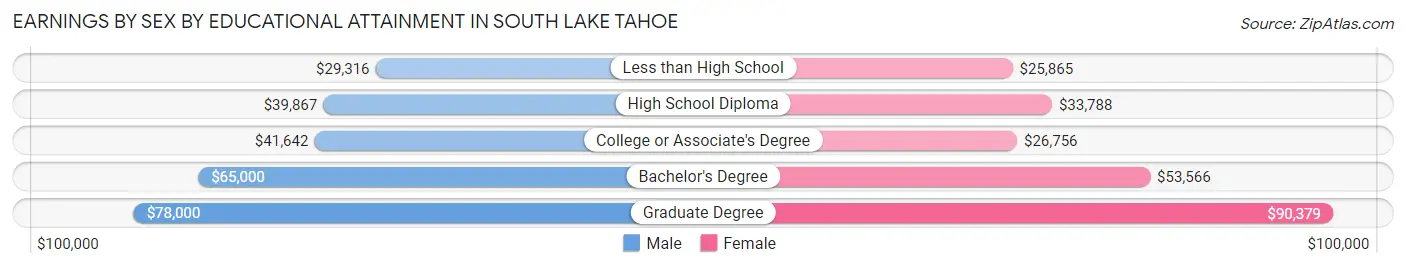
Earnings by Sex by Educational Attainment in South Lake Tahoe
Average earnings in South Lake Tahoe are $45,373 for men and $38,113 for women, a difference of 16.0%. Men with an educational attainment of graduate degree enjoy the highest average annual earnings of $78,000, while those with less than high school education earn the least with $29,316. Women with an educational attainment of graduate degree earn the most with the average annual earnings of $90,379, while those with less than high school education have the smallest earnings of $25,865.
| Educational Attainment | Male Income | Female Income |
| Less than High School | $29,316 | $25,865 |
| High School Diploma | $39,867 | $33,788 |
| College or Associate's Degree | $41,642 | $26,756 |
| Bachelor's Degree | $65,000 | $53,566 |
| Graduate Degree | $78,000 | $90,379 |
| Total | $45,373 | $38,113 |
Family Income in South Lake Tahoe
Family Income Brackets in South Lake Tahoe
According to the South Lake Tahoe family income data, there are 1,051 families falling into the $100,000 to $149,999 income range, which is the most common income bracket and makes up 21.3% of all families. Conversely, the $10,000 to $14,999 income bracket is the least frequent group with only 39 families (0.8%) belonging to this category.
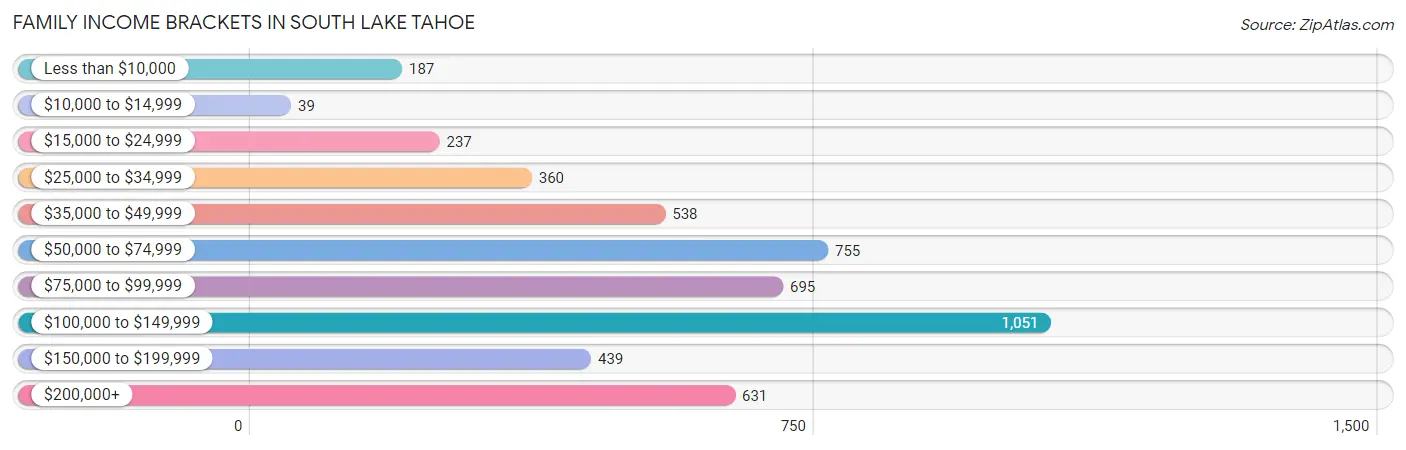
| Income Bracket | # Families | % Families |
| Less than $10,000 | 187 | 3.8% |
| $10,000 to $14,999 | 39 | 0.8% |
| $15,000 to $24,999 | 237 | 4.8% |
| $25,000 to $34,999 | 360 | 7.3% |
| $35,000 to $49,999 | 538 | 10.9% |
| $50,000 to $74,999 | 755 | 15.3% |
| $75,000 to $99,999 | 695 | 14.1% |
| $100,000 to $149,999 | 1,051 | 21.3% |
| $150,000 to $199,999 | 439 | 8.9% |
| $200,000+ | 631 | 12.8% |
Family Income by Famaliy Size in South Lake Tahoe
6-person families (105 | 2.1%) account for the highest median family income in South Lake Tahoe with $119,453 per family, while 2-person families (2,504 | 50.8%) have the highest median income of $38,082 per family member.
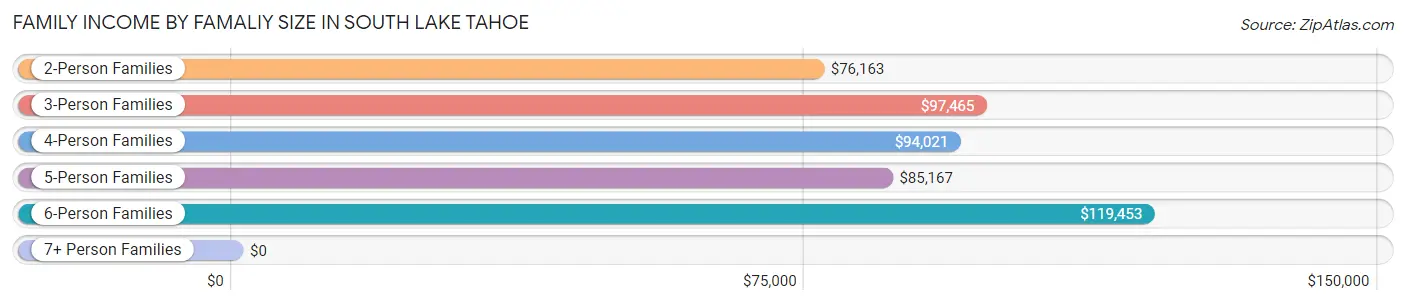
| Income Bracket | # Families | Median Income |
| 2-Person Families | 2,504 (50.8%) | $76,163 |
| 3-Person Families | 1,149 (23.3%) | $97,465 |
| 4-Person Families | 799 (16.2%) | $94,021 |
| 5-Person Families | 338 (6.9%) | $85,167 |
| 6-Person Families | 105 (2.1%) | $119,453 |
| 7+ Person Families | 37 (0.7%) | $0 |
| Total | 4,932 (100.0%) | $86,588 |
Family Income by Number of Earners in South Lake Tahoe
The median family income in South Lake Tahoe is $86,588, with families comprising 3+ earners (705) having the highest median family income of $127,610, while families with no earners (779) have the lowest median family income of $52,829, accounting for 14.3% and 15.8% of families, respectively.
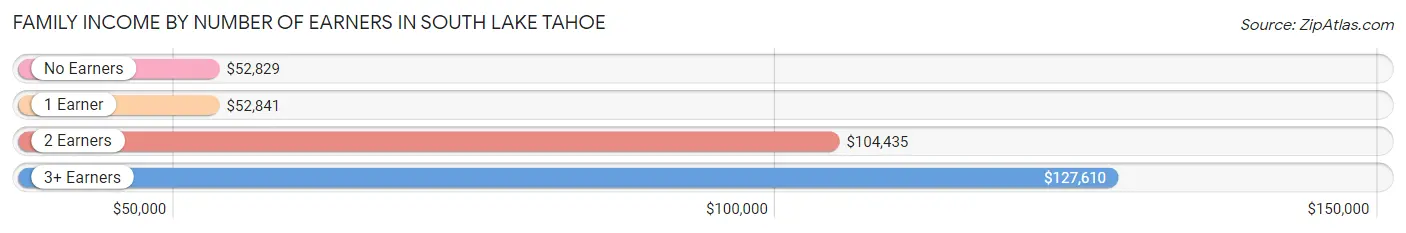
| Number of Earners | # Families | Median Income |
| No Earners | 779 (15.8%) | $52,829 |
| 1 Earner | 1,387 (28.1%) | $52,841 |
| 2 Earners | 2,061 (41.8%) | $104,435 |
| 3+ Earners | 705 (14.3%) | $127,610 |
| Total | 4,932 (100.0%) | $86,588 |
Household Income in South Lake Tahoe
Household Income Brackets in South Lake Tahoe
With 1,533 households falling in the category, the $100,000 to $149,999 income range is the most frequent in South Lake Tahoe, accounting for 16.8% of all households. In contrast, only 310 households (3.4%) fall into the $10,000 to $14,999 income bracket, making it the least populous group.
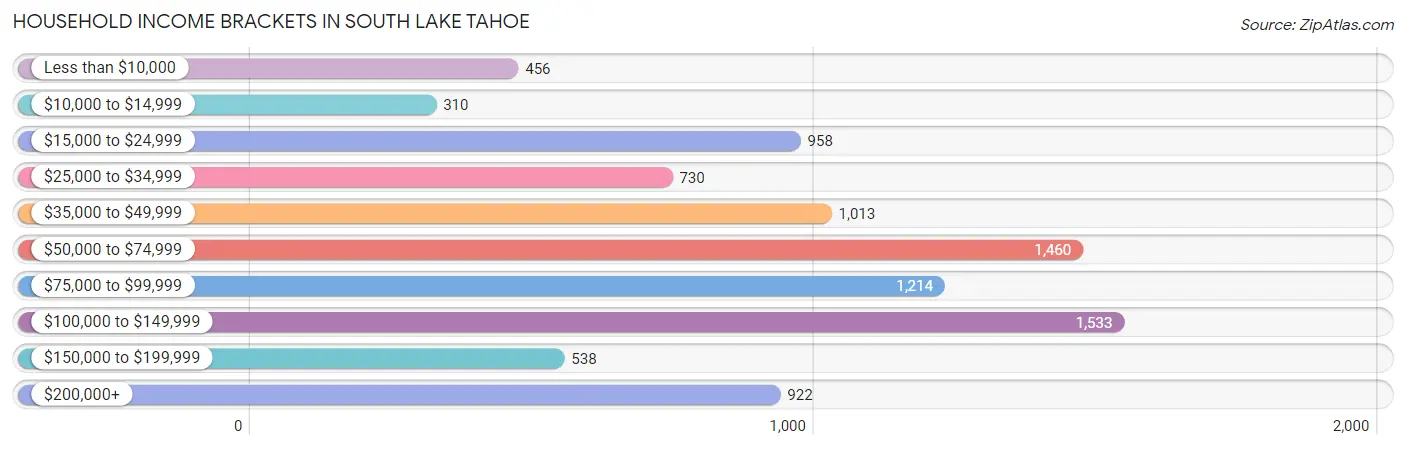
| Income Bracket | # Households | % Households |
| Less than $10,000 | 456 | 5.0% |
| $10,000 to $14,999 | 310 | 3.4% |
| $15,000 to $24,999 | 958 | 10.5% |
| $25,000 to $34,999 | 730 | 8.0% |
| $35,000 to $49,999 | 1,013 | 11.1% |
| $50,000 to $74,999 | 1,460 | 16.0% |
| $75,000 to $99,999 | 1,214 | 13.3% |
| $100,000 to $149,999 | 1,533 | 16.8% |
| $150,000 to $199,999 | 538 | 5.9% |
| $200,000+ | 922 | 10.1% |
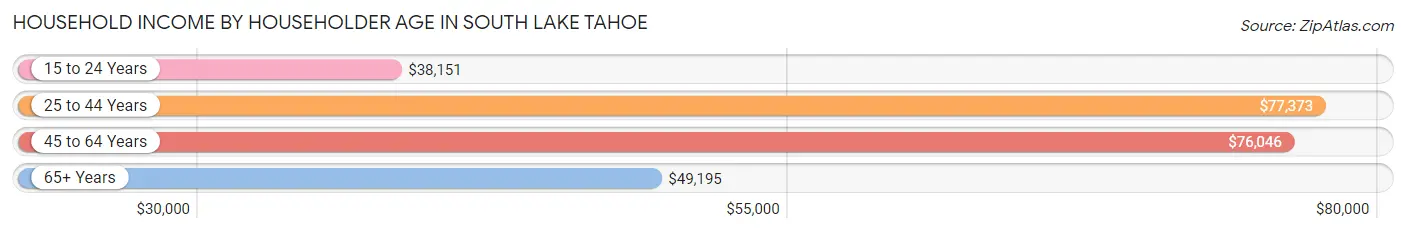
Household Income by Householder Age in South Lake Tahoe
The median household income in South Lake Tahoe is $67,686, with the highest median household income of $77,373 found in the 25 to 44 years age bracket for the primary householder. A total of 3,371 households (36.9%) fall into this category. Meanwhile, the 15 to 24 years age bracket for the primary householder has the lowest median household income of $38,151, with 245 households (2.7%) in this group.
| Income Bracket | # Households | Median Income |
| 15 to 24 Years | 245 (2.7%) | $38,151 |
| 25 to 44 Years | 3,371 (36.9%) | $77,373 |
| 45 to 64 Years | 3,243 (35.5%) | $76,046 |
| 65+ Years | 2,266 (24.8%) | $49,195 |
| Total | 9,125 (100.0%) | $67,686 |
Poverty in South Lake Tahoe
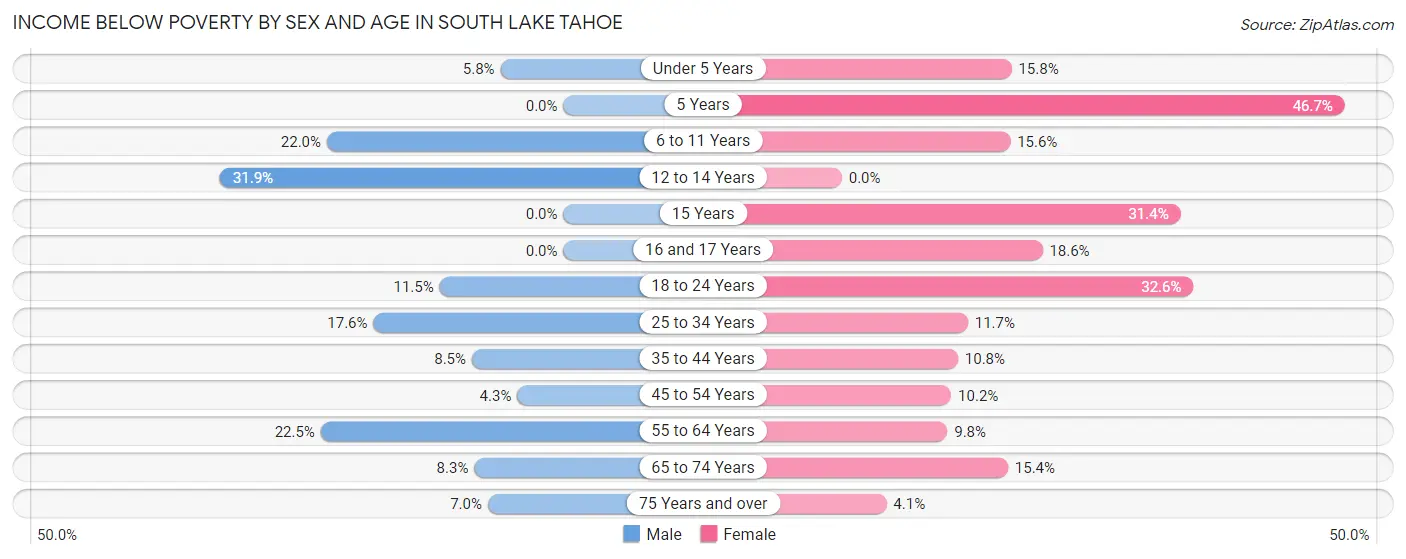
Income Below Poverty by Sex and Age in South Lake Tahoe
With 12.9% poverty level for males and 13.8% for females among the residents of South Lake Tahoe, 12 to 14 year old males and 5 year old females are the most vulnerable to poverty, with 87 males (31.9%) and 35 females (46.7%) in their respective age groups living below the poverty level.
| Age Bracket | Male | Female |
| Under 5 Years | 26 (5.8%) | 77 (15.8%) |
| 5 Years | 0 (0.0%) | 35 (46.7%) |
| 6 to 11 Years | 108 (22.0%) | 88 (15.6%) |
| 12 to 14 Years | 87 (31.9%) | 0 (0.0%) |
| 15 Years | 0 (0.0%) | 55 (31.4%) |
| 16 and 17 Years | 0 (0.0%) | 35 (18.6%) |
| 18 to 24 Years | 116 (11.5%) | 322 (32.6%) |
| 25 to 34 Years | 323 (17.6%) | 223 (11.7%) |
| 35 to 44 Years | 161 (8.5%) | 142 (10.8%) |
| 45 to 54 Years | 45 (4.3%) | 118 (10.2%) |
| 55 to 64 Years | 363 (22.5%) | 159 (9.8%) |
| 65 to 74 Years | 103 (8.3%) | 174 (15.4%) |
| 75 Years and over | 34 (7.0%) | 22 (4.1%) |
| Total | 1,366 (12.9%) | 1,450 (13.8%) |
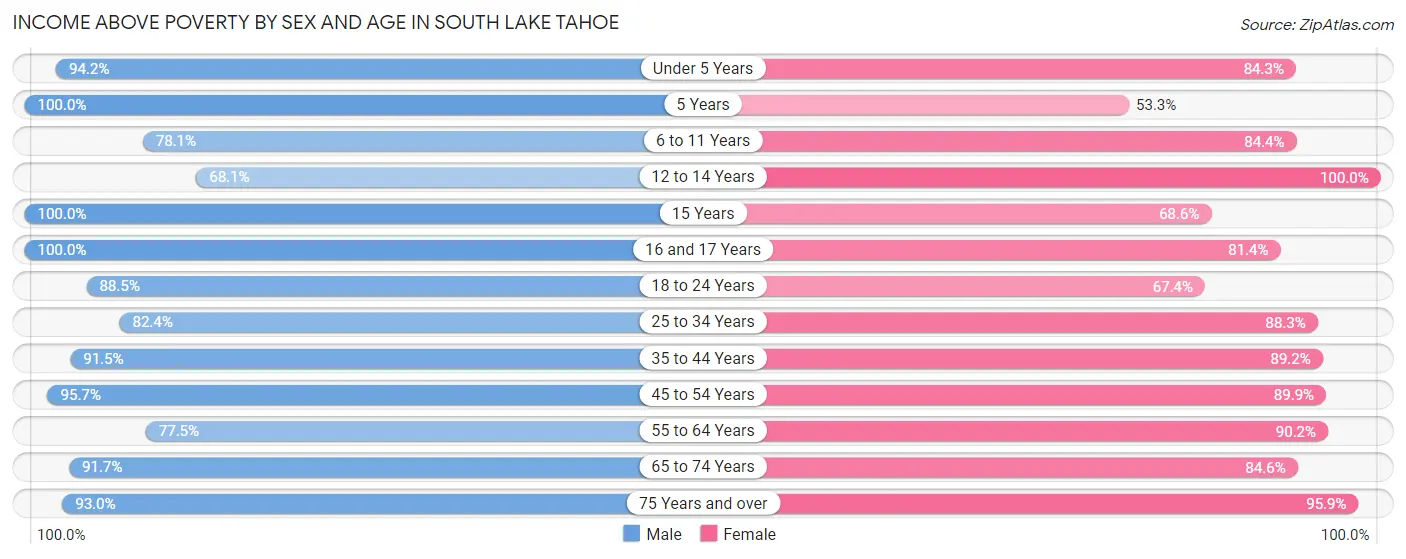
Income Above Poverty by Sex and Age in South Lake Tahoe
According to the poverty statistics in South Lake Tahoe, males aged 5 years and females aged 12 to 14 years are the age groups that are most secure financially, with 100.0% of males and 100.0% of females in these age groups living above the poverty line.
| Age Bracket | Male | Female |
| Under 5 Years | 419 (94.2%) | 412 (84.3%) |
| 5 Years | 90 (100.0%) | 40 (53.3%) |
| 6 to 11 Years | 384 (78.0%) | 475 (84.4%) |
| 12 to 14 Years | 186 (68.1%) | 356 (100.0%) |
| 15 Years | 37 (100.0%) | 120 (68.6%) |
| 16 and 17 Years | 140 (100.0%) | 153 (81.4%) |
| 18 to 24 Years | 894 (88.5%) | 665 (67.4%) |
| 25 to 34 Years | 1,509 (82.4%) | 1,685 (88.3%) |
| 35 to 44 Years | 1,735 (91.5%) | 1,177 (89.2%) |
| 45 to 54 Years | 1,006 (95.7%) | 1,045 (89.8%) |
| 55 to 64 Years | 1,249 (77.5%) | 1,465 (90.2%) |
| 65 to 74 Years | 1,142 (91.7%) | 955 (84.6%) |
| 75 Years and over | 451 (93.0%) | 509 (95.9%) |
| Total | 9,242 (87.1%) | 9,057 (86.2%) |
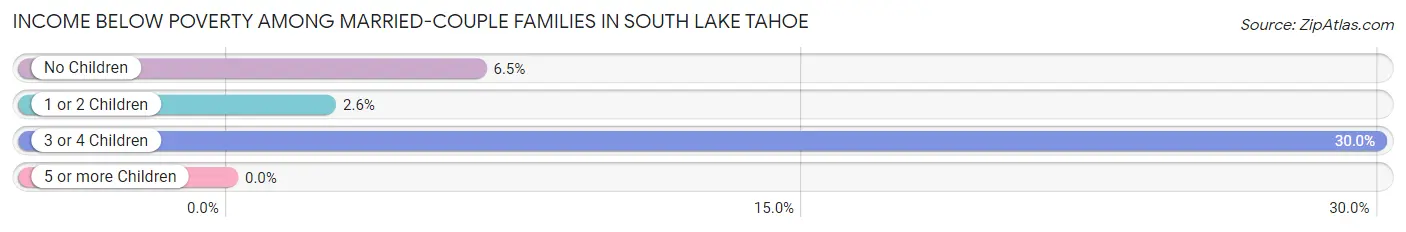
Income Below Poverty Among Married-Couple Families in South Lake Tahoe
The poverty statistics for married-couple families in South Lake Tahoe show that 6.7% or 231 of the total 3,459 families live below the poverty line. Families with 3 or 4 children have the highest poverty rate of 30.0%, comprising of 66 families. On the other hand, families with 5 or more children have the lowest poverty rate of 0.0%, which includes 0 families.
| Children | Above Poverty | Below Poverty |
| No Children | 1,961 (93.5%) | 136 (6.5%) |
| 1 or 2 Children | 1,106 (97.4%) | 29 (2.6%) |
| 3 or 4 Children | 154 (70.0%) | 66 (30.0%) |
| 5 or more Children | 7 (100.0%) | 0 (0.0%) |
| Total | 3,228 (93.3%) | 231 (6.7%) |
Income Below Poverty Among Single-Parent Households in South Lake Tahoe
According to the poverty data in South Lake Tahoe, 20.5% or 74 single-father households and 16.9% or 188 single-mother households are living below the poverty line. Among single-father households, those with 1 or 2 children have the highest poverty rate, with 50 households (22.0%) experiencing poverty. Likewise, among single-mother households, those with 1 or 2 children have the highest poverty rate, with 101 households (26.7%) falling below the poverty line.
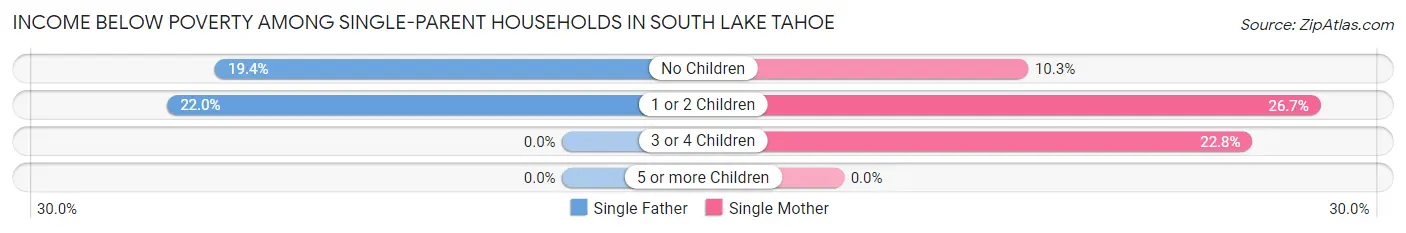
| Children | Single Father | Single Mother |
| No Children | 24 (19.4%) | 66 (10.3%) |
| 1 or 2 Children | 50 (22.0%) | 101 (26.7%) |
| 3 or 4 Children | 0 (0.0%) | 21 (22.8%) |
| 5 or more Children | 0 (0.0%) | 0 (0.0%) |
| Total | 74 (20.5%) | 188 (16.9%) |
Income Below Poverty Among Married-Couple vs Single-Parent Households in South Lake Tahoe
The poverty data for South Lake Tahoe shows that 231 of the married-couple family households (6.7%) and 262 of the single-parent households (17.8%) are living below the poverty level. Within the married-couple family households, those with 3 or 4 children have the highest poverty rate, with 66 households (30.0%) falling below the poverty line. Among the single-parent households, those with 1 or 2 children have the highest poverty rate, with 151 household (24.9%) living below poverty.
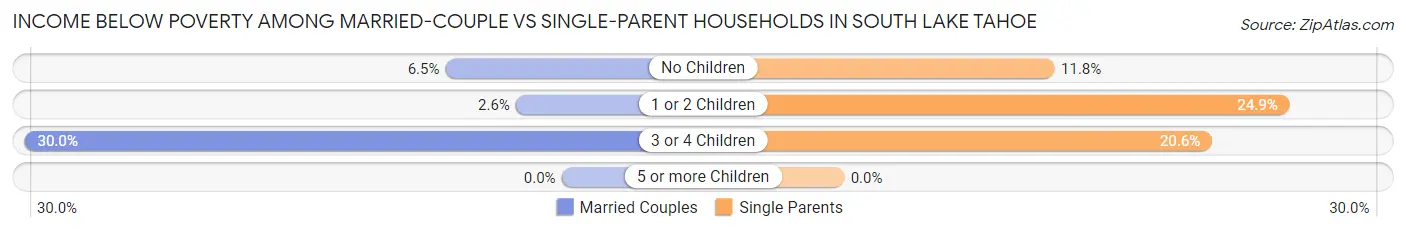
| Children | Married-Couple Families | Single-Parent Households |
| No Children | 136 (6.5%) | 90 (11.8%) |
| 1 or 2 Children | 29 (2.6%) | 151 (24.9%) |
| 3 or 4 Children | 66 (30.0%) | 21 (20.6%) |
| 5 or more Children | 0 (0.0%) | 0 (0.0%) |
| Total | 231 (6.7%) | 262 (17.8%) |
Race in South Lake Tahoe
The most populous races in South Lake Tahoe are White / Caucasian (15,266 | 71.5%), Hispanic or Latino (6,089 | 28.5%), and Two or more Races (2,206 | 10.3%).
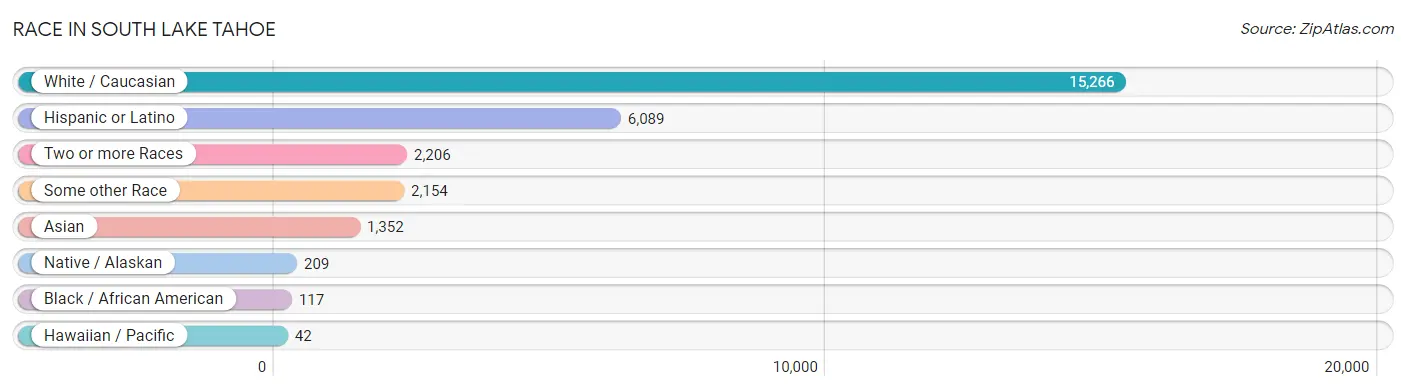
| Race | # Population | % Population |
| Asian | 1,352 | 6.3% |
| Black / African American | 117 | 0.5% |
| Hawaiian / Pacific | 42 | 0.2% |
| Hispanic or Latino | 6,089 | 28.5% |
| Native / Alaskan | 209 | 1.0% |
| White / Caucasian | 15,266 | 71.5% |
| Two or more Races | 2,206 | 10.3% |
| Some other Race | 2,154 | 10.1% |
| Total | 21,346 | 100.0% |
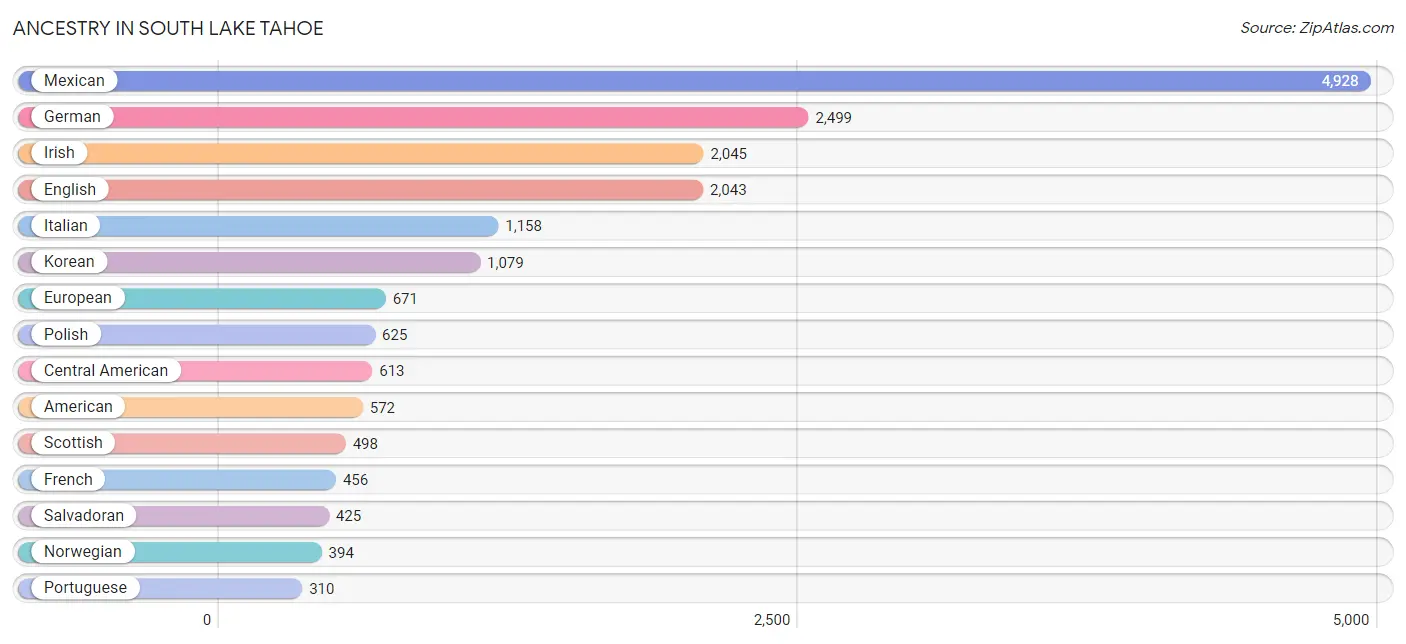
Ancestry in South Lake Tahoe
The most populous ancestries reported in South Lake Tahoe are Mexican (4,928 | 23.1%), German (2,499 | 11.7%), Irish (2,045 | 9.6%), English (2,043 | 9.6%), and Italian (1,158 | 5.4%), together accounting for 59.4% of all South Lake Tahoe residents.
| Ancestry | # Population | % Population |
| African | 12 | 0.1% |
| American | 572 | 2.7% |
| Apache | 33 | 0.2% |
| Arab | 84 | 0.4% |
| Argentinean | 57 | 0.3% |
| Armenian | 66 | 0.3% |
| Australian | 85 | 0.4% |
| Austrian | 13 | 0.1% |
| Bangladeshi | 15 | 0.1% |
| Basque | 9 | 0.0% |
| Belgian | 10 | 0.1% |
| Belizean | 1 | 0.0% |
| Bhutanese | 108 | 0.5% |
| Brazilian | 55 | 0.3% |
| British | 183 | 0.9% |
| Bulgarian | 167 | 0.8% |
| Burmese | 99 | 0.5% |
| Canadian | 137 | 0.6% |
| Carpatho Rusyn | 19 | 0.1% |
| Central American | 613 | 2.9% |
| Cherokee | 4 | 0.0% |
| Chilean | 55 | 0.3% |
| Choctaw | 24 | 0.1% |
| Colombian | 46 | 0.2% |
| Costa Rican | 82 | 0.4% |
| Croatian | 21 | 0.1% |
| Cuban | 9 | 0.0% |
| Czech | 48 | 0.2% |
| Czechoslovakian | 40 | 0.2% |
| Danish | 151 | 0.7% |
| Dutch | 196 | 0.9% |
| Eastern European | 91 | 0.4% |
| English | 2,043 | 9.6% |
| European | 671 | 3.1% |
| Finnish | 13 | 0.1% |
| French | 456 | 2.1% |
| French American Indian | 21 | 0.1% |
| French Canadian | 91 | 0.4% |
| German | 2,499 | 11.7% |
| Greek | 52 | 0.2% |
| Haitian | 8 | 0.0% |
| Honduran | 88 | 0.4% |
| Hungarian | 115 | 0.5% |
| Indian (Asian) | 52 | 0.2% |
| Indonesian | 50 | 0.2% |
| Irish | 2,045 | 9.6% |
| Italian | 1,158 | 5.4% |
| Korean | 1,079 | 5.1% |
| Latvian | 4 | 0.0% |
| Lebanese | 27 | 0.1% |
| Lithuanian | 35 | 0.2% |
| Macedonian | 22 | 0.1% |
| Mexican | 4,928 | 23.1% |
| Mexican American Indian | 34 | 0.2% |
| Moroccan | 36 | 0.2% |
| Native Hawaiian | 88 | 0.4% |
| Navajo | 7 | 0.0% |
| Nicaraguan | 18 | 0.1% |
| Northern European | 35 | 0.2% |
| Norwegian | 394 | 1.8% |
| Pakistani | 11 | 0.1% |
| Peruvian | 22 | 0.1% |
| Polish | 625 | 2.9% |
| Portuguese | 310 | 1.5% |
| Puerto Rican | 83 | 0.4% |
| Puget Sound Salish | 36 | 0.2% |
| Romanian | 70 | 0.3% |
| Russian | 115 | 0.5% |
| Salvadoran | 425 | 2.0% |
| Samoan | 2 | 0.0% |
| Scandinavian | 114 | 0.5% |
| Scotch-Irish | 121 | 0.6% |
| Scottish | 498 | 2.3% |
| Sioux | 133 | 0.6% |
| Slovak | 8 | 0.0% |
| Slovene | 27 | 0.1% |
| South American | 180 | 0.8% |
| Spaniard | 106 | 0.5% |
| Spanish | 76 | 0.4% |
| Spanish American Indian | 59 | 0.3% |
| Sri Lankan | 53 | 0.3% |
| Subsaharan African | 12 | 0.1% |
| Swedish | 310 | 1.5% |
| Swiss | 84 | 0.4% |
| Syrian | 13 | 0.1% |
| Thai | 97 | 0.4% |
| Turkish | 62 | 0.3% |
| Ukrainian | 88 | 0.4% |
| Welsh | 136 | 0.6% |
| West Indian | 11 | 0.1% |
| Yaqui | 39 | 0.2% |
| Yugoslavian | 10 | 0.1% | View All 92 Rows |
Immigrants in South Lake Tahoe
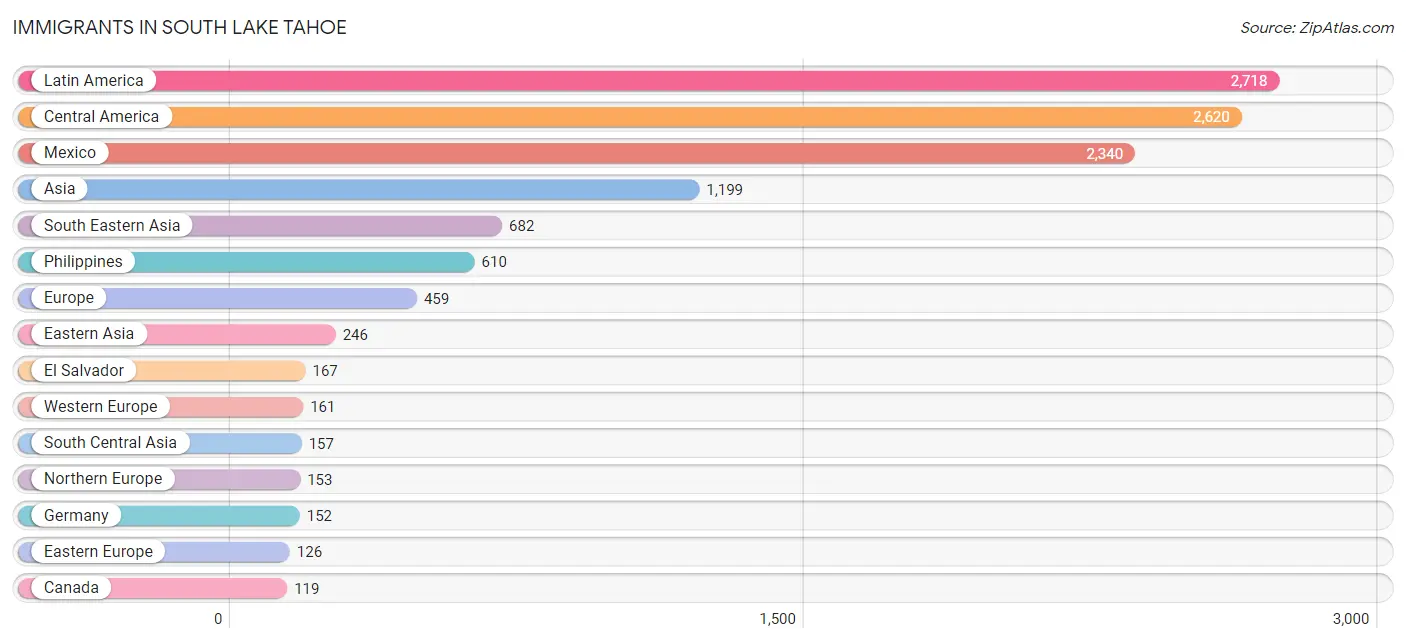
The most numerous immigrant groups reported in South Lake Tahoe came from Latin America (2,718 | 12.7%), Central America (2,620 | 12.3%), Mexico (2,340 | 11.0%), Asia (1,199 | 5.6%), and South Eastern Asia (682 | 3.2%), together accounting for 44.8% of all South Lake Tahoe residents.
| Immigration Origin | # Population | % Population |
| Africa | 37 | 0.2% |
| Argentina | 57 | 0.3% |
| Asia | 1,199 | 5.6% |
| Australia | 30 | 0.1% |
| Brazil | 31 | 0.2% |
| Bulgaria | 23 | 0.1% |
| Canada | 119 | 0.6% |
| Central America | 2,620 | 12.3% |
| Chile | 10 | 0.1% |
| China | 116 | 0.5% |
| Costa Rica | 16 | 0.1% |
| Eastern Asia | 246 | 1.1% |
| Eastern Europe | 126 | 0.6% |
| El Salvador | 167 | 0.8% |
| England | 85 | 0.4% |
| Europe | 459 | 2.1% |
| Germany | 152 | 0.7% |
| Greece | 2 | 0.0% |
| Honduras | 88 | 0.4% |
| Hong Kong | 1 | 0.0% |
| Hungary | 31 | 0.2% |
| India | 54 | 0.3% |
| Iran | 11 | 0.1% |
| Ireland | 4 | 0.0% |
| Italy | 10 | 0.1% |
| Japan | 24 | 0.1% |
| Korea | 106 | 0.5% |
| Latin America | 2,718 | 12.7% |
| Lebanon | 52 | 0.2% |
| Mexico | 2,340 | 11.0% |
| Morocco | 36 | 0.2% |
| Nepal | 15 | 0.1% |
| Nicaragua | 9 | 0.0% |
| North Macedonia | 22 | 0.1% |
| Northern Africa | 36 | 0.2% |
| Northern Europe | 153 | 0.7% |
| Oceania | 30 | 0.1% |
| Philippines | 610 | 2.9% |
| Russia | 40 | 0.2% |
| South America | 98 | 0.5% |
| South Central Asia | 157 | 0.7% |
| South Eastern Asia | 682 | 3.2% |
| Southern Europe | 19 | 0.1% |
| Spain | 7 | 0.0% |
| Sri Lanka | 77 | 0.4% |
| Sweden | 54 | 0.3% |
| Switzerland | 9 | 0.0% |
| Turkey | 62 | 0.3% |
| Vietnam | 22 | 0.1% |
| Western Asia | 114 | 0.5% |
| Western Europe | 161 | 0.7% | View All 51 Rows |
Sex and Age in South Lake Tahoe
Sex and Age in South Lake Tahoe
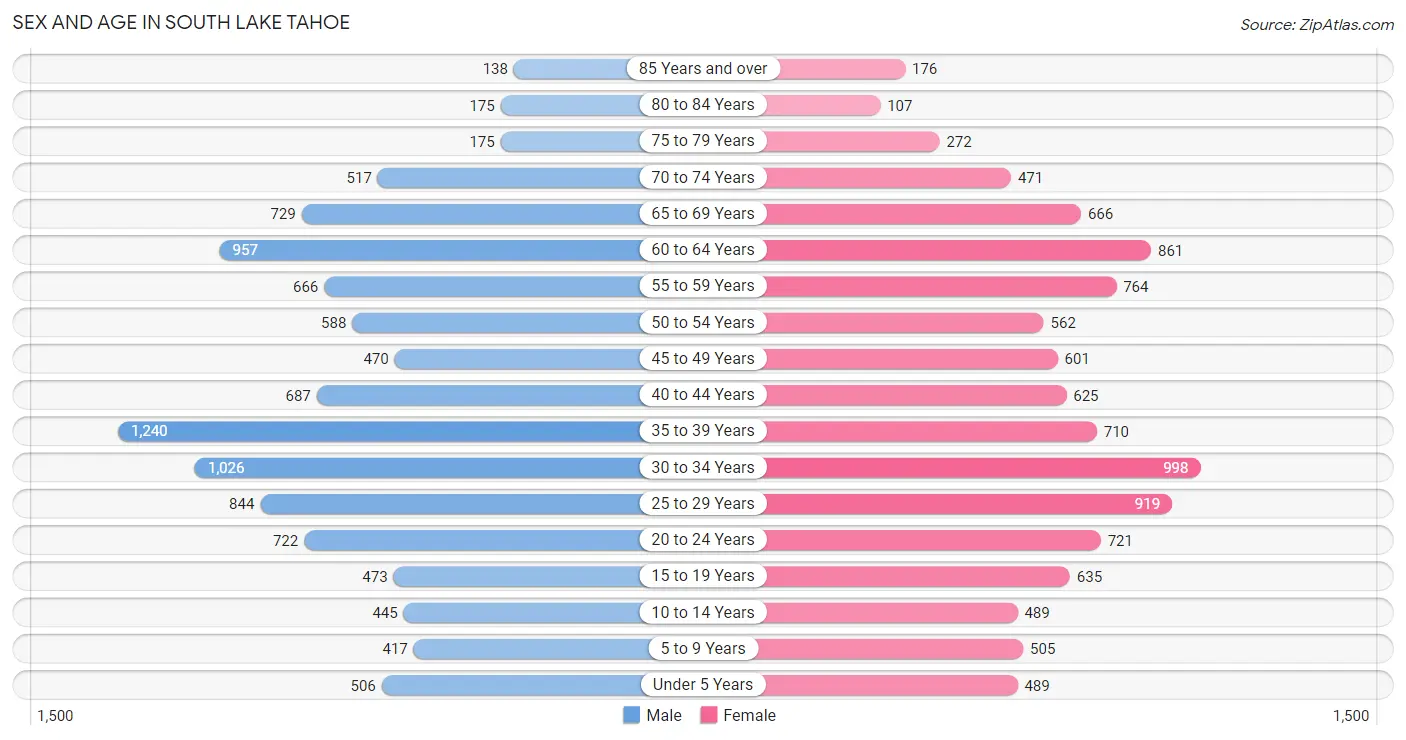
The most populous age groups in South Lake Tahoe are 35 to 39 Years (1,240 | 11.5%) for men and 30 to 34 Years (998 | 9.4%) for women.
| Age Bracket | Male | Female |
| Under 5 Years | 506 (4.7%) | 489 (4.6%) |
| 5 to 9 Years | 417 (3.9%) | 505 (4.8%) |
| 10 to 14 Years | 445 (4.1%) | 489 (4.6%) |
| 15 to 19 Years | 473 (4.4%) | 635 (6.0%) |
| 20 to 24 Years | 722 (6.7%) | 721 (6.8%) |
| 25 to 29 Years | 844 (7.8%) | 919 (8.7%) |
| 30 to 34 Years | 1,026 (9.5%) | 998 (9.4%) |
| 35 to 39 Years | 1,240 (11.5%) | 710 (6.7%) |
| 40 to 44 Years | 687 (6.4%) | 625 (5.9%) |
| 45 to 49 Years | 470 (4.4%) | 601 (5.7%) |
| 50 to 54 Years | 588 (5.5%) | 562 (5.3%) |
| 55 to 59 Years | 666 (6.2%) | 764 (7.2%) |
| 60 to 64 Years | 957 (8.9%) | 861 (8.1%) |
| 65 to 69 Years | 729 (6.8%) | 666 (6.3%) |
| 70 to 74 Years | 517 (4.8%) | 471 (4.5%) |
| 75 to 79 Years | 175 (1.6%) | 272 (2.6%) |
| 80 to 84 Years | 175 (1.6%) | 107 (1.0%) |
| 85 Years and over | 138 (1.3%) | 176 (1.7%) |
| Total | 10,775 (100.0%) | 10,571 (100.0%) |
Families and Households in South Lake Tahoe
Median Family Size in South Lake Tahoe
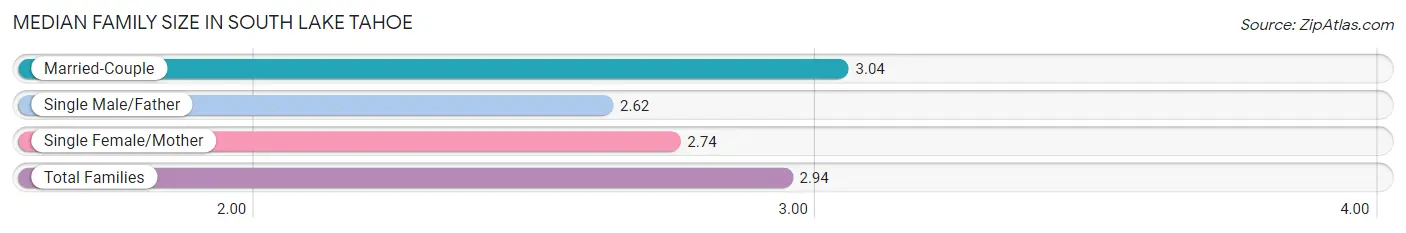
The median family size in South Lake Tahoe is 2.94 persons per family, with married-couple families (3,459 | 70.1%) accounting for the largest median family size of 3.04 persons per family. On the other hand, single male/father families (361 | 7.3%) represent the smallest median family size with 2.62 persons per family.
| Family Type | # Families | Family Size |
| Married-Couple | 3,459 (70.1%) | 3.04 |
| Single Male/Father | 361 (7.3%) | 2.62 |
| Single Female/Mother | 1,112 (22.6%) | 2.74 |
| Total Families | 4,932 (100.0%) | 2.94 |
Median Household Size in South Lake Tahoe
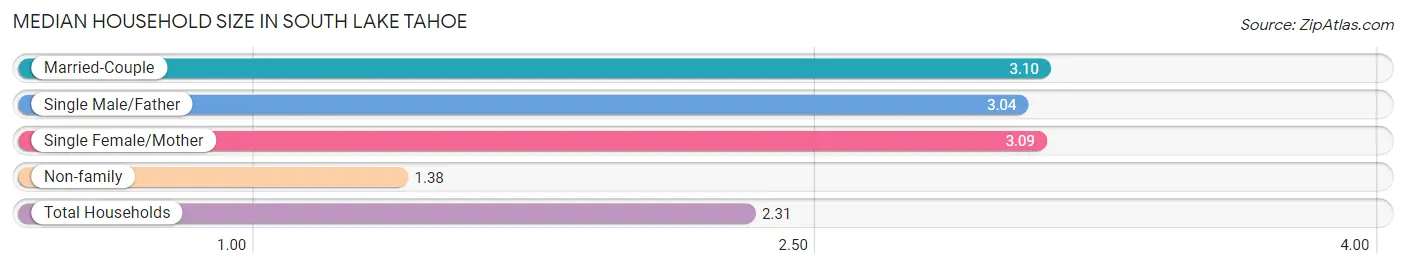
The median household size in South Lake Tahoe is 2.31 persons per household, with married-couple households (3,459 | 37.9%) accounting for the largest median household size of 3.1 persons per household. non-family households (4,193 | 46.0%) represent the smallest median household size with 1.38 persons per household.
| Household Type | # Households | Household Size |
| Married-Couple | 3,459 (37.9%) | 3.10 |
| Single Male/Father | 361 (4.0%) | 3.04 |
| Single Female/Mother | 1,112 (12.2%) | 3.09 |
| Non-family | 4,193 (46.0%) | 1.38 |
| Total Households | 9,125 (100.0%) | 2.31 |
Household Size by Marriage Status in South Lake Tahoe
Out of a total of 9,125 households in South Lake Tahoe, 4,932 (54.0%) are family households, while 4,193 (46.0%) are nonfamily households. The most numerous type of family households are 2-person households, comprising 2,175, and the most common type of nonfamily households are 1-person households, comprising 3,014.
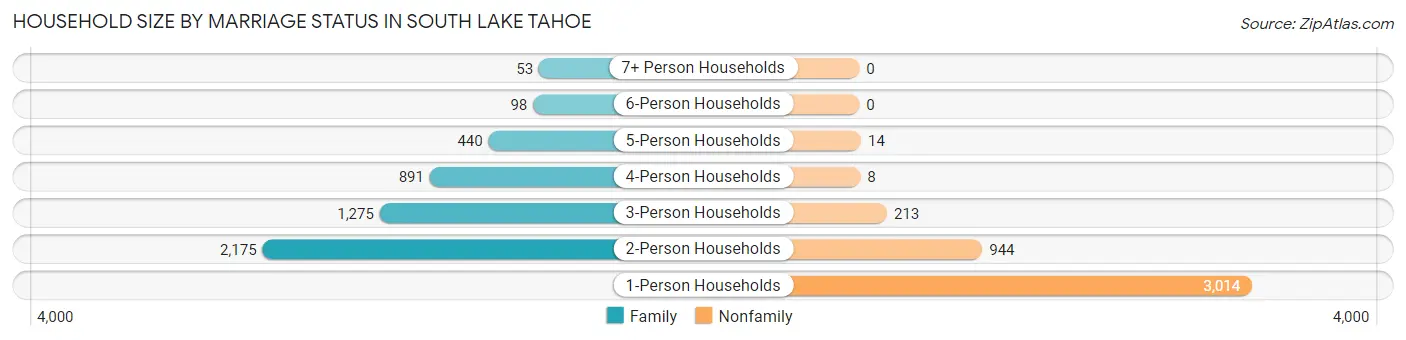
| Household Size | Family Households | Nonfamily Households |
| 1-Person Households | - | 3,014 (33.0%) |
| 2-Person Households | 2,175 (23.8%) | 944 (10.3%) |
| 3-Person Households | 1,275 (14.0%) | 213 (2.3%) |
| 4-Person Households | 891 (9.8%) | 8 (0.1%) |
| 5-Person Households | 440 (4.8%) | 14 (0.2%) |
| 6-Person Households | 98 (1.1%) | 0 (0.0%) |
| 7+ Person Households | 53 (0.6%) | 0 (0.0%) |
| Total | 4,932 (54.0%) | 4,193 (46.0%) |
Female Fertility in South Lake Tahoe
Fertility by Age in South Lake Tahoe
Average fertility rate in South Lake Tahoe is 29.0 births per 1,000 women. Women in the age bracket of 15 to 19 years have the highest fertility rate with 55.0 births per 1,000 women. Women in the age bracket of 35 to 50 years acount for 41.3% of all women with births.
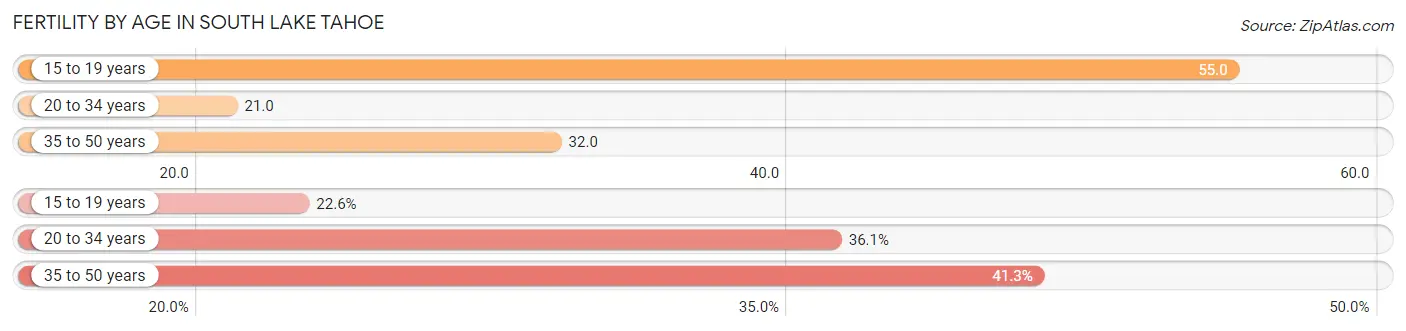
| Age Bracket | Women with Births | Births / 1,000 Women |
| 15 to 19 years | 35 (22.6%) | 55.0 |
| 20 to 34 years | 56 (36.1%) | 21.0 |
| 35 to 50 years | 64 (41.3%) | 32.0 |
| Total | 155 (100.0%) | 29.0 |
Fertility by Age by Marriage Status in South Lake Tahoe
77.4% of women with births (155) in South Lake Tahoe are married. The highest percentage of unmarried women with births falls into 15 to 19 years age bracket with 100.0% of them unmarried at the time of birth, while the lowest percentage of unmarried women with births belong to 20 to 34 years age bracket with 0.0% of them unmarried.
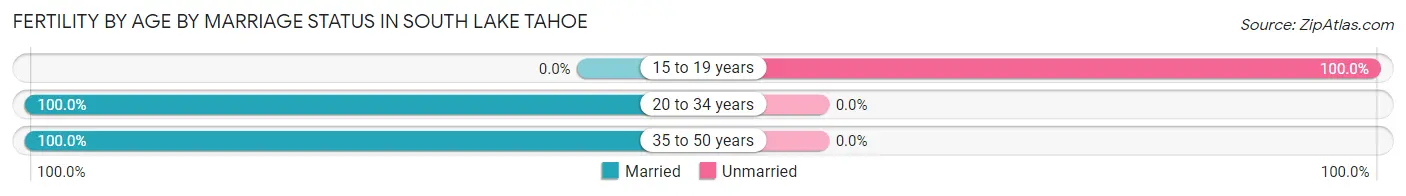
| Age Bracket | Married | Unmarried |
| 15 to 19 years | 0 (0.0%) | 35 (100.0%) |
| 20 to 34 years | 56 (100.0%) | 0 (0.0%) |
| 35 to 50 years | 64 (100.0%) | 0 (0.0%) |
| Total | 120 (77.4%) | 35 (22.6%) |
Fertility by Education in South Lake Tahoe
Average fertility rate in South Lake Tahoe is 29.0 births per 1,000 women. Women with the education attainment of less than high school have the highest fertility rate of 46.0 births per 1,000 women, while women with the education attainment of college or associate's degree have the lowest fertility at 23.0 births per 1,000 women. Women with the education attainment of college or associate's degree represent 23.2% of all women with births.
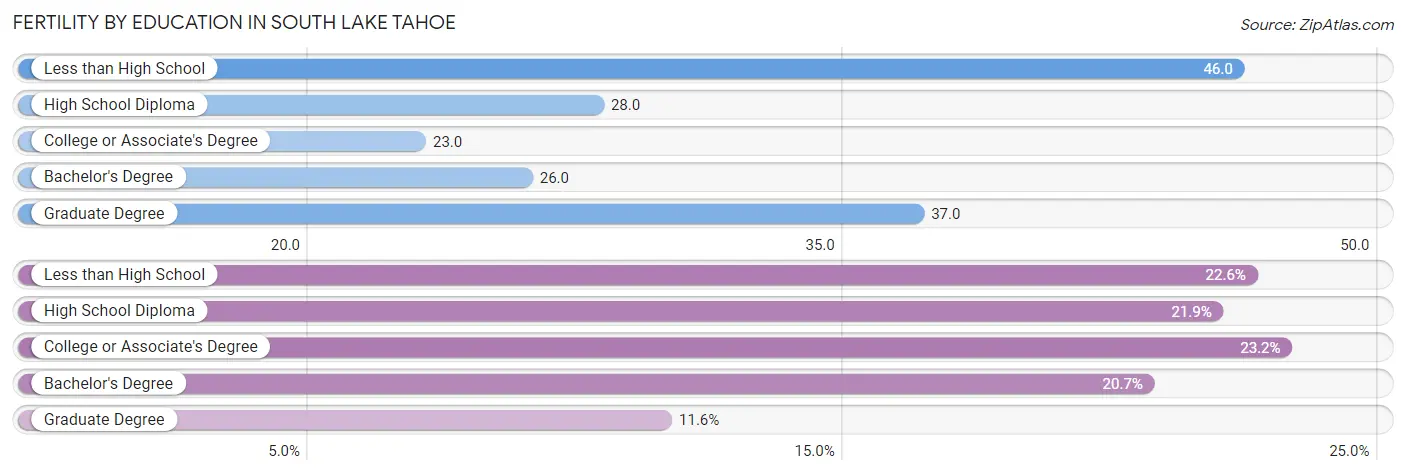
| Educational Attainment | Women with Births | Births / 1,000 Women |
| Less than High School | 35 (22.6%) | 46.0 |
| High School Diploma | 34 (21.9%) | 28.0 |
| College or Associate's Degree | 36 (23.2%) | 23.0 |
| Bachelor's Degree | 32 (20.6%) | 26.0 |
| Graduate Degree | 18 (11.6%) | 37.0 |
| Total | 155 (100.0%) | 29.0 |
Fertility by Education by Marriage Status in South Lake Tahoe
22.6% of women with births in South Lake Tahoe are unmarried. Women with the educational attainment of high school diploma are most likely to be married with 100.0% of them married at childbirth, while women with the educational attainment of less than high school are least likely to be married with 100.0% of them unmarried at childbirth.
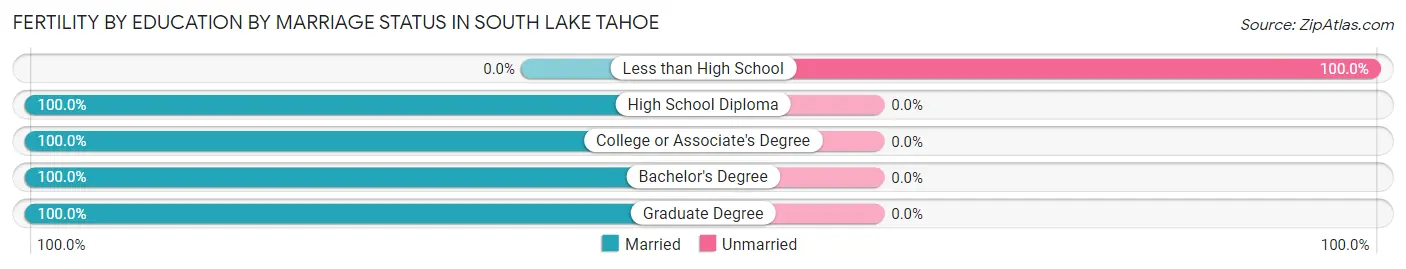
| Educational Attainment | Married | Unmarried |
| Less than High School | 0 (0.0%) | 35 (100.0%) |
| High School Diploma | 34 (100.0%) | 0 (0.0%) |
| College or Associate's Degree | 36 (100.0%) | 0 (0.0%) |
| Bachelor's Degree | 32 (100.0%) | 0 (0.0%) |
| Graduate Degree | 18 (100.0%) | 0 (0.0%) |
| Total | 120 (77.4%) | 35 (22.6%) |
Employment Characteristics in South Lake Tahoe
Employment by Class of Employer in South Lake Tahoe
Among the 11,566 employed individuals in South Lake Tahoe, private company employees (8,186 | 70.8%), self-employed (not incorporated) (1,111 | 9.6%), and not-for-profit organizations (842 | 7.3%) make up the most common classes of employment.
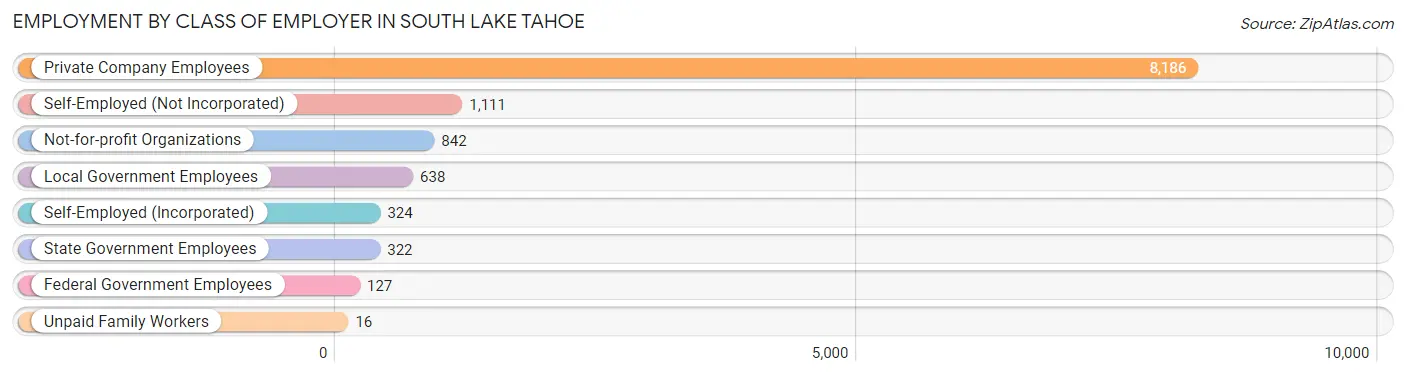
| Employer Class | # Employees | % Employees |
| Private Company Employees | 8,186 | 70.8% |
| Self-Employed (Incorporated) | 324 | 2.8% |
| Self-Employed (Not Incorporated) | 1,111 | 9.6% |
| Not-for-profit Organizations | 842 | 7.3% |
| Local Government Employees | 638 | 5.5% |
| State Government Employees | 322 | 2.8% |
| Federal Government Employees | 127 | 1.1% |
| Unpaid Family Workers | 16 | 0.1% |
| Total | 11,566 | 100.0% |
Employment Status by Age in South Lake Tahoe
According to the labor force statistics for South Lake Tahoe, out of the total population over 16 years of age (18,282), 69.3% or 12,669 individuals are in the labor force, with 4.6% or 583 of them unemployed. The age group with the highest labor force participation rate is 35 to 44 years, with 88.8% or 2,897 individuals in the labor force. Within the labor force, the 65 to 74 years age range has the highest percentage of unemployed individuals, with 8.8% or 72 of them being unemployed.
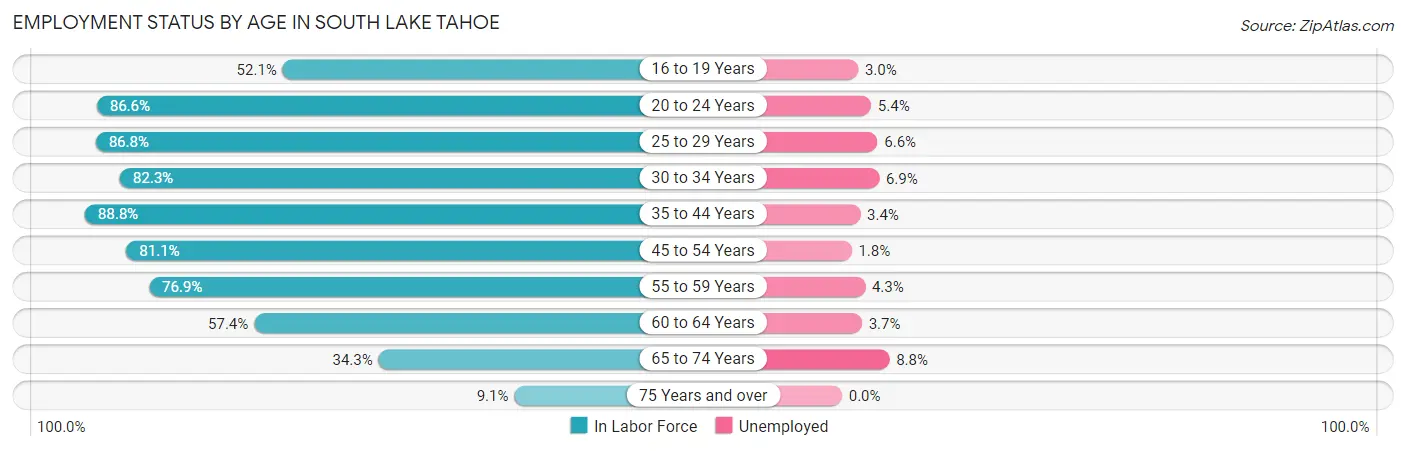
| Age Bracket | In Labor Force | Unemployed |
| 16 to 19 Years | 466 (52.1%) | 14 (3.0%) |
| 20 to 24 Years | 1,250 (86.6%) | 68 (5.4%) |
| 25 to 29 Years | 1,530 (86.8%) | 101 (6.6%) |
| 30 to 34 Years | 1,666 (82.3%) | 115 (6.9%) |
| 35 to 44 Years | 2,897 (88.8%) | 98 (3.4%) |
| 45 to 54 Years | 1,801 (81.1%) | 32 (1.8%) |
| 55 to 59 Years | 1,100 (76.9%) | 47 (4.3%) |
| 60 to 64 Years | 1,044 (57.4%) | 39 (3.7%) |
| 65 to 74 Years | 817 (34.3%) | 72 (8.8%) |
| 75 Years and over | 95 (9.1%) | 0 (0.0%) |
| Total | 12,669 (69.3%) | 583 (4.6%) |
Employment Status by Educational Attainment in South Lake Tahoe
According to labor force statistics for South Lake Tahoe, 80.2% of individuals (10,039) out of the total population between 25 and 64 years of age (12,518) are in the labor force, with 4.3% or 432 of them being unemployed. The group with the highest labor force participation rate are those with the educational attainment of bachelor's degree or higher, with 83.3% or 3,289 individuals in the labor force. Within the labor force, individuals with less than high school education have the highest percentage of unemployment, with 10.6% or 98 of them being unemployed.
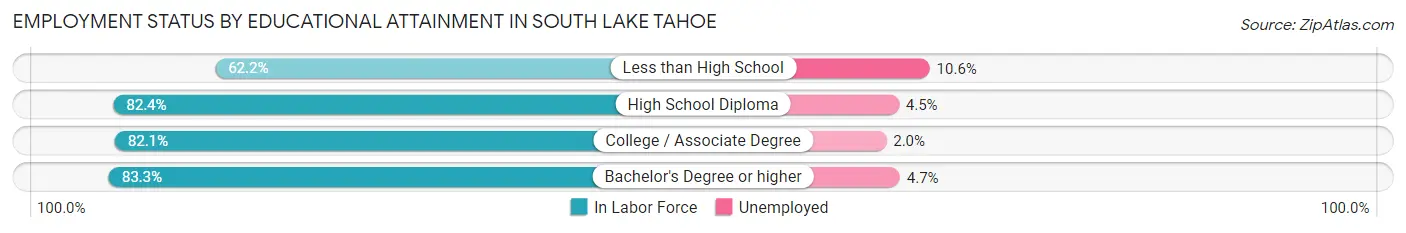
| Educational Attainment | In Labor Force | Unemployed |
| Less than High School | 924 (62.2%) | 157 (10.6%) |
| High School Diploma | 2,447 (82.4%) | 134 (4.5%) |
| College / Associate Degree | 3,378 (82.1%) | 82 (2.0%) |
| Bachelor's Degree or higher | 3,289 (83.3%) | 186 (4.7%) |
| Total | 10,039 (80.2%) | 538 (4.3%) |
Employment Occupations by Sex in South Lake Tahoe
Management, Business, Science and Arts Occupations
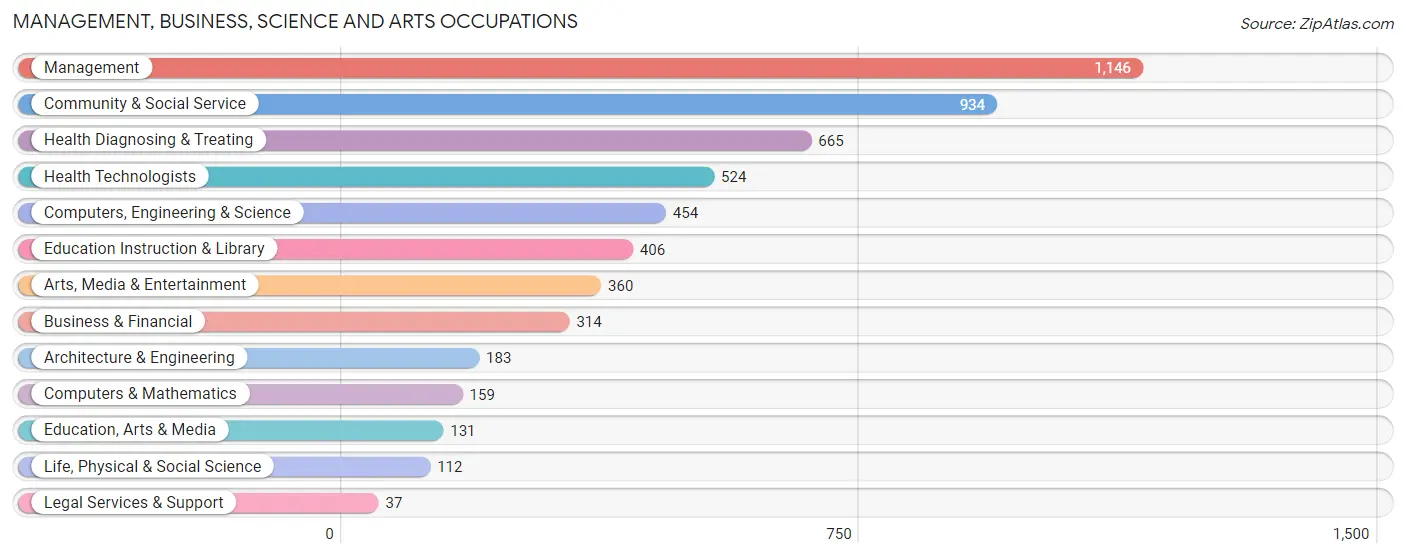
The most common Management, Business, Science and Arts occupations in South Lake Tahoe are Management (1,146 | 9.5%), Community & Social Service (934 | 7.7%), Health Diagnosing & Treating (665 | 5.5%), Health Technologists (524 | 4.3%), and Computers, Engineering & Science (454 | 3.8%).
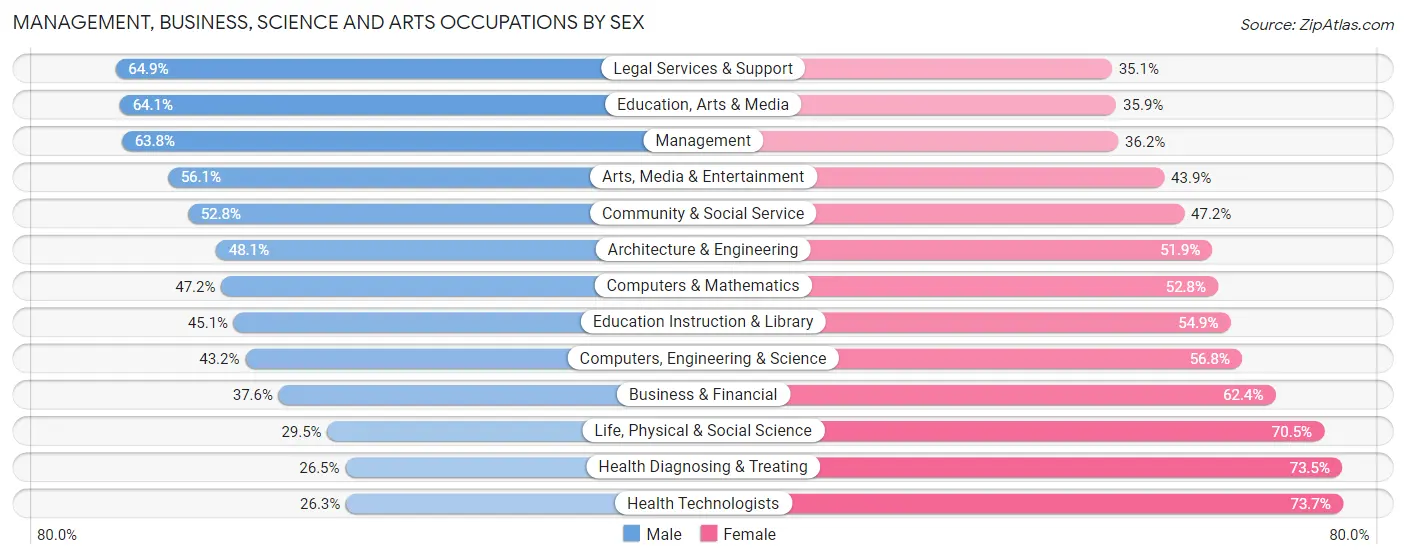
Management, Business, Science and Arts Occupations by Sex
Within the Management, Business, Science and Arts occupations in South Lake Tahoe, the most male-oriented occupations are Legal Services & Support (64.9%), Education, Arts & Media (64.1%), and Management (63.8%), while the most female-oriented occupations are Health Technologists (73.7%), Health Diagnosing & Treating (73.5%), and Life, Physical & Social Science (70.5%).
| Occupation | Male | Female |
| Management | 731 (63.8%) | 415 (36.2%) |
| Business & Financial | 118 (37.6%) | 196 (62.4%) |
| Computers, Engineering & Science | 196 (43.2%) | 258 (56.8%) |
| Computers & Mathematics | 75 (47.2%) | 84 (52.8%) |
| Architecture & Engineering | 88 (48.1%) | 95 (51.9%) |
| Life, Physical & Social Science | 33 (29.5%) | 79 (70.5%) |
| Community & Social Service | 493 (52.8%) | 441 (47.2%) |
| Education, Arts & Media | 84 (64.1%) | 47 (35.9%) |
| Legal Services & Support | 24 (64.9%) | 13 (35.1%) |
| Education Instruction & Library | 183 (45.1%) | 223 (54.9%) |
| Arts, Media & Entertainment | 202 (56.1%) | 158 (43.9%) |
| Health Diagnosing & Treating | 176 (26.5%) | 489 (73.5%) |
| Health Technologists | 138 (26.3%) | 386 (73.7%) |
| Total (Category) | 1,714 (48.8%) | 1,799 (51.2%) |
| Total (Overall) | 6,612 (54.9%) | 5,441 (45.1%) |
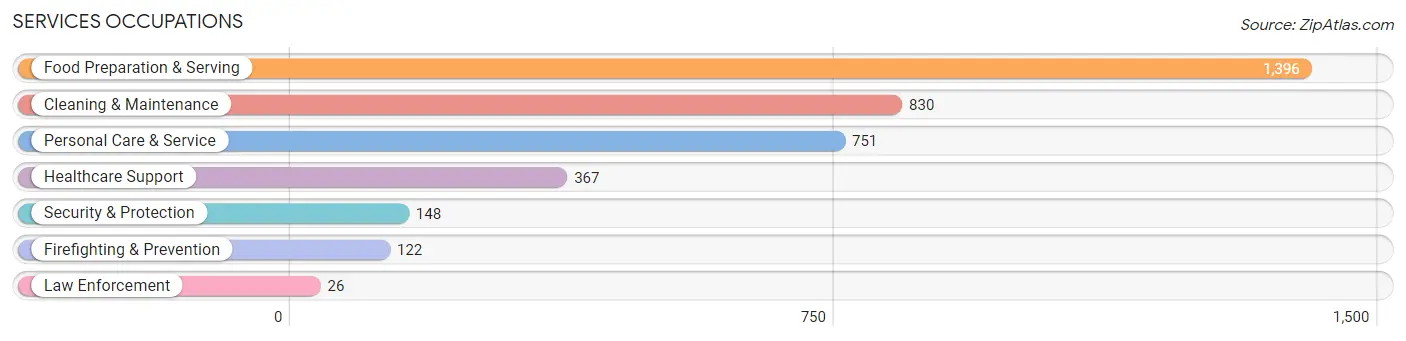
Services Occupations
The most common Services occupations in South Lake Tahoe are Food Preparation & Serving (1,396 | 11.6%), Cleaning & Maintenance (830 | 6.9%), Personal Care & Service (751 | 6.2%), Healthcare Support (367 | 3.0%), and Security & Protection (148 | 1.2%).
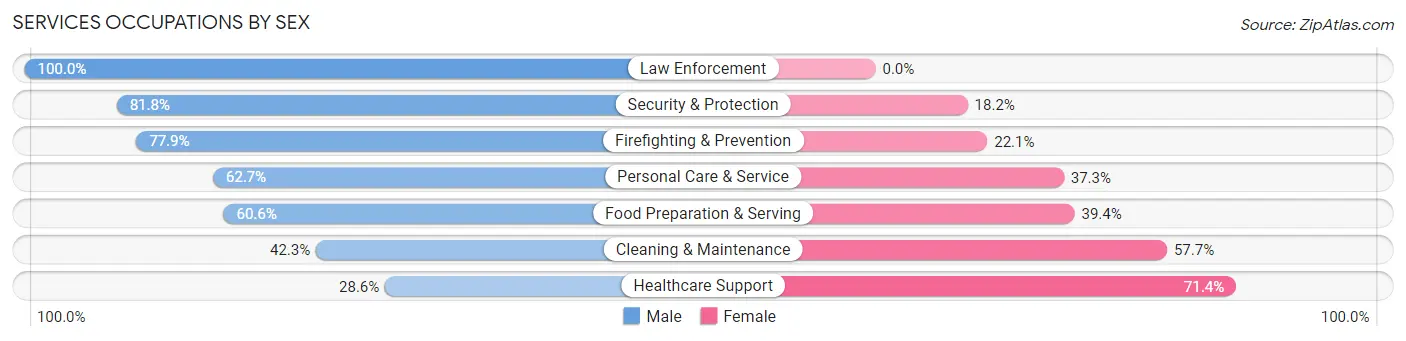
Services Occupations by Sex
Within the Services occupations in South Lake Tahoe, the most male-oriented occupations are Law Enforcement (100.0%), Security & Protection (81.8%), and Firefighting & Prevention (77.9%), while the most female-oriented occupations are Healthcare Support (71.4%), Cleaning & Maintenance (57.7%), and Food Preparation & Serving (39.4%).
| Occupation | Male | Female |
| Healthcare Support | 105 (28.6%) | 262 (71.4%) |
| Security & Protection | 121 (81.8%) | 27 (18.2%) |
| Firefighting & Prevention | 95 (77.9%) | 27 (22.1%) |
| Law Enforcement | 26 (100.0%) | 0 (0.0%) |
| Food Preparation & Serving | 846 (60.6%) | 550 (39.4%) |
| Cleaning & Maintenance | 351 (42.3%) | 479 (57.7%) |
| Personal Care & Service | 471 (62.7%) | 280 (37.3%) |
| Total (Category) | 1,894 (54.2%) | 1,598 (45.8%) |
| Total (Overall) | 6,612 (54.9%) | 5,441 (45.1%) |
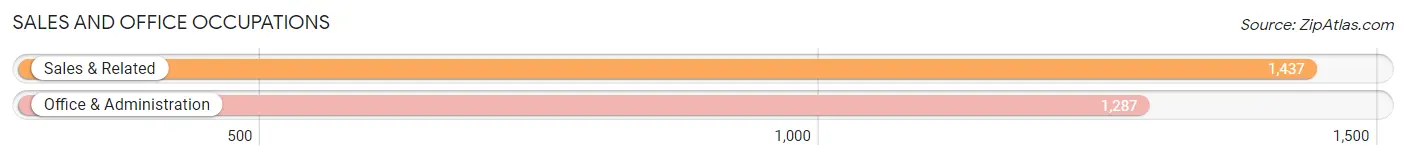
Sales and Office Occupations
The most common Sales and Office occupations in South Lake Tahoe are Sales & Related (1,437 | 11.9%), and Office & Administration (1,287 | 10.7%).
Sales and Office Occupations by Sex
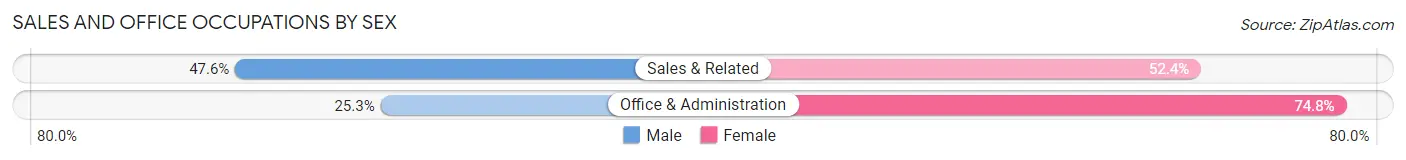
| Occupation | Male | Female |
| Sales & Related | 684 (47.6%) | 753 (52.4%) |
| Office & Administration | 325 (25.3%) | 962 (74.8%) |
| Total (Category) | 1,009 (37.0%) | 1,715 (63.0%) |
| Total (Overall) | 6,612 (54.9%) | 5,441 (45.1%) |
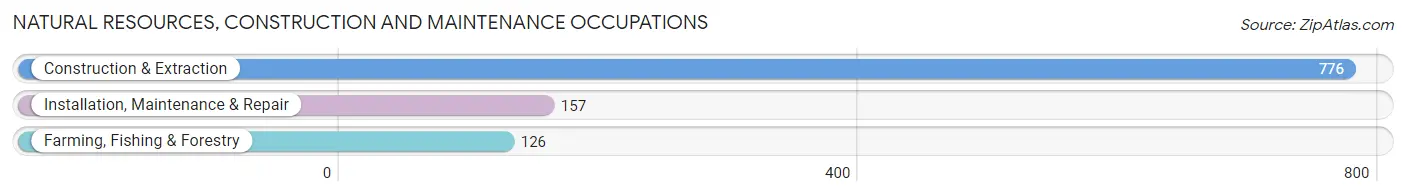
Natural Resources, Construction and Maintenance Occupations
The most common Natural Resources, Construction and Maintenance occupations in South Lake Tahoe are Construction & Extraction (776 | 6.4%), Installation, Maintenance & Repair (157 | 1.3%), and Farming, Fishing & Forestry (126 | 1.1%).
Natural Resources, Construction and Maintenance Occupations by Sex
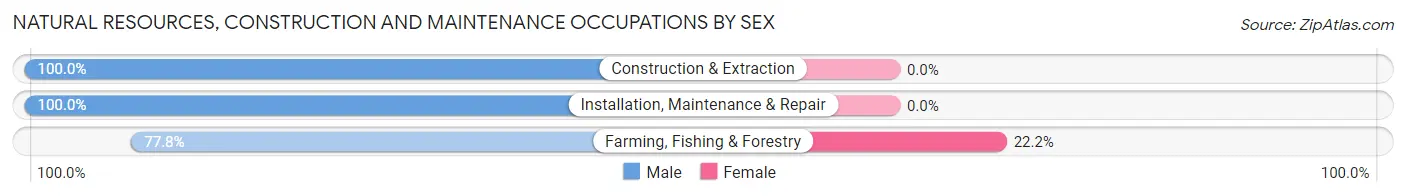
| Occupation | Male | Female |
| Farming, Fishing & Forestry | 98 (77.8%) | 28 (22.2%) |
| Construction & Extraction | 776 (100.0%) | 0 (0.0%) |
| Installation, Maintenance & Repair | 157 (100.0%) | 0 (0.0%) |
| Total (Category) | 1,031 (97.4%) | 28 (2.6%) |
| Total (Overall) | 6,612 (54.9%) | 5,441 (45.1%) |
Production, Transportation and Moving Occupations
The most common Production, Transportation and Moving occupations in South Lake Tahoe are Transportation (513 | 4.3%), Material Moving (387 | 3.2%), and Production (365 | 3.0%).
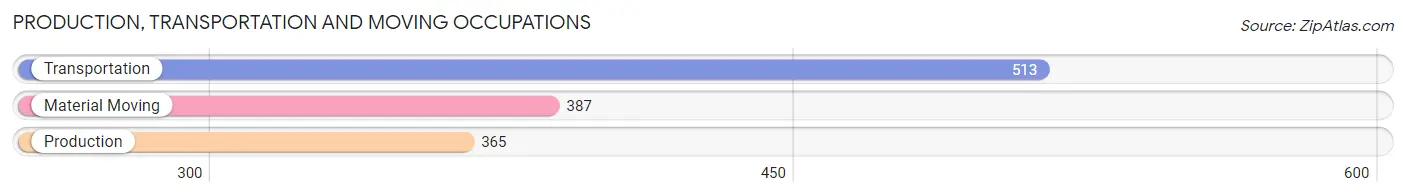
Production, Transportation and Moving Occupations by Sex
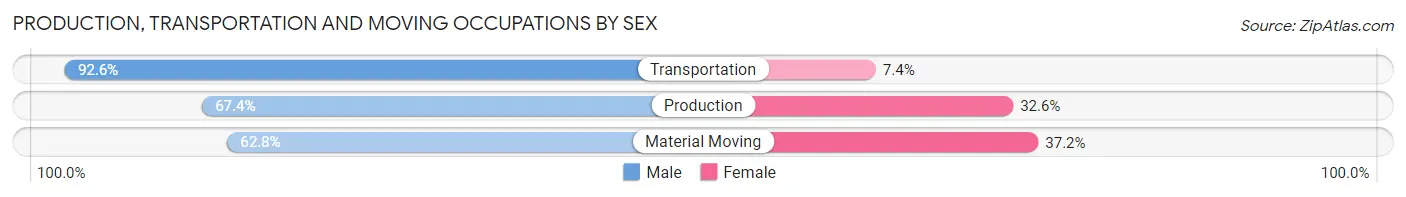
| Occupation | Male | Female |
| Production | 246 (67.4%) | 119 (32.6%) |
| Transportation | 475 (92.6%) | 38 (7.4%) |
| Material Moving | 243 (62.8%) | 144 (37.2%) |
| Total (Category) | 964 (76.2%) | 301 (23.8%) |
| Total (Overall) | 6,612 (54.9%) | 5,441 (45.1%) |
Employment Industries by Sex in South Lake Tahoe
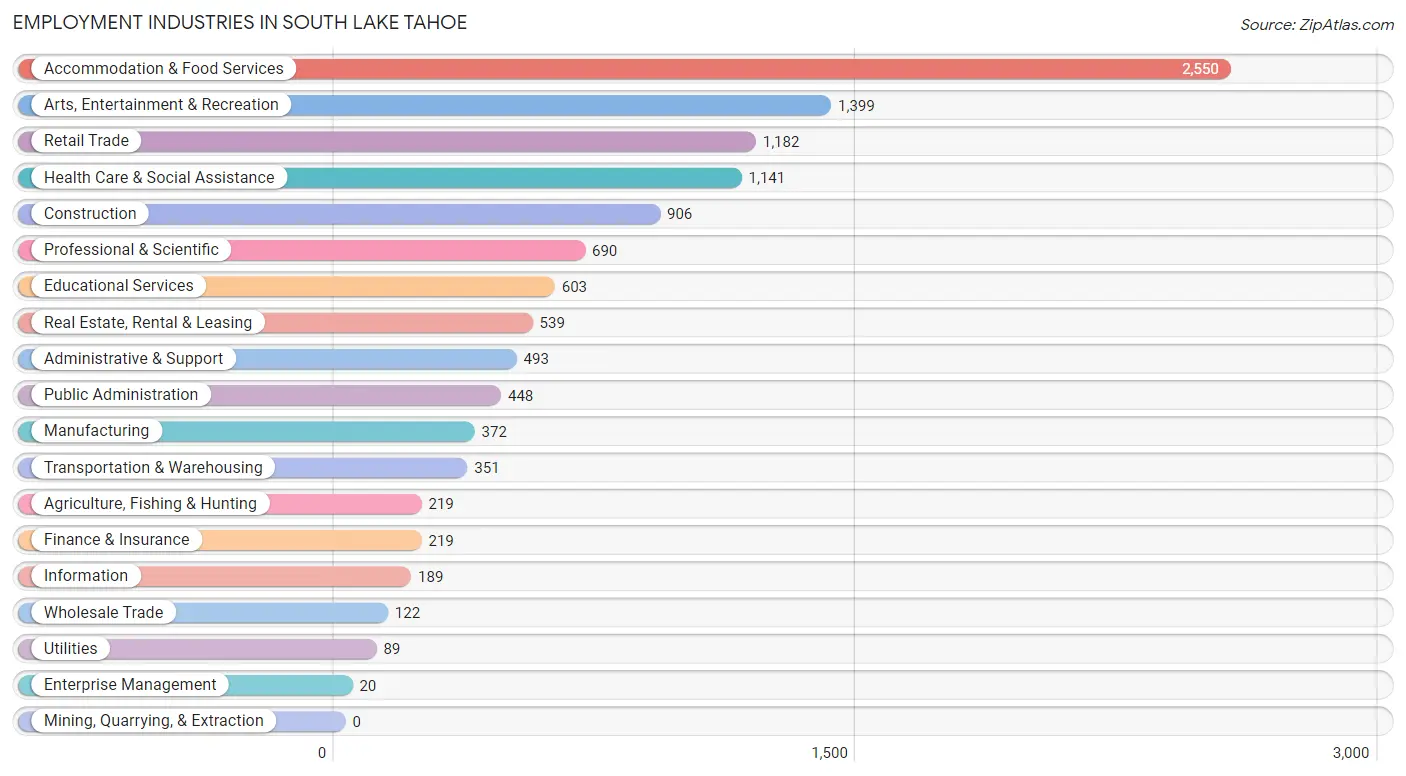
Employment Industries in South Lake Tahoe
The major employment industries in South Lake Tahoe include Accommodation & Food Services (2,550 | 21.2%), Arts, Entertainment & Recreation (1,399 | 11.6%), Retail Trade (1,182 | 9.8%), Health Care & Social Assistance (1,141 | 9.5%), and Construction (906 | 7.5%).
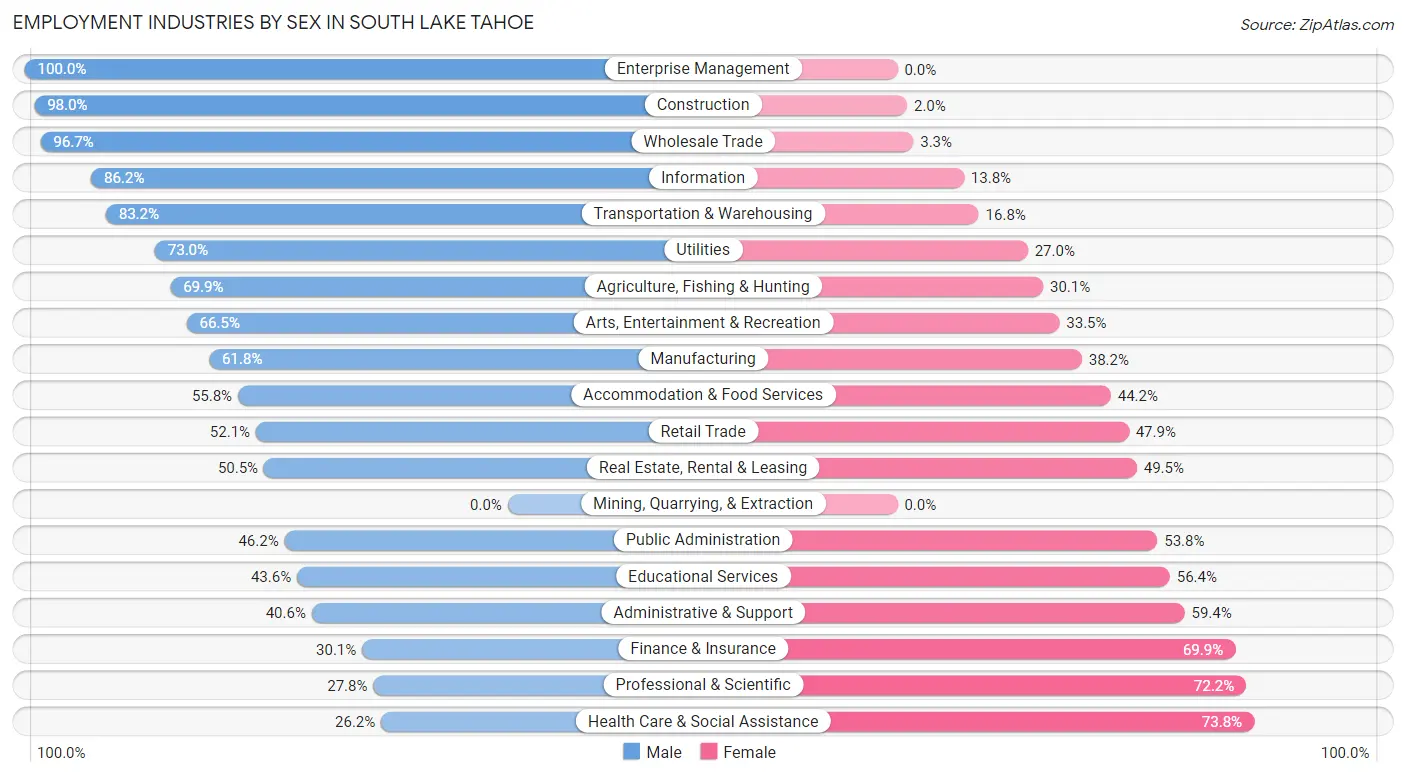
Employment Industries by Sex in South Lake Tahoe
The South Lake Tahoe industries that see more men than women are Enterprise Management (100.0%), Construction (98.0%), and Wholesale Trade (96.7%), whereas the industries that tend to have a higher number of women are Health Care & Social Assistance (73.8%), Professional & Scientific (72.2%), and Finance & Insurance (69.9%).
| Industry | Male | Female |
| Agriculture, Fishing & Hunting | 153 (69.9%) | 66 (30.1%) |
| Mining, Quarrying, & Extraction | 0 (0.0%) | 0 (0.0%) |
| Construction | 888 (98.0%) | 18 (2.0%) |
| Manufacturing | 230 (61.8%) | 142 (38.2%) |
| Wholesale Trade | 118 (96.7%) | 4 (3.3%) |
| Retail Trade | 616 (52.1%) | 566 (47.9%) |
| Transportation & Warehousing | 292 (83.2%) | 59 (16.8%) |
| Utilities | 65 (73.0%) | 24 (27.0%) |
| Information | 163 (86.2%) | 26 (13.8%) |
| Finance & Insurance | 66 (30.1%) | 153 (69.9%) |
| Real Estate, Rental & Leasing | 272 (50.5%) | 267 (49.5%) |
| Professional & Scientific | 192 (27.8%) | 498 (72.2%) |
| Enterprise Management | 20 (100.0%) | 0 (0.0%) |
| Administrative & Support | 200 (40.6%) | 293 (59.4%) |
| Educational Services | 263 (43.6%) | 340 (56.4%) |
| Health Care & Social Assistance | 299 (26.2%) | 842 (73.8%) |
| Arts, Entertainment & Recreation | 930 (66.5%) | 469 (33.5%) |
| Accommodation & Food Services | 1,424 (55.8%) | 1,126 (44.2%) |
| Public Administration | 207 (46.2%) | 241 (53.8%) |
| Total | 6,612 (54.9%) | 5,441 (45.1%) |
Education in South Lake Tahoe
School Enrollment in South Lake Tahoe
The most common levels of schooling among the 3,991 students in South Lake Tahoe are college / undergraduate (1,084 | 27.2%), elementary school (784 | 19.6%), and middle school (772 | 19.3%).
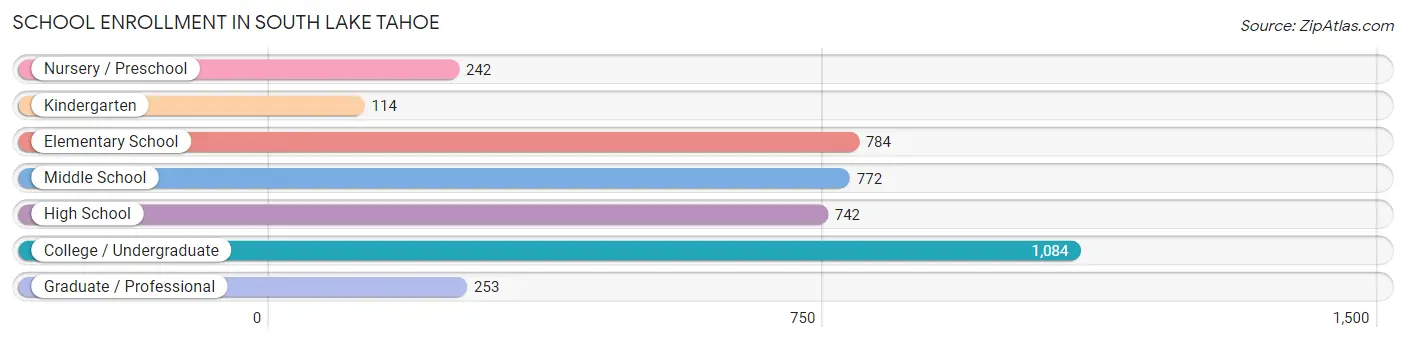
| School Level | # Students | % Students |
| Nursery / Preschool | 242 | 6.1% |
| Kindergarten | 114 | 2.9% |
| Elementary School | 784 | 19.6% |
| Middle School | 772 | 19.3% |
| High School | 742 | 18.6% |
| College / Undergraduate | 1,084 | 27.2% |
| Graduate / Professional | 253 | 6.3% |
| Total | 3,991 | 100.0% |
School Enrollment by Age by Funding Source in South Lake Tahoe
Out of a total of 3,991 students who are enrolled in schools in South Lake Tahoe, 411 (10.3%) attend a private institution, while the remaining 3,580 (89.7%) are enrolled in public schools. The age group of 25 to 34 year olds has the highest likelihood of being enrolled in private schools, with 207 (44.4% in the age bracket) enrolled. Conversely, the age group of 20 to 24 year olds has the lowest likelihood of being enrolled in a private school, with 421 (100.0% in the age bracket) attending a public institution.
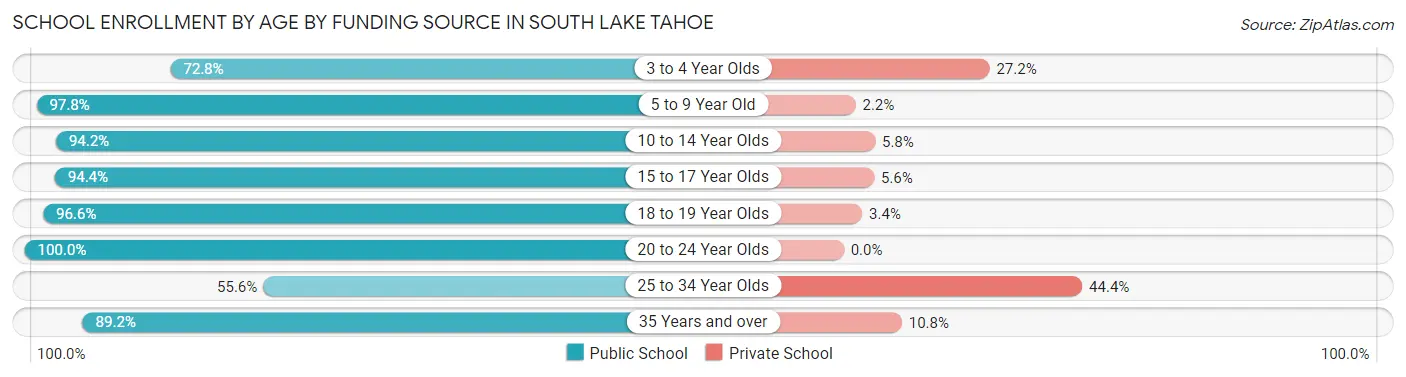
| Age Bracket | Public School | Private School |
| 3 to 4 Year Olds | 169 (72.8%) | 63 (27.2%) |
| 5 to 9 Year Old | 840 (97.8%) | 19 (2.2%) |
| 10 to 14 Year Olds | 823 (94.2%) | 51 (5.8%) |
| 15 to 17 Year Olds | 485 (94.4%) | 29 (5.6%) |
| 18 to 19 Year Olds | 309 (96.6%) | 11 (3.4%) |
| 20 to 24 Year Olds | 421 (100.0%) | 0 (0.0%) |
| 25 to 34 Year Olds | 259 (55.6%) | 207 (44.4%) |
| 35 Years and over | 272 (89.2%) | 33 (10.8%) |
| Total | 3,580 (89.7%) | 411 (10.3%) |
Educational Attainment by Field of Study in South Lake Tahoe
Business (965 | 18.3%), social sciences (705 | 13.4%), bio, nature & agricultural (640 | 12.1%), science & technology (455 | 8.6%), and engineering (436 | 8.3%) are the most common fields of study among 5,272 individuals in South Lake Tahoe who have obtained a bachelor's degree or higher.
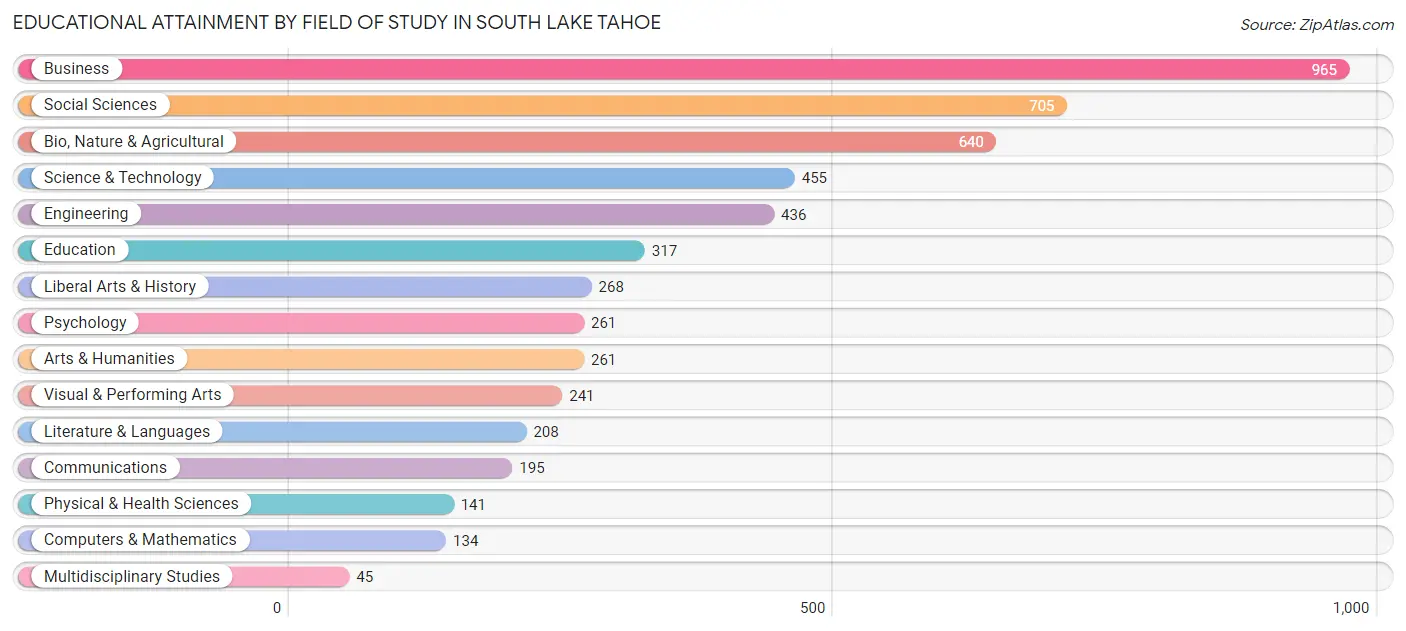
| Field of Study | # Graduates | % Graduates |
| Computers & Mathematics | 134 | 2.5% |
| Bio, Nature & Agricultural | 640 | 12.1% |
| Physical & Health Sciences | 141 | 2.7% |
| Psychology | 261 | 5.0% |
| Social Sciences | 705 | 13.4% |
| Engineering | 436 | 8.3% |
| Multidisciplinary Studies | 45 | 0.9% |
| Science & Technology | 455 | 8.6% |
| Business | 965 | 18.3% |
| Education | 317 | 6.0% |
| Literature & Languages | 208 | 4.0% |
| Liberal Arts & History | 268 | 5.1% |
| Visual & Performing Arts | 241 | 4.6% |
| Communications | 195 | 3.7% |
| Arts & Humanities | 261 | 5.0% |
| Total | 5,272 | 100.0% |
Transportation & Commute in South Lake Tahoe
Vehicle Availability by Sex in South Lake Tahoe
The most prevalent vehicle ownership categories in South Lake Tahoe are males with 2 vehicles (2,428, accounting for 38.3%) and females with 2 vehicles (1,884, making up 46.6%).
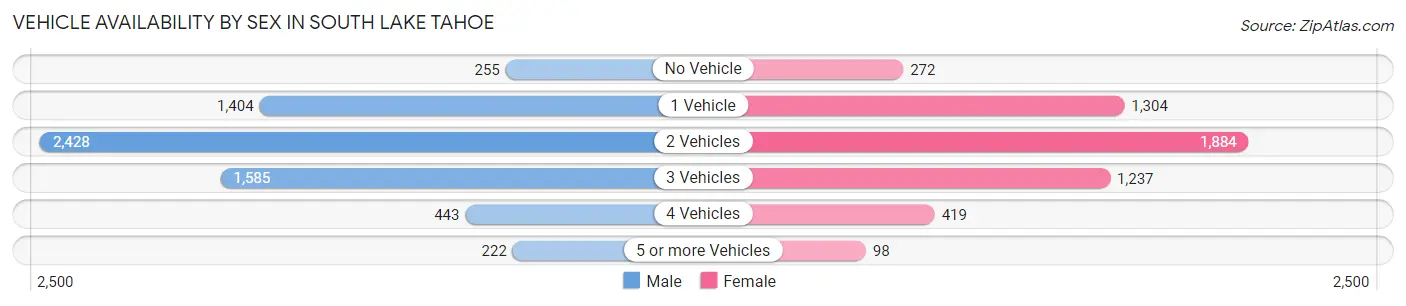
| Vehicles Available | Male | Female |
| No Vehicle | 255 (4.0%) | 272 (5.2%) |
| 1 Vehicle | 1,404 (22.2%) | 1,304 (25.0%) |
| 2 Vehicles | 2,428 (38.3%) | 1,884 (36.1%) |
| 3 Vehicles | 1,585 (25.0%) | 1,237 (23.7%) |
| 4 Vehicles | 443 (7.0%) | 419 (8.0%) |
| 5 or more Vehicles | 222 (3.5%) | 98 (1.9%) |
| Total | 6,337 (100.0%) | 5,214 (100.0%) |
Commute Time in South Lake Tahoe
The most frequently occuring commute durations in South Lake Tahoe are 10 to 14 minutes (2,857 commuters, 28.0%), 5 to 9 minutes (2,517 commuters, 24.7%), and 15 to 19 minutes (1,815 commuters, 17.8%).
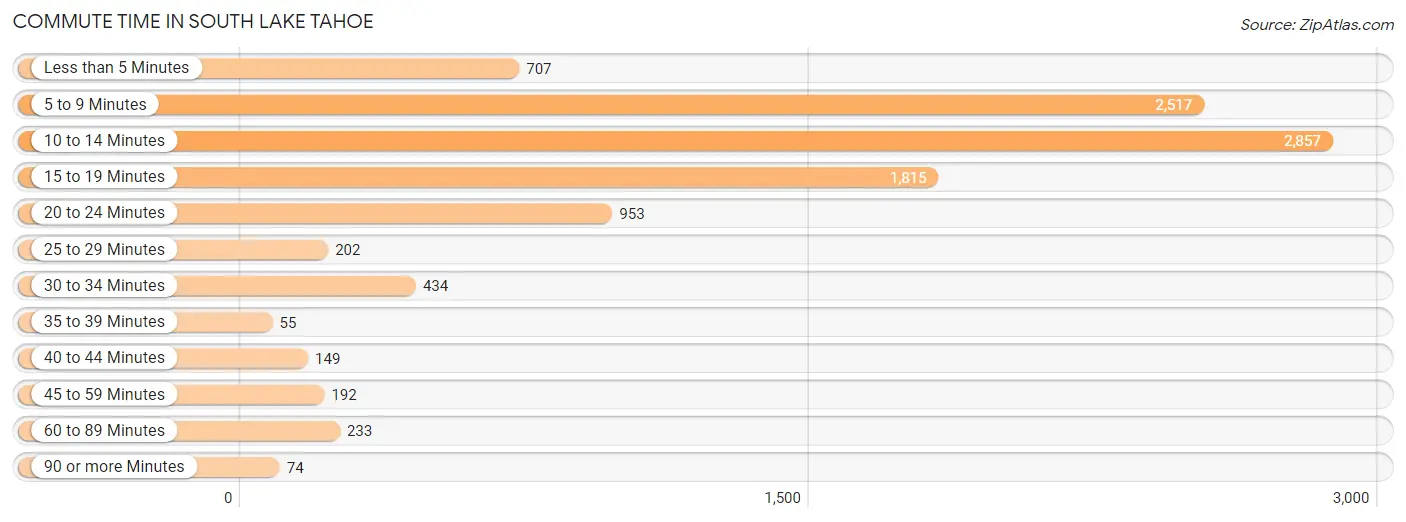
| Commute Time | # Commuters | % Commuters |
| Less than 5 Minutes | 707 | 6.9% |
| 5 to 9 Minutes | 2,517 | 24.7% |
| 10 to 14 Minutes | 2,857 | 28.0% |
| 15 to 19 Minutes | 1,815 | 17.8% |
| 20 to 24 Minutes | 953 | 9.3% |
| 25 to 29 Minutes | 202 | 2.0% |
| 30 to 34 Minutes | 434 | 4.3% |
| 35 to 39 Minutes | 55 | 0.5% |
| 40 to 44 Minutes | 149 | 1.5% |
| 45 to 59 Minutes | 192 | 1.9% |
| 60 to 89 Minutes | 233 | 2.3% |
| 90 or more Minutes | 74 | 0.7% |
Commute Time by Sex in South Lake Tahoe
The most common commute times in South Lake Tahoe are 10 to 14 minutes (1,647 commuters, 29.2%) for males and 5 to 9 minutes (1,341 commuters, 29.5%) for females.
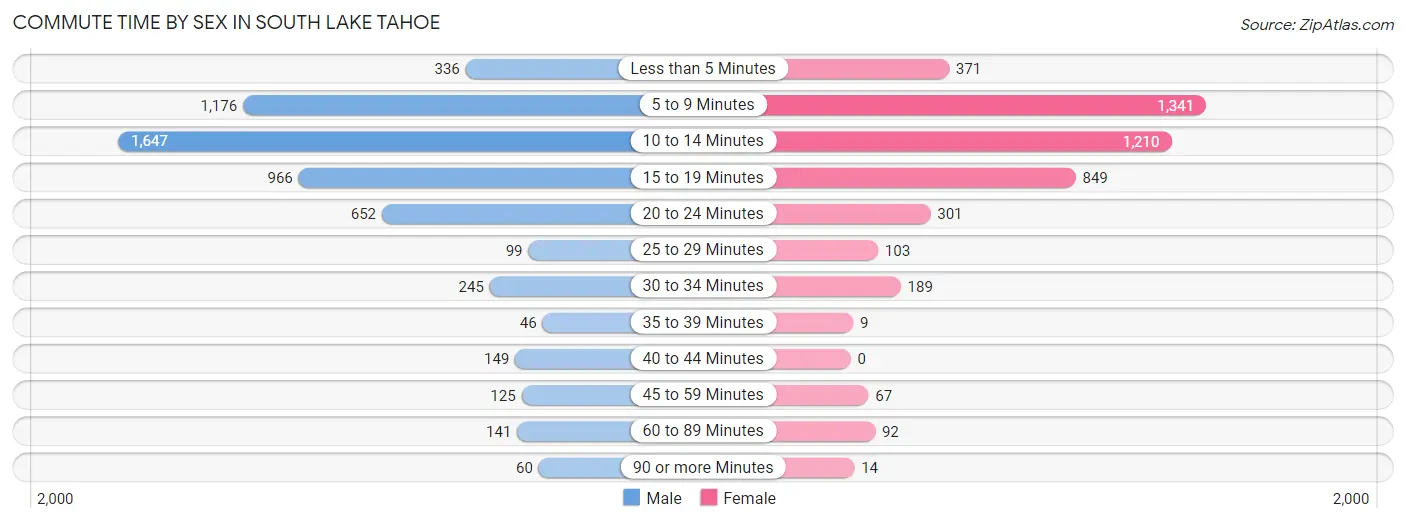
| Commute Time | Male | Female |
| Less than 5 Minutes | 336 (6.0%) | 371 (8.2%) |
| 5 to 9 Minutes | 1,176 (20.8%) | 1,341 (29.5%) |
| 10 to 14 Minutes | 1,647 (29.2%) | 1,210 (26.6%) |
| 15 to 19 Minutes | 966 (17.1%) | 849 (18.7%) |
| 20 to 24 Minutes | 652 (11.6%) | 301 (6.6%) |
| 25 to 29 Minutes | 99 (1.8%) | 103 (2.3%) |
| 30 to 34 Minutes | 245 (4.3%) | 189 (4.2%) |
| 35 to 39 Minutes | 46 (0.8%) | 9 (0.2%) |
| 40 to 44 Minutes | 149 (2.6%) | 0 (0.0%) |
| 45 to 59 Minutes | 125 (2.2%) | 67 (1.5%) |
| 60 to 89 Minutes | 141 (2.5%) | 92 (2.0%) |
| 90 or more Minutes | 60 (1.1%) | 14 (0.3%) |
Time of Departure to Work by Sex in South Lake Tahoe
The most frequent times of departure to work in South Lake Tahoe are 7:30 AM to 7:59 AM (833, 14.8%) for males and 7:30 AM to 7:59 AM (716, 15.8%) for females.
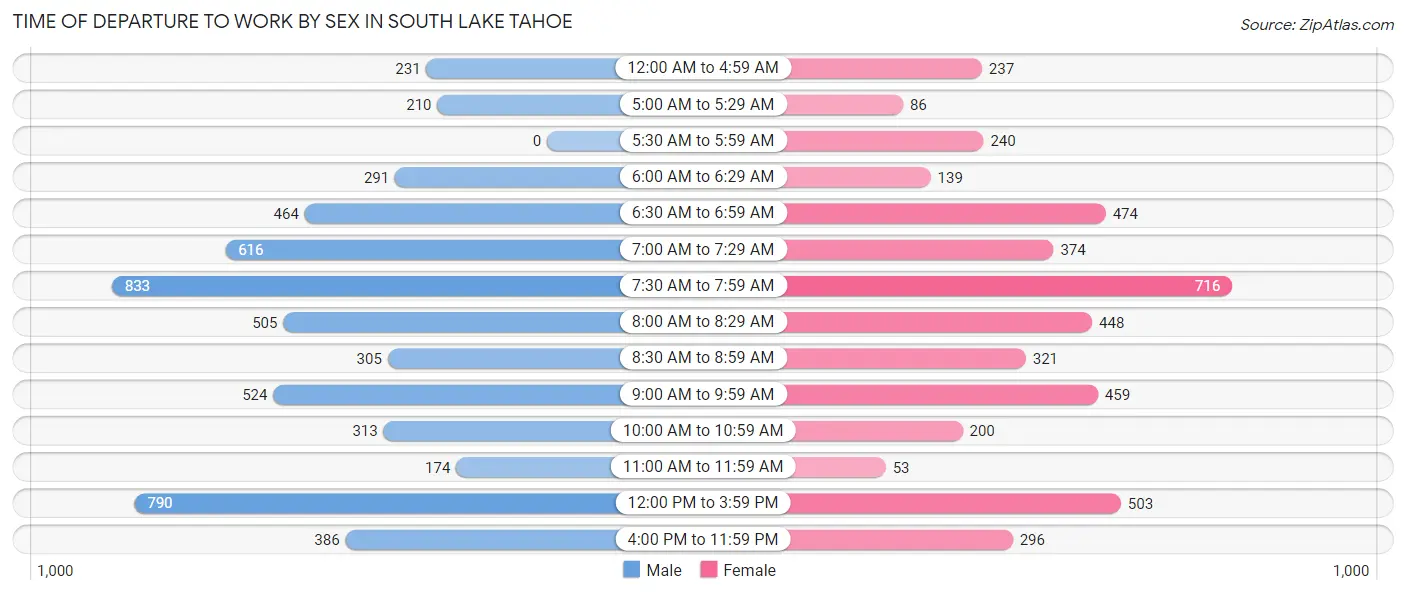
| Time of Departure | Male | Female |
| 12:00 AM to 4:59 AM | 231 (4.1%) | 237 (5.2%) |
| 5:00 AM to 5:29 AM | 210 (3.7%) | 86 (1.9%) |
| 5:30 AM to 5:59 AM | 0 (0.0%) | 240 (5.3%) |
| 6:00 AM to 6:29 AM | 291 (5.2%) | 139 (3.1%) |
| 6:30 AM to 6:59 AM | 464 (8.2%) | 474 (10.4%) |
| 7:00 AM to 7:29 AM | 616 (10.9%) | 374 (8.2%) |
| 7:30 AM to 7:59 AM | 833 (14.8%) | 716 (15.8%) |
| 8:00 AM to 8:29 AM | 505 (8.9%) | 448 (9.9%) |
| 8:30 AM to 8:59 AM | 305 (5.4%) | 321 (7.1%) |
| 9:00 AM to 9:59 AM | 524 (9.3%) | 459 (10.1%) |
| 10:00 AM to 10:59 AM | 313 (5.6%) | 200 (4.4%) |
| 11:00 AM to 11:59 AM | 174 (3.1%) | 53 (1.2%) |
| 12:00 PM to 3:59 PM | 790 (14.0%) | 503 (11.1%) |
| 4:00 PM to 11:59 PM | 386 (6.8%) | 296 (6.5%) |
| Total | 5,642 (100.0%) | 4,546 (100.0%) |
Housing Occupancy in South Lake Tahoe
Occupancy by Ownership in South Lake Tahoe
Of the total 9,125 dwellings in South Lake Tahoe, owner-occupied units account for 4,013 (44.0%), while renter-occupied units make up 5,112 (56.0%).
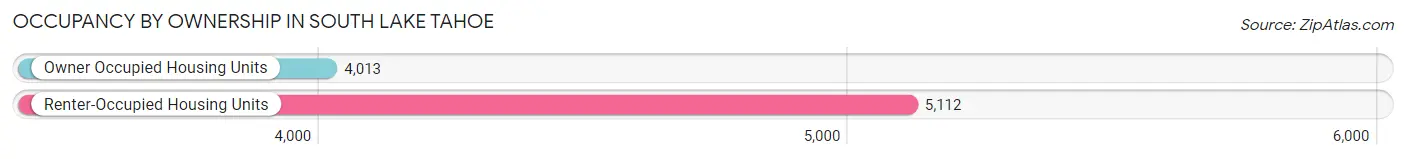
| Occupancy | # Housing Units | % Housing Units |
| Owner Occupied Housing Units | 4,013 | 44.0% |
| Renter-Occupied Housing Units | 5,112 | 56.0% |
| Total Occupied Housing Units | 9,125 | 100.0% |
Occupancy by Household Size in South Lake Tahoe
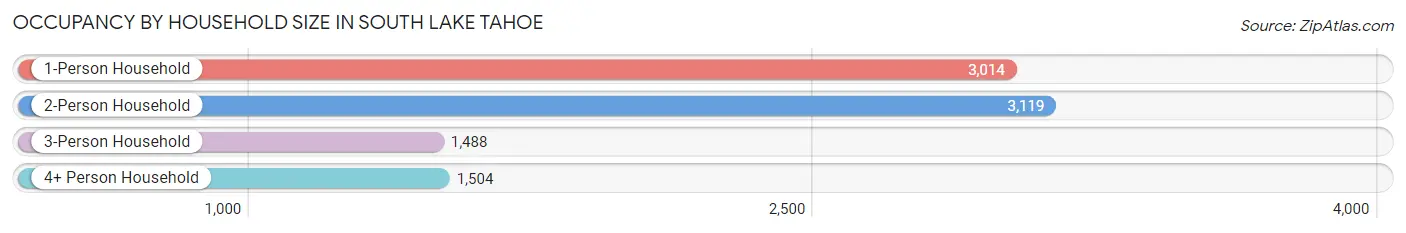
| Household Size | # Housing Units | % Housing Units |
| 1-Person Household | 3,014 | 33.0% |
| 2-Person Household | 3,119 | 34.2% |
| 3-Person Household | 1,488 | 16.3% |
| 4+ Person Household | 1,504 | 16.5% |
| Total Housing Units | 9,125 | 100.0% |
Occupancy by Ownership by Household Size in South Lake Tahoe
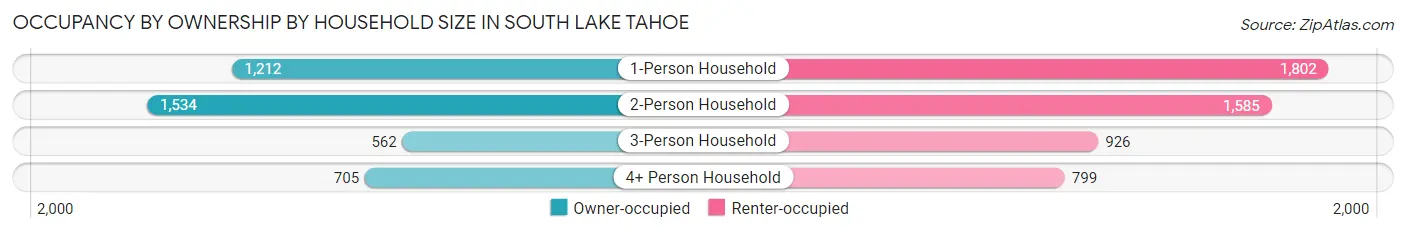
| Household Size | Owner-occupied | Renter-occupied |
| 1-Person Household | 1,212 (40.2%) | 1,802 (59.8%) |
| 2-Person Household | 1,534 (49.2%) | 1,585 (50.8%) |
| 3-Person Household | 562 (37.8%) | 926 (62.2%) |
| 4+ Person Household | 705 (46.9%) | 799 (53.1%) |
| Total Housing Units | 4,013 (44.0%) | 5,112 (56.0%) |
Occupancy by Educational Attainment in South Lake Tahoe
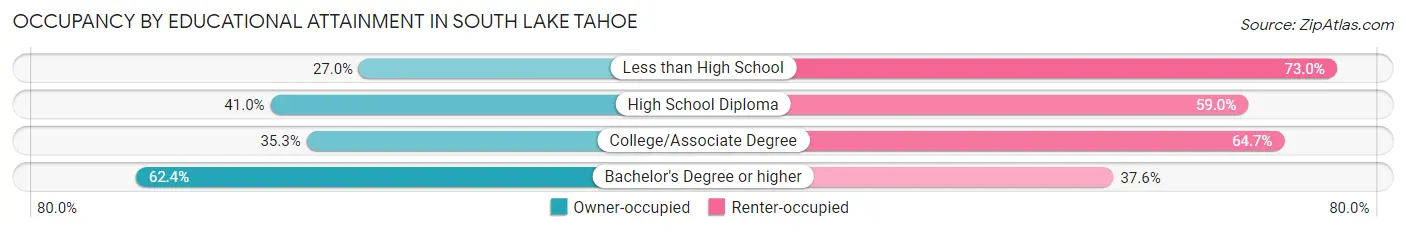
| Household Size | Owner-occupied | Renter-occupied |
| Less than High School | 253 (27.0%) | 685 (73.0%) |
| High School Diploma | 723 (41.0%) | 1,040 (59.0%) |
| College/Associate Degree | 1,263 (35.3%) | 2,316 (64.7%) |
| Bachelor's Degree or higher | 1,774 (62.4%) | 1,071 (37.6%) |
Occupancy by Age of Householder in South Lake Tahoe
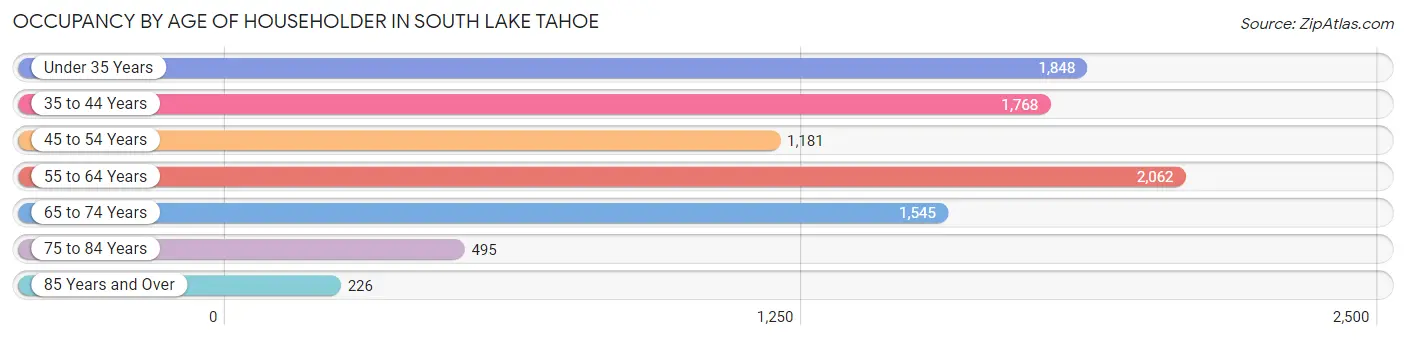
| Age Bracket | # Households | % Households |
| Under 35 Years | 1,848 | 20.3% |
| 35 to 44 Years | 1,768 | 19.4% |
| 45 to 54 Years | 1,181 | 12.9% |
| 55 to 64 Years | 2,062 | 22.6% |
| 65 to 74 Years | 1,545 | 16.9% |
| 75 to 84 Years | 495 | 5.4% |
| 85 Years and Over | 226 | 2.5% |
| Total | 9,125 | 100.0% |
Housing Finances in South Lake Tahoe
Median Income by Occupancy in South Lake Tahoe
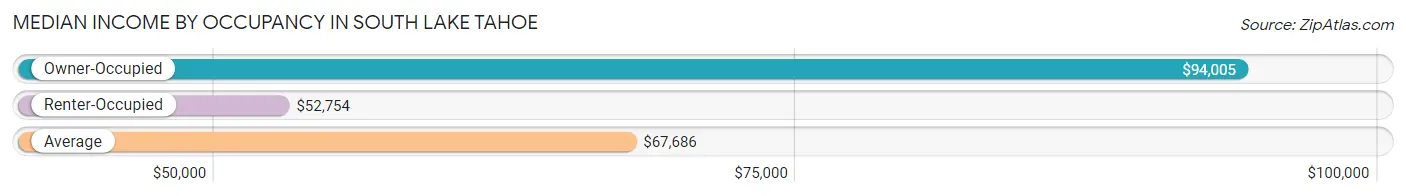
| Occupancy Type | # Households | Median Income |
| Owner-Occupied | 4,013 (44.0%) | $94,005 |
| Renter-Occupied | 5,112 (56.0%) | $52,754 |
| Average | 9,125 (100.0%) | $67,686 |
Occupancy by Householder Income Bracket in South Lake Tahoe
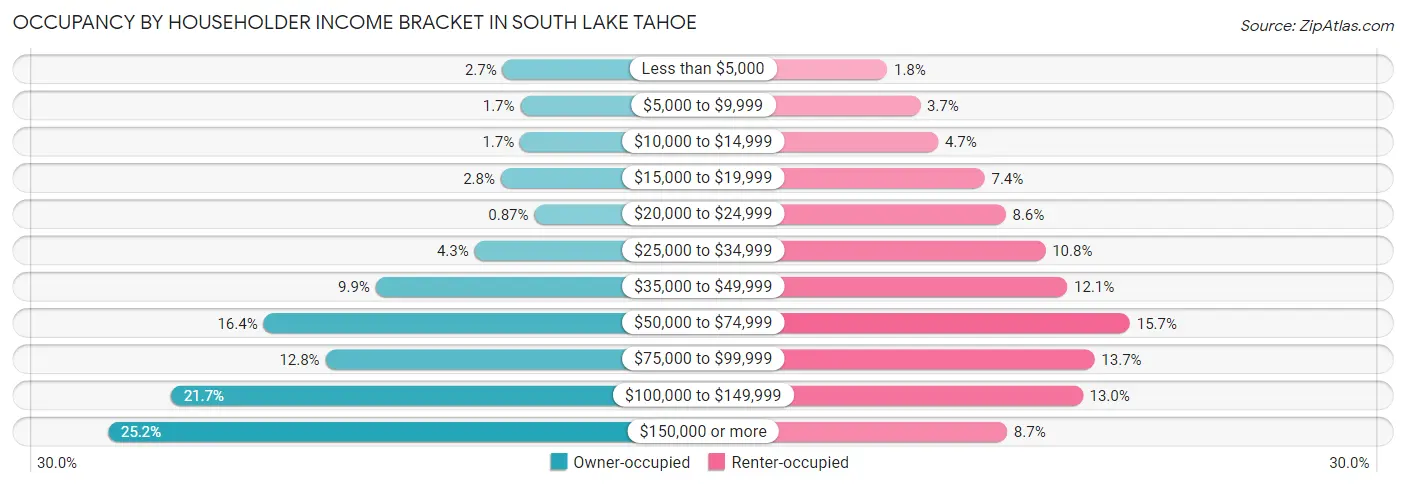
| Income Bracket | Owner-occupied | Renter-occupied |
| Less than $5,000 | 108 (2.7%) | 92 (1.8%) |
| $5,000 to $9,999 | 67 (1.7%) | 188 (3.7%) |
| $10,000 to $14,999 | 68 (1.7%) | 241 (4.7%) |
| $15,000 to $19,999 | 112 (2.8%) | 377 (7.4%) |
| $20,000 to $24,999 | 35 (0.9%) | 438 (8.6%) |
| $25,000 to $34,999 | 172 (4.3%) | 554 (10.8%) |
| $35,000 to $49,999 | 399 (9.9%) | 618 (12.1%) |
| $50,000 to $74,999 | 656 (16.4%) | 801 (15.7%) |
| $75,000 to $99,999 | 514 (12.8%) | 698 (13.7%) |
| $100,000 to $149,999 | 869 (21.6%) | 663 (13.0%) |
| $150,000 or more | 1,013 (25.2%) | 442 (8.6%) |
| Total | 4,013 (100.0%) | 5,112 (100.0%) |
Monthly Housing Cost Tiers in South Lake Tahoe
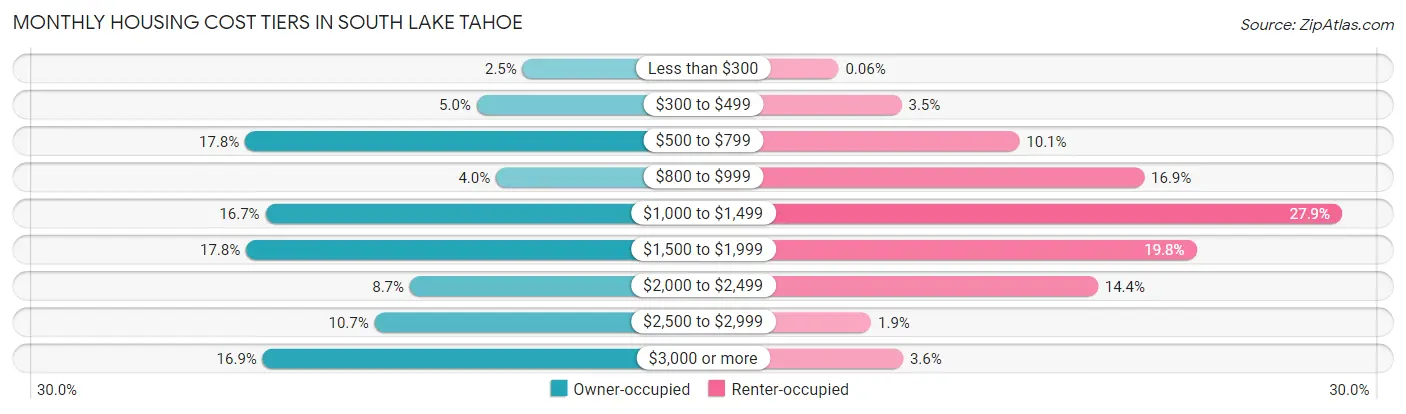
| Monthly Cost | Owner-occupied | Renter-occupied |
| Less than $300 | 100 (2.5%) | 3 (0.1%) |
| $300 to $499 | 202 (5.0%) | 181 (3.5%) |
| $500 to $799 | 715 (17.8%) | 514 (10.1%) |
| $800 to $999 | 159 (4.0%) | 866 (16.9%) |
| $1,000 to $1,499 | 670 (16.7%) | 1,424 (27.9%) |
| $1,500 to $1,999 | 713 (17.8%) | 1,013 (19.8%) |
| $2,000 to $2,499 | 350 (8.7%) | 735 (14.4%) |
| $2,500 to $2,999 | 428 (10.7%) | 95 (1.9%) |
| $3,000 or more | 676 (16.9%) | 185 (3.6%) |
| Total | 4,013 (100.0%) | 5,112 (100.0%) |
Physical Housing Characteristics in South Lake Tahoe
Housing Structures in South Lake Tahoe
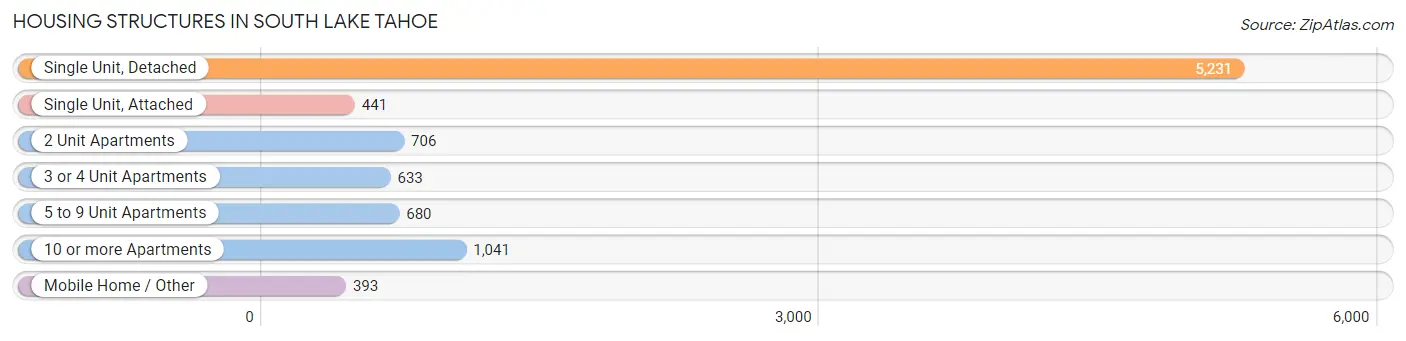
| Structure Type | # Housing Units | % Housing Units |
| Single Unit, Detached | 5,231 | 57.3% |
| Single Unit, Attached | 441 | 4.8% |
| 2 Unit Apartments | 706 | 7.7% |
| 3 or 4 Unit Apartments | 633 | 6.9% |
| 5 to 9 Unit Apartments | 680 | 7.4% |
| 10 or more Apartments | 1,041 | 11.4% |
| Mobile Home / Other | 393 | 4.3% |
| Total | 9,125 | 100.0% |
Housing Structures by Occupancy in South Lake Tahoe
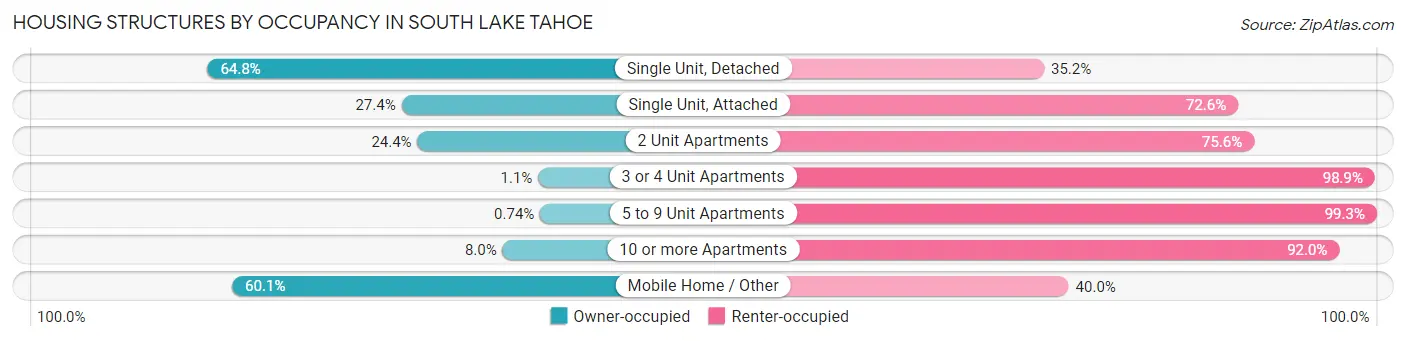
| Structure Type | Owner-occupied | Renter-occupied |
| Single Unit, Detached | 3,389 (64.8%) | 1,842 (35.2%) |
| Single Unit, Attached | 121 (27.4%) | 320 (72.6%) |
| 2 Unit Apartments | 172 (24.4%) | 534 (75.6%) |
| 3 or 4 Unit Apartments | 7 (1.1%) | 626 (98.9%) |
| 5 to 9 Unit Apartments | 5 (0.7%) | 675 (99.3%) |
| 10 or more Apartments | 83 (8.0%) | 958 (92.0%) |
| Mobile Home / Other | 236 (60.1%) | 157 (40.0%) |
| Total | 4,013 (44.0%) | 5,112 (56.0%) |
Housing Structures by Number of Rooms in South Lake Tahoe
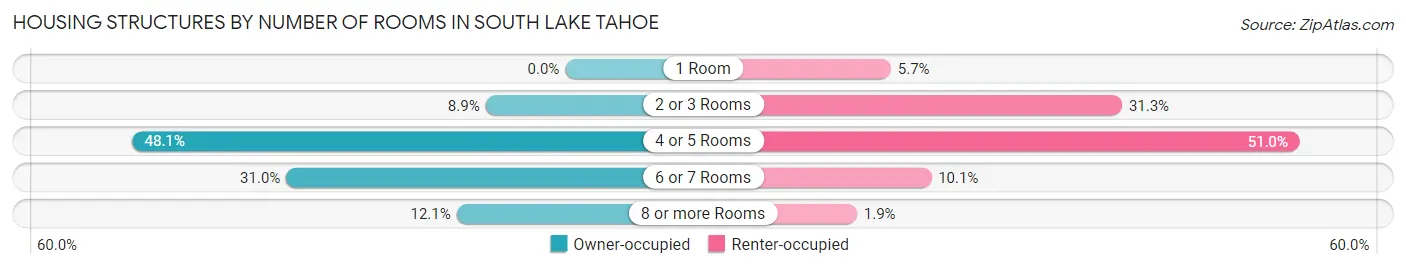
| Number of Rooms | Owner-occupied | Renter-occupied |
| 1 Room | 0 (0.0%) | 289 (5.7%) |
| 2 or 3 Rooms | 355 (8.8%) | 1,600 (31.3%) |
| 4 or 5 Rooms | 1,931 (48.1%) | 2,609 (51.0%) |
| 6 or 7 Rooms | 1,243 (31.0%) | 518 (10.1%) |
| 8 or more Rooms | 484 (12.1%) | 96 (1.9%) |
| Total | 4,013 (100.0%) | 5,112 (100.0%) |
Housing Structure by Heating Type in South Lake Tahoe
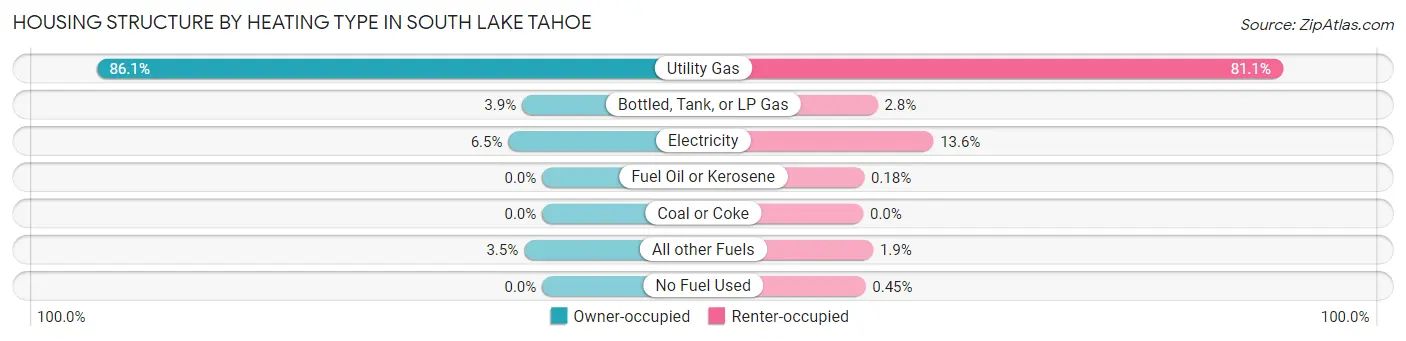
| Heating Type | Owner-occupied | Renter-occupied |
| Utility Gas | 3,455 (86.1%) | 4,146 (81.1%) |
| Bottled, Tank, or LP Gas | 156 (3.9%) | 143 (2.8%) |
| Electricity | 262 (6.5%) | 693 (13.6%) |
| Fuel Oil or Kerosene | 0 (0.0%) | 9 (0.2%) |
| Coal or Coke | 0 (0.0%) | 0 (0.0%) |
| All other Fuels | 140 (3.5%) | 98 (1.9%) |
| No Fuel Used | 0 (0.0%) | 23 (0.4%) |
| Total | 4,013 (100.0%) | 5,112 (100.0%) |
Household Vehicle Usage in South Lake Tahoe
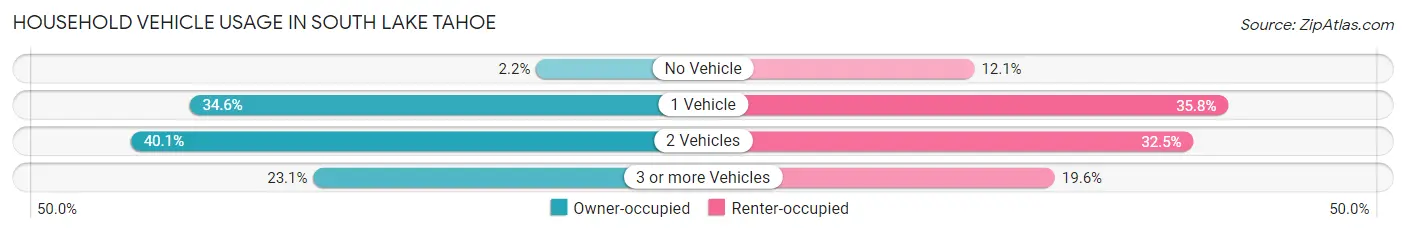
| Vehicles per Household | Owner-occupied | Renter-occupied |
| No Vehicle | 90 (2.2%) | 618 (12.1%) |
| 1 Vehicle | 1,389 (34.6%) | 1,829 (35.8%) |
| 2 Vehicles | 1,609 (40.1%) | 1,663 (32.5%) |
| 3 or more Vehicles | 925 (23.1%) | 1,002 (19.6%) |
| Total | 4,013 (100.0%) | 5,112 (100.0%) |
Real Estate & Mortgages in South Lake Tahoe
Real Estate and Mortgage Overview in South Lake Tahoe
| Characteristic | Without Mortgage | With Mortgage |
| Housing Units | 1,469 | 2,544 |
| Median Property Value | $608,300 | $549,900 |
| Median Household Income | $64,875 | $789 |
| Monthly Housing Costs | $699 | $676 |
| Real Estate Taxes | $2,874 | $72 |
Property Value by Mortgage Status in South Lake Tahoe
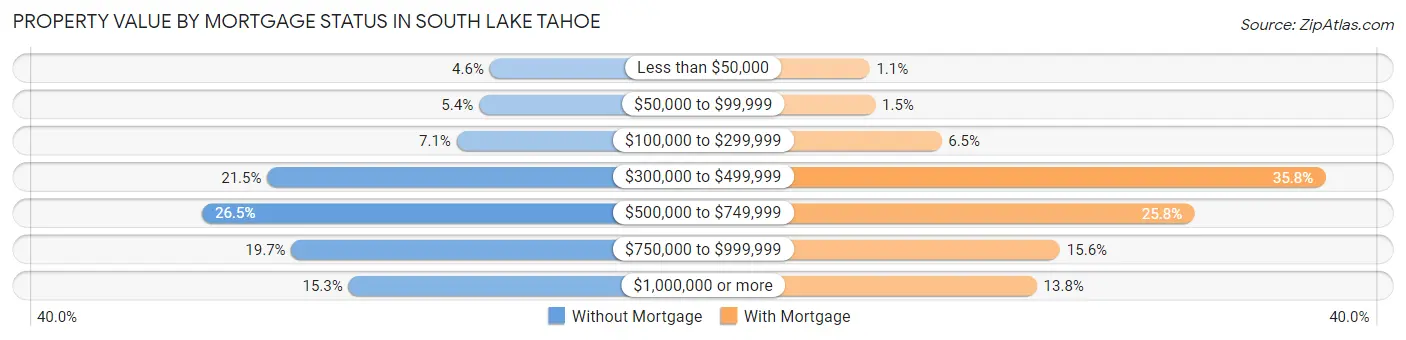
| Property Value | Without Mortgage | With Mortgage |
| Less than $50,000 | 67 (4.6%) | 27 (1.1%) |
| $50,000 to $99,999 | 79 (5.4%) | 38 (1.5%) |
| $100,000 to $299,999 | 104 (7.1%) | 166 (6.5%) |
| $300,000 to $499,999 | 316 (21.5%) | 910 (35.8%) |
| $500,000 to $749,999 | 389 (26.5%) | 656 (25.8%) |
| $750,000 to $999,999 | 289 (19.7%) | 396 (15.6%) |
| $1,000,000 or more | 225 (15.3%) | 351 (13.8%) |
| Total | 1,469 (100.0%) | 2,544 (100.0%) |
Household Income by Mortgage Status in South Lake Tahoe
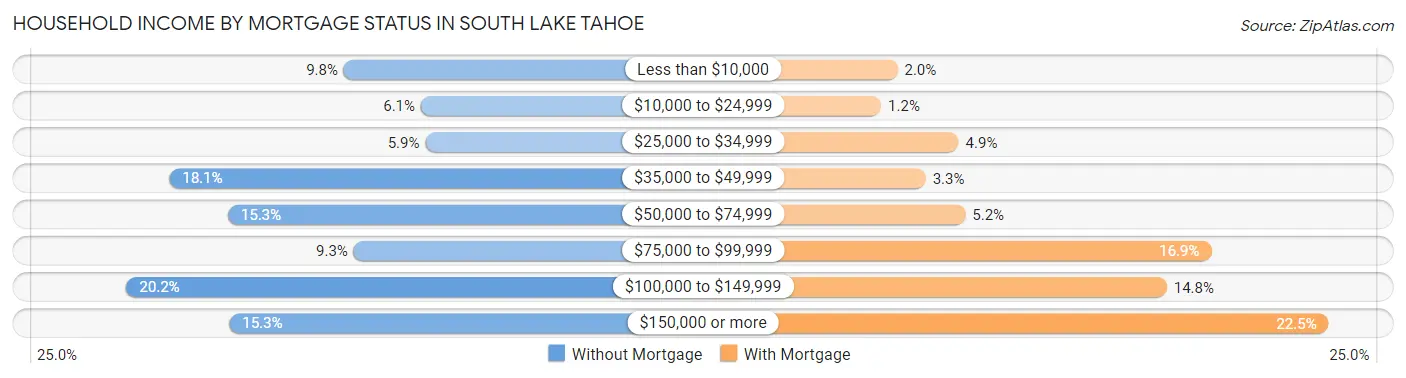
| Household Income | Without Mortgage | With Mortgage |
| Less than $10,000 | 144 (9.8%) | 51 (2.0%) |
| $10,000 to $24,999 | 90 (6.1%) | 31 (1.2%) |
| $25,000 to $34,999 | 87 (5.9%) | 125 (4.9%) |
| $35,000 to $49,999 | 266 (18.1%) | 85 (3.3%) |
| $50,000 to $74,999 | 225 (15.3%) | 133 (5.2%) |
| $75,000 to $99,999 | 137 (9.3%) | 431 (16.9%) |
| $100,000 to $149,999 | 296 (20.2%) | 377 (14.8%) |
| $150,000 or more | 224 (15.2%) | 573 (22.5%) |
| Total | 1,469 (100.0%) | 2,544 (100.0%) |
Property Value to Household Income Ratio in South Lake Tahoe
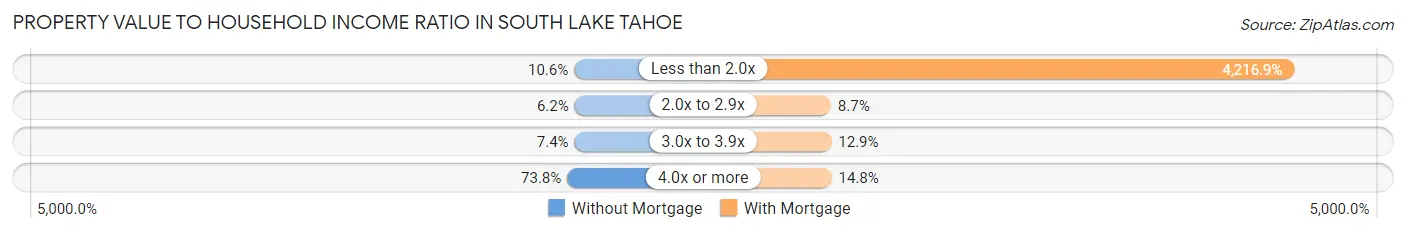
| Value-to-Income Ratio | Without Mortgage | With Mortgage |
| Less than 2.0x | 156 (10.6%) | 107,279 (4,216.9%) |
| 2.0x to 2.9x | 91 (6.2%) | 222 (8.7%) |
| 3.0x to 3.9x | 108 (7.3%) | 329 (12.9%) |
| 4.0x or more | 1,084 (73.8%) | 376 (14.8%) |
| Total | 1,469 (100.0%) | 2,544 (100.0%) |
Real Estate Taxes by Mortgage Status in South Lake Tahoe
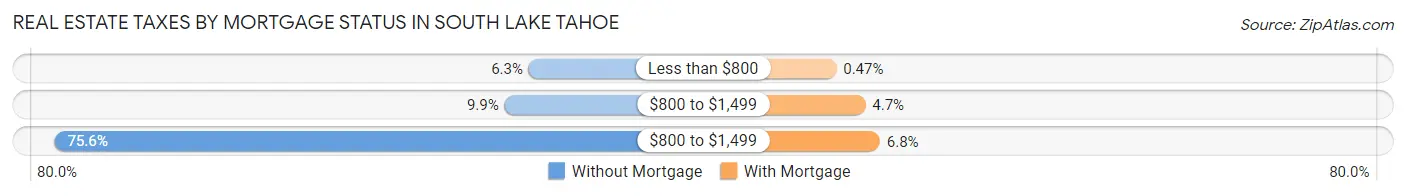
| Property Taxes | Without Mortgage | With Mortgage |
| Less than $800 | 93 (6.3%) | 12 (0.5%) |
| $800 to $1,499 | 145 (9.9%) | 120 (4.7%) |
| $800 to $1,499 | 1,111 (75.6%) | 174 (6.8%) |
| Total | 1,469 (100.0%) | 2,544 (100.0%) |
Health & Disability in South Lake Tahoe
Health Insurance Coverage by Age in South Lake Tahoe
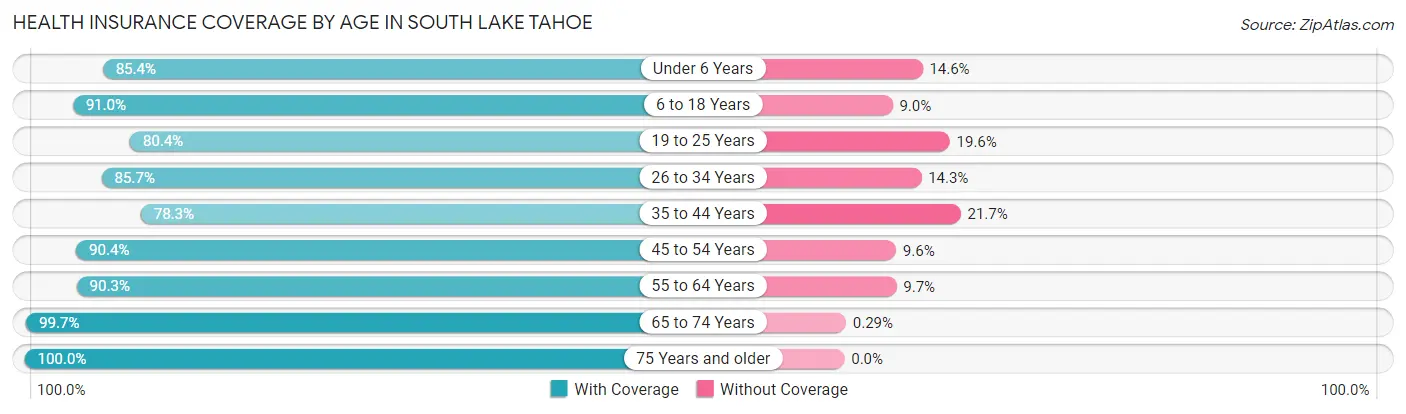
| Age Bracket | With Coverage | Without Coverage |
| Under 6 Years | 991 (85.4%) | 169 (14.6%) |
| 6 to 18 Years | 2,210 (91.0%) | 218 (9.0%) |
| 19 to 25 Years | 1,665 (80.4%) | 407 (19.6%) |
| 26 to 34 Years | 2,950 (85.7%) | 494 (14.3%) |
| 35 to 44 Years | 2,510 (78.3%) | 695 (21.7%) |
| 45 to 54 Years | 2,001 (90.4%) | 213 (9.6%) |
| 55 to 64 Years | 2,922 (90.3%) | 314 (9.7%) |
| 65 to 74 Years | 2,367 (99.7%) | 7 (0.3%) |
| 75 Years and older | 1,016 (100.0%) | 0 (0.0%) |
| Total | 18,632 (88.1%) | 2,517 (11.9%) |
Health Insurance Coverage by Citizenship Status in South Lake Tahoe
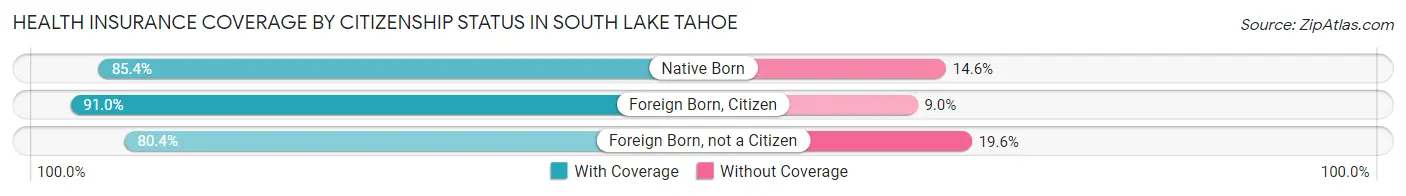
| Citizenship Status | With Coverage | Without Coverage |
| Native Born | 991 (85.4%) | 169 (14.6%) |
| Foreign Born, Citizen | 2,210 (91.0%) | 218 (9.0%) |
| Foreign Born, not a Citizen | 1,665 (80.4%) | 407 (19.6%) |
Health Insurance Coverage by Household Income in South Lake Tahoe
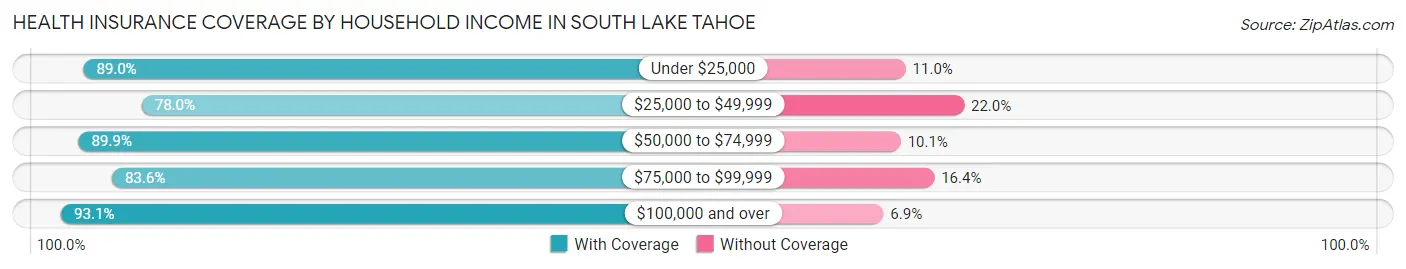
| Household Income | With Coverage | Without Coverage |
| Under $25,000 | 2,201 (89.0%) | 273 (11.0%) |
| $25,000 to $49,999 | 2,714 (78.0%) | 764 (22.0%) |
| $50,000 to $74,999 | 3,213 (89.9%) | 361 (10.1%) |
| $75,000 to $99,999 | 2,839 (83.6%) | 556 (16.4%) |
| $100,000 and over | 7,548 (93.1%) | 556 (6.9%) |
Public vs Private Health Insurance Coverage by Age in South Lake Tahoe
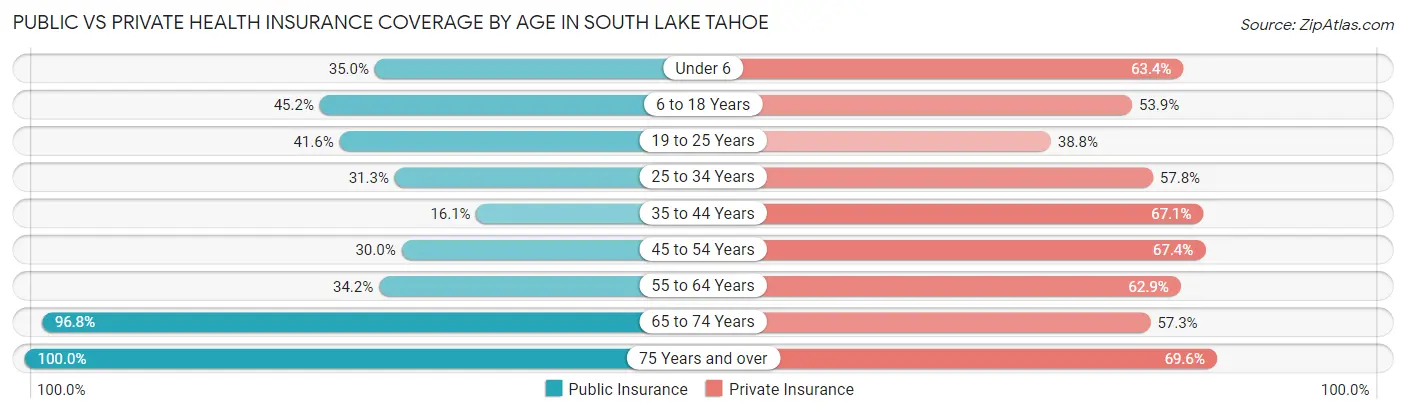
| Age Bracket | Public Insurance | Private Insurance |
| Under 6 | 406 (35.0%) | 735 (63.4%) |
| 6 to 18 Years | 1,098 (45.2%) | 1,308 (53.9%) |
| 19 to 25 Years | 861 (41.5%) | 804 (38.8%) |
| 25 to 34 Years | 1,078 (31.3%) | 1,989 (57.8%) |
| 35 to 44 Years | 517 (16.1%) | 2,151 (67.1%) |
| 45 to 54 Years | 665 (30.0%) | 1,493 (67.4%) |
| 55 to 64 Years | 1,107 (34.2%) | 2,035 (62.9%) |
| 65 to 74 Years | 2,298 (96.8%) | 1,360 (57.3%) |
| 75 Years and over | 1,016 (100.0%) | 707 (69.6%) |
| Total | 9,046 (42.8%) | 12,582 (59.5%) |
Disability Status by Sex by Age in South Lake Tahoe
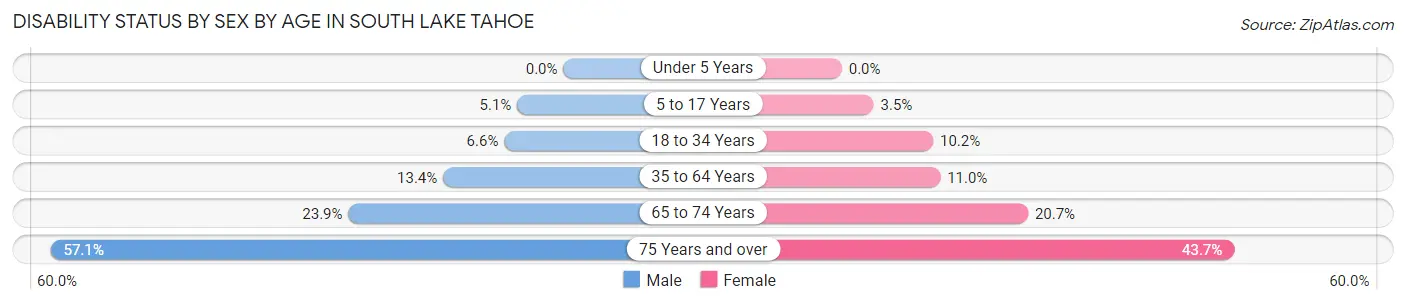
| Age Bracket | Male | Female |
| Under 5 Years | 0 (0.0%) | 0 (0.0%) |
| 5 to 17 Years | 53 (5.1%) | 48 (3.5%) |
| 18 to 34 Years | 186 (6.6%) | 294 (10.2%) |
| 35 to 64 Years | 609 (13.4%) | 450 (11.0%) |
| 65 to 74 Years | 298 (23.9%) | 234 (20.7%) |
| 75 Years and over | 277 (57.1%) | 232 (43.7%) |
Disability Class by Sex by Age in South Lake Tahoe
Disability Class: Hearing Difficulty
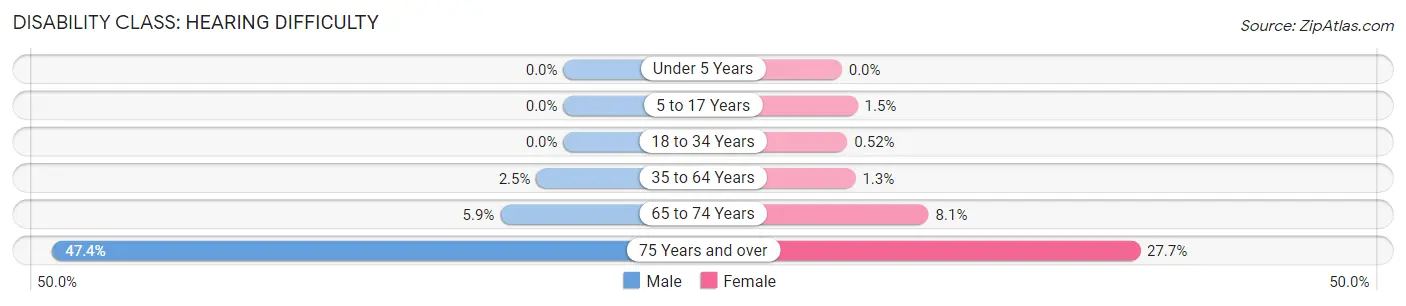
| Age Bracket | Male | Female |
| Under 5 Years | 0 (0.0%) | 0 (0.0%) |
| 5 to 17 Years | 0 (0.0%) | 20 (1.5%) |
| 18 to 34 Years | 0 (0.0%) | 15 (0.5%) |
| 35 to 64 Years | 114 (2.5%) | 52 (1.3%) |
| 65 to 74 Years | 73 (5.9%) | 91 (8.1%) |
| 75 Years and over | 230 (47.4%) | 147 (27.7%) |
Disability Class: Vision Difficulty
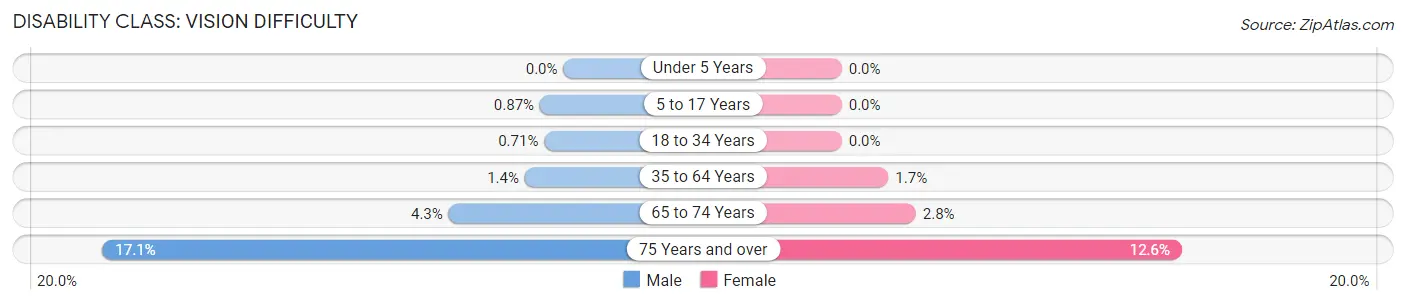
| Age Bracket | Male | Female |
| Under 5 Years | 0 (0.0%) | 0 (0.0%) |
| 5 to 17 Years | 9 (0.9%) | 0 (0.0%) |
| 18 to 34 Years | 20 (0.7%) | 0 (0.0%) |
| 35 to 64 Years | 65 (1.4%) | 71 (1.7%) |
| 65 to 74 Years | 53 (4.3%) | 31 (2.8%) |
| 75 Years and over | 83 (17.1%) | 67 (12.6%) |
Disability Class: Cognitive Difficulty
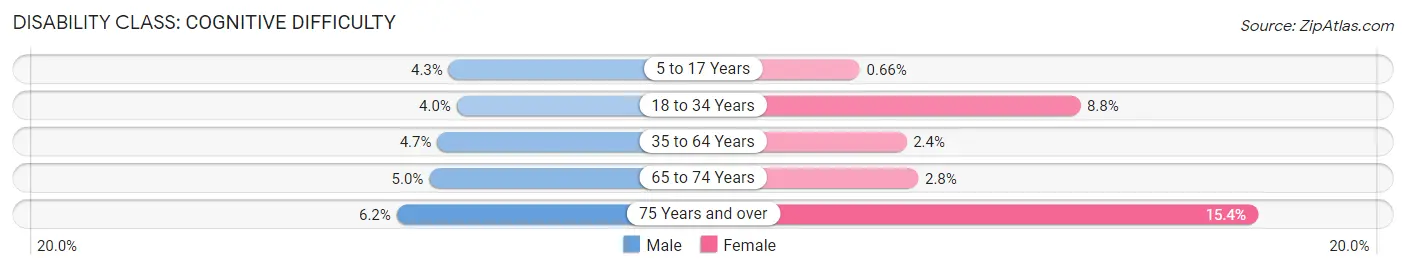
| Age Bracket | Male | Female |
| 5 to 17 Years | 44 (4.3%) | 9 (0.7%) |
| 18 to 34 Years | 112 (4.0%) | 256 (8.8%) |
| 35 to 64 Years | 213 (4.7%) | 98 (2.4%) |
| 65 to 74 Years | 62 (5.0%) | 32 (2.8%) |
| 75 Years and over | 30 (6.2%) | 82 (15.4%) |
Disability Class: Ambulatory Difficulty
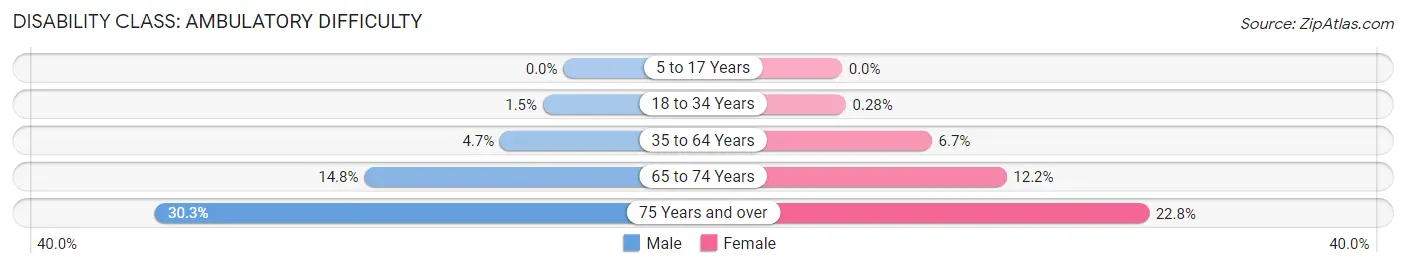
| Age Bracket | Male | Female |
| 5 to 17 Years | 0 (0.0%) | 0 (0.0%) |
| 18 to 34 Years | 43 (1.5%) | 8 (0.3%) |
| 35 to 64 Years | 214 (4.7%) | 274 (6.7%) |
| 65 to 74 Years | 184 (14.8%) | 138 (12.2%) |
| 75 Years and over | 147 (30.3%) | 121 (22.8%) |
Disability Class: Self-Care Difficulty
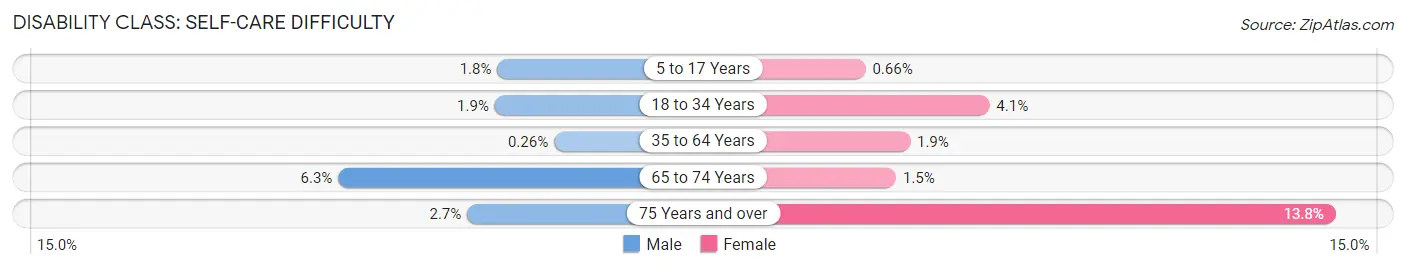
| Age Bracket | Male | Female |
| 5 to 17 Years | 19 (1.8%) | 9 (0.7%) |
| 18 to 34 Years | 54 (1.9%) | 119 (4.1%) |
| 35 to 64 Years | 12 (0.3%) | 78 (1.9%) |
| 65 to 74 Years | 78 (6.3%) | 17 (1.5%) |
| 75 Years and over | 13 (2.7%) | 73 (13.8%) |
Technology Access in South Lake Tahoe
Computing Device Access in South Lake Tahoe
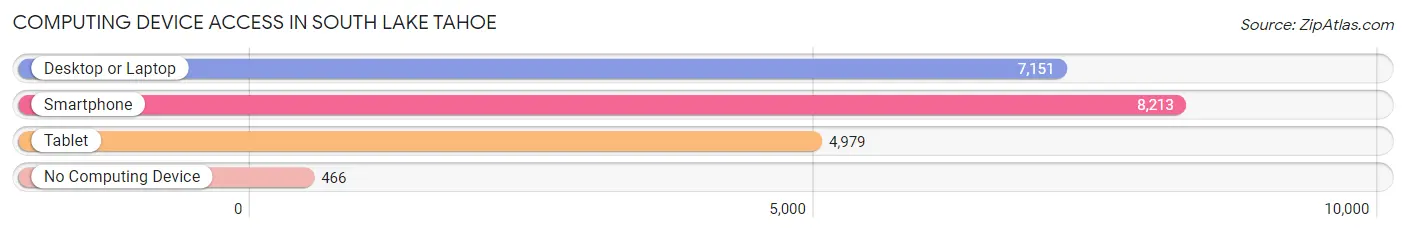
| Device Type | # Households | % Households |
| Desktop or Laptop | 7,151 | 78.4% |
| Smartphone | 8,213 | 90.0% |
| Tablet | 4,979 | 54.6% |
| No Computing Device | 466 | 5.1% |
| Total | 9,125 | 100.0% |
Internet Access in South Lake Tahoe
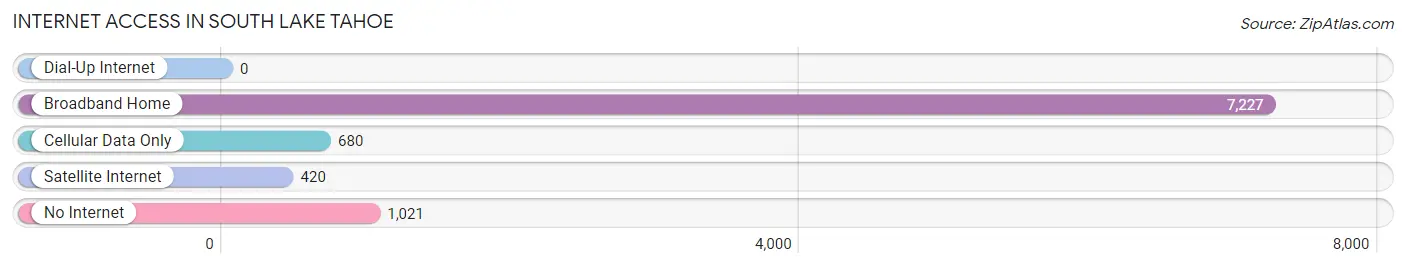
| Internet Type | # Households | % Households |
| Dial-Up Internet | 0 | 0.0% |
| Broadband Home | 7,227 | 79.2% |
| Cellular Data Only | 680 | 7.4% |
| Satellite Internet | 420 | 4.6% |
| No Internet | 1,021 | 11.2% |
| Total | 9,125 | 100.0% |
South Lake Tahoe Summary
Lake Tahoe is a large freshwater lake located in the Sierra Nevada mountain range in the United States. It is the second deepest lake in the United States and the largest alpine lake in North America. The lake is located along the border of California and Nevada, with the majority of the lake located in California. The lake is known for its crystal clear waters and stunning views of the surrounding mountains.
History
The history of Lake Tahoe dates back thousands of years. The Washoe people were the first to inhabit the area, and they called the lake “Da ow a ga”, which translates to “edge of the lake”. The Washoe people used the lake for fishing and gathering food.
In the mid-1800s, the area around Lake Tahoe began to be settled by European settlers. The first settlement was established in 1858, and the area quickly became a popular destination for tourists. The first hotel was built in 1864, and the first ski resort opened in 1869.
The area around Lake Tahoe was also popular with the wealthy, and many of the grandest homes in the area were built in the late 1800s and early 1900s. The area was also popular with celebrities, and many of them had homes in the area.
Geography
Lake Tahoe is located in the Sierra Nevada mountain range in the United States. It is the second deepest lake in the United States and the largest alpine lake in North America. The lake is located along the border of California and Nevada, with the majority of the lake located in California.
The lake is 22 miles long and 12 miles wide, and has a surface area of 191 square miles. The lake is surrounded by mountains, and the highest peak is Freel Peak, which is 10,881 feet above sea level. The lake is fed by 63 tributaries, and the water is crystal clear.
Economy
The economy of Lake Tahoe is largely based on tourism. The area is a popular destination for outdoor activities such as skiing, snowboarding, hiking, camping, and fishing. The area is also popular for its casinos, which attract visitors from all over the world.
The area is also home to several large companies, including Harrah’s Entertainment, which operates several casinos in the area. The area is also home to several technology companies, including Oracle and Microsoft.
Demographics
The population of Lake Tahoe is approximately 21,000 people. The majority of the population is white (83%), followed by Hispanic (7%), Asian (4%), and African American (3%). The median household income is $60,000, and the median home value is $400,000.
The area is also home to several universities, including the University of Nevada, Reno and Sierra Nevada College. The area is also home to several ski resorts, including Heavenly Mountain Resort and Squaw Valley Ski Resort.
Conclusion
Lake Tahoe is a stunning lake located in the Sierra Nevada mountain range in the United States. The lake is known for its crystal clear waters and stunning views of the surrounding mountains. The area is a popular destination for outdoor activities such as skiing, snowboarding, hiking, camping, and fishing. The area is also home to several large companies, including Harrah’s Entertainment, which operates several casinos in the area. The population of Lake Tahoe is approximately 21,000 people, and the median household income is $60,000.
Common Questions
What is Per Capita Income in South Lake Tahoe?
Per Capita income in South Lake Tahoe is $46,093.
What is the Median Family Income in South Lake Tahoe?
Median Family Income in South Lake Tahoe is $86,588.
What is the Median Household income in South Lake Tahoe?
Median Household Income in South Lake Tahoe is $67,686.
What is Income or Wage Gap in South Lake Tahoe?
Income or Wage Gap in South Lake Tahoe is 15.3%.
Women in South Lake Tahoe earn 84.7 cents for every dollar earned by a man.
What is Inequality or Gini Index in South Lake Tahoe?
Inequality or Gini Index in South Lake Tahoe is 0.53.
What is the Total Population of South Lake Tahoe?
Total Population of South Lake Tahoe is 21,346.
What is the Total Male Population of South Lake Tahoe?
Total Male Population of South Lake Tahoe is 10,775.
What is the Total Female Population of South Lake Tahoe?
Total Female Population of South Lake Tahoe is 10,571.
What is the Ratio of Males per 100 Females in South Lake Tahoe?
There are 101.93 Males per 100 Females in South Lake Tahoe.
What is the Ratio of Females per 100 Males in South Lake Tahoe?
There are 98.11 Females per 100 Males in South Lake Tahoe.
What is the Median Population Age in South Lake Tahoe?
Median Population Age in South Lake Tahoe is 38.9 Years.
What is the Average Family Size in South Lake Tahoe
Average Family Size in South Lake Tahoe is 2.9 People.
What is the Average Household Size in South Lake Tahoe
Average Household Size in South Lake Tahoe is 2.3 People.
How Large is the Labor Force in South Lake Tahoe?
There are 12,669 People in the Labor Forcein in South Lake Tahoe.
What is the Percentage of People in the Labor Force in South Lake Tahoe?
69.3% of People are in the Labor Force in South Lake Tahoe.
What is the Unemployment Rate in South Lake Tahoe?
Unemployment Rate in South Lake Tahoe is 4.6%.