Cities with the Highest Percentage of Population Employed in Accommodation & Food Services in New Hampshire
RELATED REPORTS & OPTIONS
Accommodation & Food Services
New Hampshire
Compare Cities
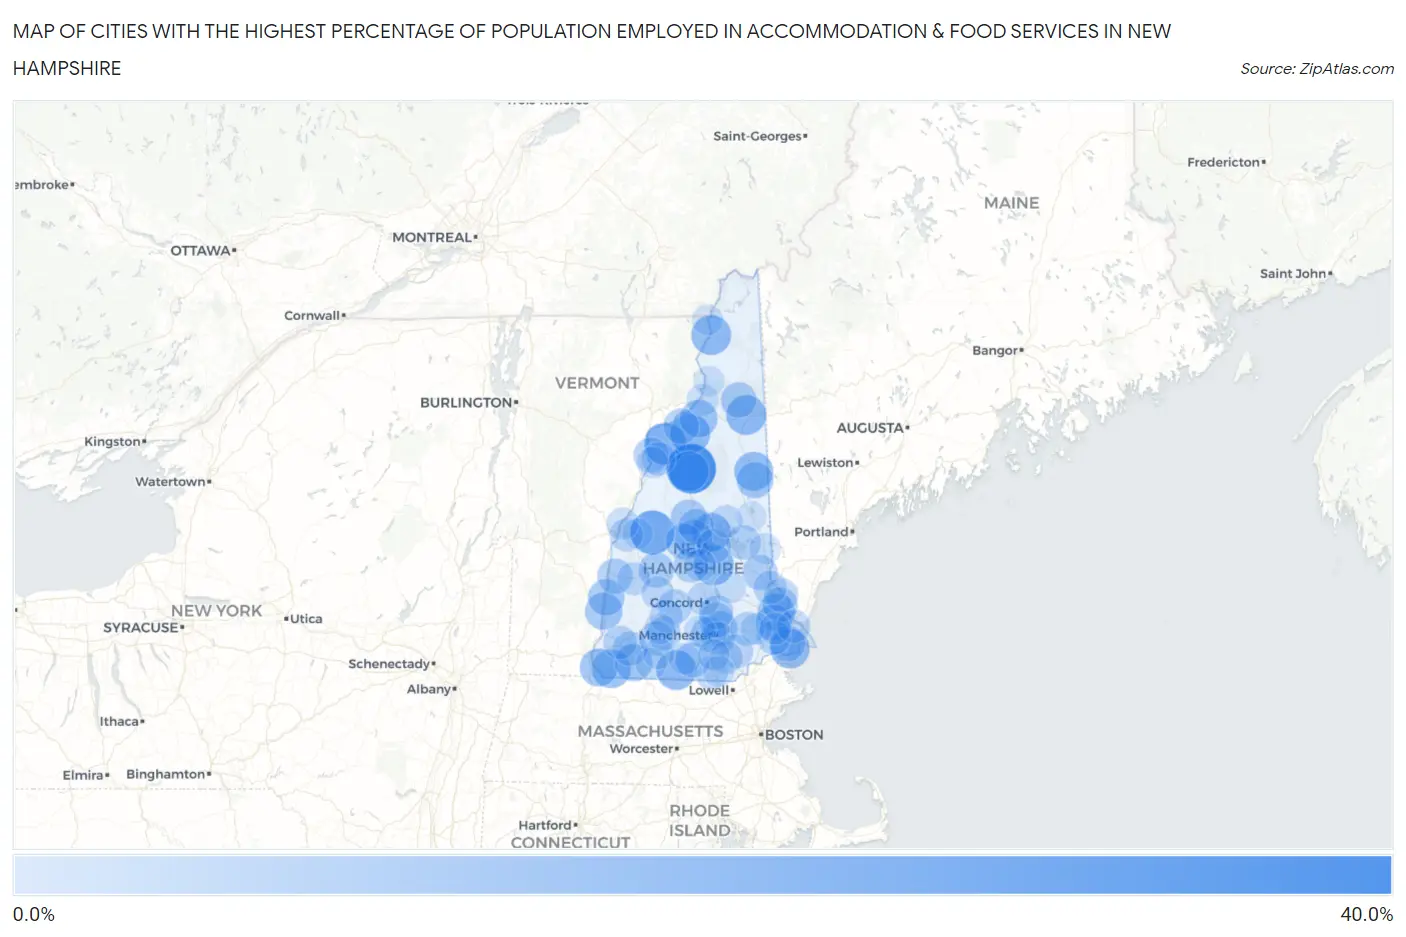
Map of Cities with the Highest Percentage of Population Employed in Accommodation & Food Services in New Hampshire
0.0%
40.0%
Cities with the Highest Percentage of Population Employed in Accommodation & Food Services in New Hampshire
| City | % Employed | vs State | vs National | |
| 1. | Lincoln | 36.8% | 6.3%(+30.5)#1 | 6.9%(+29.9)#319 |
| 2. | Canaan | 26.3% | 6.3%(+20.0)#2 | 6.9%(+19.4)#658 |
| 3. | Lisbon | 21.5% | 6.3%(+15.2)#3 | 6.9%(+14.6)#1,059 |
| 4. | Belmont | 19.1% | 6.3%(+12.8)#4 | 6.9%(+12.2)#1,408 |
| 5. | Bethlehem | 18.9% | 6.3%(+12.6)#5 | 6.9%(+12.0)#1,439 |
| 6. | North Woodstock | 18.8% | 6.3%(+12.5)#6 | 6.9%(+11.9)#1,455 |
| 7. | Colebrook | 18.4% | 6.3%(+12.1)#7 | 6.9%(+11.5)#1,537 |
| 8. | Gorham | 18.3% | 6.3%(+12.0)#8 | 6.9%(+11.4)#1,561 |
| 9. | Greenville | 18.2% | 6.3%(+11.9)#9 | 6.9%(+11.4)#1,571 |
| 10. | Hampton Beach | 17.2% | 6.3%(+10.9)#10 | 6.9%(+10.3)#1,788 |
| 11. | North Conway | 16.4% | 6.3%(+10.1)#11 | 6.9%(+9.54)#1,972 |
| 12. | Meredith | 16.4% | 6.3%(+10.1)#12 | 6.9%(+9.53)#1,975 |
| 13. | Winchester | 15.8% | 6.3%(+9.53)#13 | 6.9%(+8.95)#2,159 |
| 14. | Hinsdale | 14.4% | 6.3%(+8.06)#14 | 6.9%(+7.48)#2,694 |
| 15. | New Hampton | 13.9% | 6.3%(+7.60)#15 | 6.9%(+7.03)#2,889 |
| 16. | Whitefield | 13.7% | 6.3%(+7.38)#16 | 6.9%(+6.80)#3,000 |
| 17. | Durham | 13.7% | 6.3%(+7.37)#17 | 6.9%(+6.80)#3,009 |
| 18. | Troy | 13.6% | 6.3%(+7.27)#18 | 6.9%(+6.69)#3,075 |
| 19. | North Walpole | 13.2% | 6.3%(+6.85)#19 | 6.9%(+6.28)#3,275 |
| 20. | Conway | 12.0% | 6.3%(+5.67)#20 | 6.9%(+5.10)#4,028 |
| 21. | Charlestown | 11.9% | 6.3%(+5.57)#21 | 6.9%(+4.99)#4,104 |
| 22. | Newmarket | 11.7% | 6.3%(+5.36)#22 | 6.9%(+4.78)#4,256 |
| 23. | Plymouth | 11.2% | 6.3%(+4.88)#23 | 6.9%(+4.30)#4,630 |
| 24. | Bristol | 11.1% | 6.3%(+4.81)#24 | 6.9%(+4.23)#4,678 |
| 25. | Berlin | 10.3% | 6.3%(+4.04)#25 | 6.9%(+3.46)#5,396 |
| 26. | Hampton | 10.3% | 6.3%(+3.98)#26 | 6.9%(+3.40)#5,466 |
| 27. | Littleton | 9.8% | 6.3%(+3.50)#27 | 6.9%(+2.92)#6,008 |
| 28. | Claremont | 9.7% | 6.3%(+3.42)#28 | 6.9%(+2.85)#6,112 |
| 29. | New London | 9.7% | 6.3%(+3.41)#29 | 6.9%(+2.83)#6,122 |
| 30. | Dover | 9.4% | 6.3%(+3.12)#30 | 6.9%(+2.54)#6,488 |
| 31. | Ashland | 9.4% | 6.3%(+3.11)#31 | 6.9%(+2.53)#6,498 |
| 32. | Franklin | 9.3% | 6.3%(+3.03)#32 | 6.9%(+2.45)#6,603 |
| 33. | South Hooksett | 9.3% | 6.3%(+2.99)#33 | 6.9%(+2.41)#6,665 |
| 34. | Woodsville | 9.2% | 6.3%(+2.89)#34 | 6.9%(+2.31)#6,794 |
| 35. | Farmington | 9.1% | 6.3%(+2.82)#35 | 6.9%(+2.25)#6,895 |
| 36. | Pinardville | 9.1% | 6.3%(+2.77)#36 | 6.9%(+2.19)#6,998 |
| 37. | Milford | 9.0% | 6.3%(+2.69)#37 | 6.9%(+2.11)#7,115 |
| 38. | Hooksett | 8.5% | 6.3%(+2.18)#38 | 6.9%(+1.60)#7,908 |
| 39. | Wolfeboro | 8.3% | 6.3%(+1.98)#39 | 6.9%(+1.40)#8,260 |
| 40. | Laconia | 8.1% | 6.3%(+1.80)#40 | 6.9%(+1.22)#8,568 |
| 41. | Marlborough | 7.9% | 6.3%(+1.56)#41 | 6.9%(+0.984)#8,991 |
| 42. | Hancock | 7.8% | 6.3%(+1.54)#42 | 6.9%(+0.962)#9,045 |
| 43. | Exeter | 7.5% | 6.3%(+1.21)#43 | 6.9%(+0.628)#9,742 |
| 44. | Henniker | 7.4% | 6.3%(+1.14)#44 | 6.9%(+0.561)#9,891 |
| 45. | Bennington | 7.4% | 6.3%(+1.07)#45 | 6.9%(+0.496)#10,037 |
| 46. | Suncook | 7.3% | 6.3%(+0.994)#46 | 6.9%(+0.416)#10,189 |
| 47. | Manchester | 7.2% | 6.3%(+0.853)#47 | 6.9%(+0.275)#10,458 |
| 48. | Raymond | 7.1% | 6.3%(+0.755)#48 | 6.9%(+0.177)#10,672 |
| 49. | Derry | 7.0% | 6.3%(+0.660)#49 | 6.9%(+0.082)#10,884 |
| 50. | Somersworth | 6.7% | 6.3%(+0.395)#50 | 6.9%(-0.183)#11,518 |
| 51. | Keene | 6.6% | 6.3%(+0.323)#51 | 6.9%(-0.255)#11,702 |
| 52. | Mountain Lakes | 6.4% | 6.3%(+0.116)#52 | 6.9%(-0.462)#12,195 |
| 53. | Rochester | 6.3% | 6.3%(+0.009)#53 | 6.9%(-0.569)#12,454 |
| 54. | Portsmouth | 6.2% | 6.3%(-0.093)#54 | 6.9%(-0.671)#12,708 |
| 55. | Concord | 6.0% | 6.3%(-0.277)#55 | 6.9%(-0.855)#13,180 |
| 56. | Lebanon | 6.0% | 6.3%(-0.335)#56 | 6.9%(-0.913)#13,333 |
| 57. | Nashua | 5.9% | 6.3%(-0.392)#57 | 6.9%(-0.970)#13,464 |
| 58. | Hillsborough | 5.7% | 6.3%(-0.647)#58 | 6.9%(-1.23)#14,103 |
| 59. | Newport | 5.6% | 6.3%(-0.689)#59 | 6.9%(-1.27)#14,197 |
| 60. | Londonderry | 5.5% | 6.3%(-0.809)#60 | 6.9%(-1.39)#14,495 |
| 61. | Suissevale | 4.5% | 6.3%(-1.80)#61 | 6.9%(-2.38)#17,024 |
| 62. | Bradford | 4.3% | 6.3%(-2.05)#62 | 6.9%(-2.63)#17,640 |
| 63. | Hanover | 4.2% | 6.3%(-2.14)#63 | 6.9%(-2.72)#17,833 |
| 64. | Lancaster | 3.7% | 6.3%(-2.59)#64 | 6.9%(-3.17)#18,906 |
| 65. | Tilton Northfield | 3.6% | 6.3%(-2.72)#65 | 6.9%(-3.30)#19,223 |
| 66. | Wilton | 3.3% | 6.3%(-3.05)#66 | 6.9%(-3.63)#20,023 |
| 67. | Epping | 3.1% | 6.3%(-3.18)#67 | 6.9%(-3.76)#20,307 |
| 68. | Pittsfield | 3.0% | 6.3%(-3.29)#68 | 6.9%(-3.87)#20,558 |
| 69. | Newfields | 2.9% | 6.3%(-3.38)#69 | 6.9%(-3.96)#20,745 |
| 70. | Goffstown | 2.9% | 6.3%(-3.38)#70 | 6.9%(-3.96)#20,753 |
| 71. | East Merrimack | 2.9% | 6.3%(-3.44)#71 | 6.9%(-4.02)#20,882 |
| 72. | Sanbornville | 2.7% | 6.3%(-3.64)#72 | 6.9%(-4.21)#21,294 |
| 73. | North Haverhill | 2.6% | 6.3%(-3.66)#73 | 6.9%(-4.24)#21,365 |
| 74. | Hudson | 2.5% | 6.3%(-3.76)#74 | 6.9%(-4.34)#21,594 |
| 75. | Jaffrey | 2.3% | 6.3%(-4.03)#75 | 6.9%(-4.61)#22,155 |
| 76. | Peterborough | 1.9% | 6.3%(-4.40)#76 | 6.9%(-4.98)#22,837 |
| 77. | Antrim | 1.8% | 6.3%(-4.50)#77 | 6.9%(-5.07)#22,982 |
| 78. | Groveton | 1.8% | 6.3%(-4.53)#78 | 6.9%(-5.11)#23,036 |
| 79. | West Stewartstown | 1.7% | 6.3%(-4.61)#79 | 6.9%(-5.19)#23,161 |
| 80. | Enfield | 1.0% | 6.3%(-5.28)#80 | 6.9%(-5.86)#24,149 |
| 81. | Center Ossipee | 0.76% | 6.3%(-5.54)#81 | 6.9%(-6.12)#24,453 |
1
Common Questions
What are the Top 10 Cities with the Highest Percentage of Population Employed in Accommodation & Food Services in New Hampshire?
Top 10 Cities with the Highest Percentage of Population Employed in Accommodation & Food Services in New Hampshire are:
#1
36.8%
#2
26.3%
#3
21.5%
#4
19.1%
#5
18.9%
#6
18.8%
#7
18.4%
#8
18.3%
#9
18.2%
#10
17.2%
What city has the Highest Percentage of Population Employed in Accommodation & Food Services in New Hampshire?
Lincoln has the Highest Percentage of Population Employed in Accommodation & Food Services in New Hampshire with 36.8%.
What is the Percentage of Population Employed in Accommodation & Food Services in the State of New Hampshire?
Percentage of Population Employed in Accommodation & Food Services in New Hampshire is 6.3%.
What is the Percentage of Population Employed in Accommodation & Food Services in the United States?
Percentage of Population Employed in Accommodation & Food Services in the United States is 6.9%.