Zip Codes with the Highest Percentage of Population Employed in Accommodation & Food Services in San Bernardino, CA
RELATED REPORTS & OPTIONS
Accommodation & Food Services
San Bernardino
Compare Zip Codes
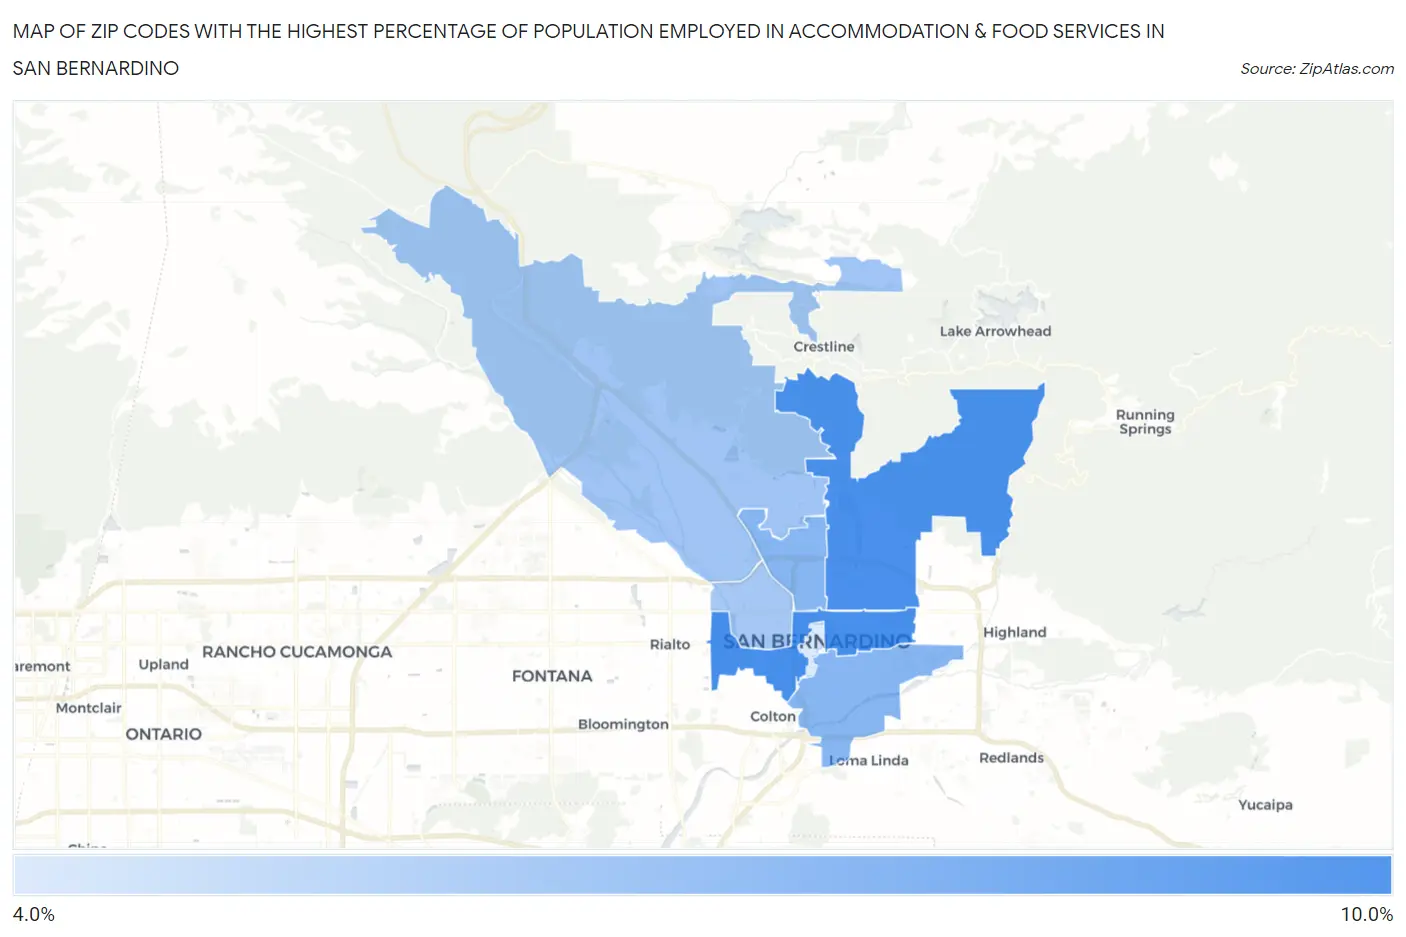
Map of Zip Codes with the Highest Percentage of Population Employed in Accommodation & Food Services in San Bernardino
4.7%
9.2%
Zip Codes with the Highest Percentage of Population Employed in Accommodation & Food Services in San Bernardino, CA
| Zip Code | % Employed | vs State | vs National | |
| 1. | 92410 | 9.2% | 7.2%(+2.02)#380 | 6.9%(+2.31)#5,664 |
| 2. | 92404 | 9.1% | 7.2%(+1.96)#388 | 6.9%(+2.25)#5,753 |
| 3. | 92405 | 7.3% | 7.2%(+0.099)#660 | 6.9%(+0.389)#9,616 |
| 4. | 92408 | 7.3% | 7.2%(+0.093)#663 | 6.9%(+0.383)#9,635 |
| 5. | 92407 | 6.5% | 7.2%(-0.676)#836 | 6.9%(-0.386)#11,866 |
| 6. | 92411 | 6.3% | 7.2%(-0.824)#866 | 6.9%(-0.535)#12,339 |
| 7. | 92401 | 4.7% | 7.2%(-2.45)#1,167 | 6.9%(-2.16)#17,747 |
1
Common Questions
What are the Top 5 Zip Codes with the Highest Percentage of Population Employed in Accommodation & Food Services in San Bernardino, CA?
Top 5 Zip Codes with the Highest Percentage of Population Employed in Accommodation & Food Services in San Bernardino, CA are:
What zip code has the Highest Percentage of Population Employed in Accommodation & Food Services in San Bernardino, CA?
92410 has the Highest Percentage of Population Employed in Accommodation & Food Services in San Bernardino, CA with 9.2%.
What is the Percentage of Population Employed in Accommodation & Food Services in San Bernardino, CA?
Percentage of Population Employed in Accommodation & Food Services in San Bernardino is 7.1%.
What is the Percentage of Population Employed in Accommodation & Food Services in California?
Percentage of Population Employed in Accommodation & Food Services in California is 7.2%.
What is the Percentage of Population Employed in Accommodation & Food Services in the United States?
Percentage of Population Employed in Accommodation & Food Services in the United States is 6.9%.