Cities with the Highest Percentage of Population Employed in Accommodation & Food Services in Nebraska
RELATED REPORTS & OPTIONS
Accommodation & Food Services
Nebraska
Compare Cities
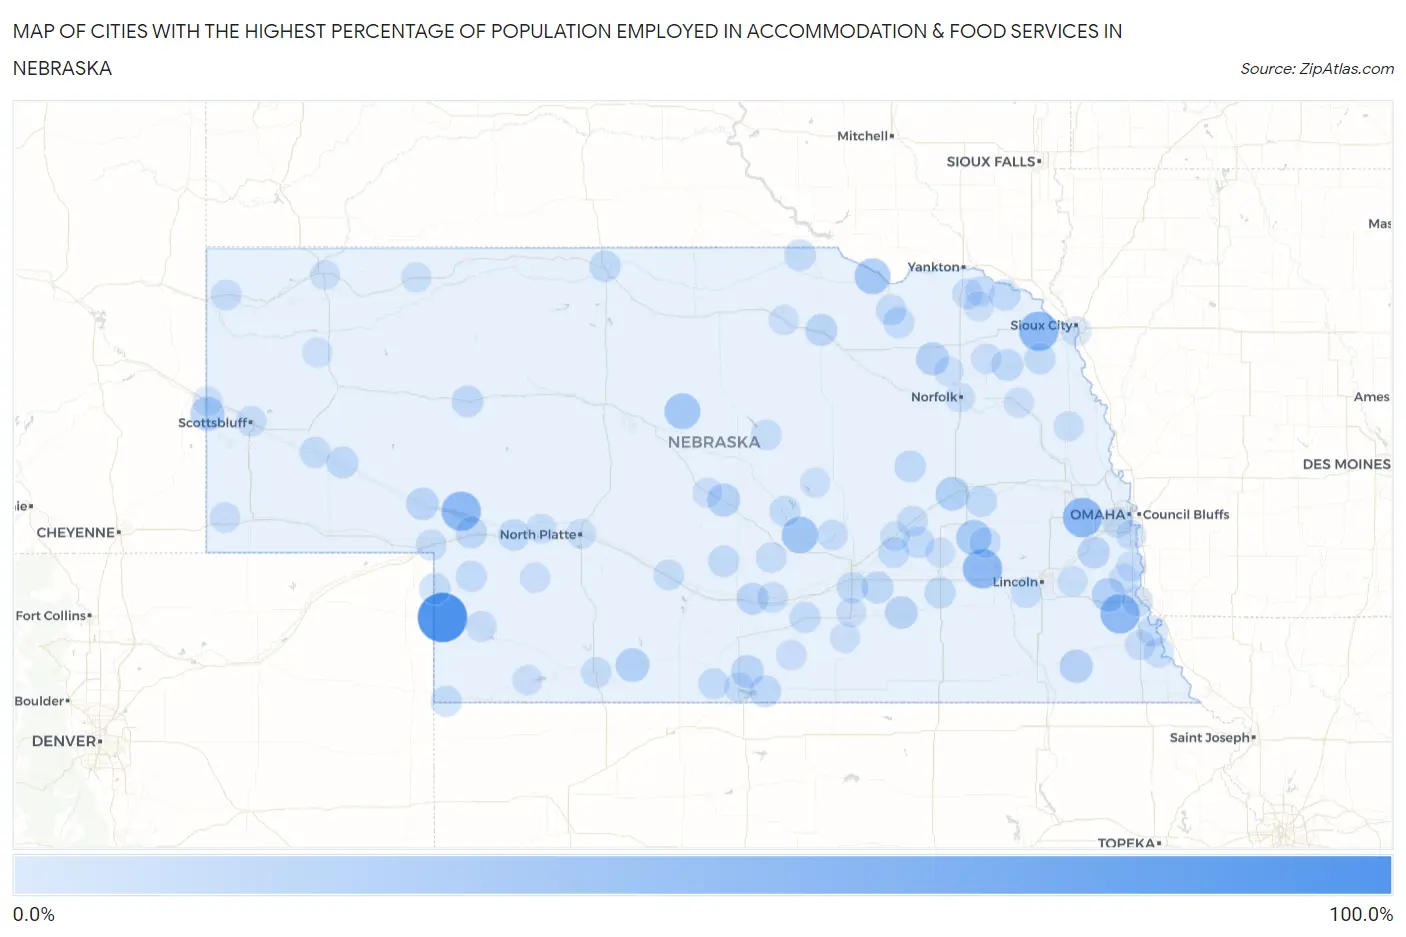
Map of Cities with the Highest Percentage of Population Employed in Accommodation & Food Services in Nebraska
0.0%
100.0%
Cities with the Highest Percentage of Population Employed in Accommodation & Food Services in Nebraska
| City | % Employed | vs State | vs National | |
| 1. | Lamar | 100.0% | 5.7%(+94.3)#1 | 6.9%(+93.1)#33 |
| 2. | Waterbury | 50.0% | 5.7%(+44.3)#2 | 6.9%(+43.1)#155 |
| 3. | Lorton | 50.0% | 5.7%(+44.3)#3 | 6.9%(+43.1)#156 |
| 4. | Lemoyne | 50.0% | 5.7%(+44.3)#4 | 6.9%(+43.1)#160 |
| 5. | Venice | 50.0% | 5.7%(+44.3)#5 | 6.9%(+43.1)#166 |
| 6. | Tamora | 50.0% | 5.7%(+44.3)#6 | 6.9%(+43.1)#169 |
| 7. | Rockville | 36.2% | 5.7%(+30.5)#7 | 6.9%(+29.3)#330 |
| 8. | Verdel | 33.3% | 5.7%(+27.6)#8 | 6.9%(+26.5)#389 |
| 9. | Brewster | 33.3% | 5.7%(+27.6)#9 | 6.9%(+26.5)#390 |
| 10. | Surprise | 30.8% | 5.7%(+25.1)#10 | 6.9%(+23.9)#462 |
| 11. | Lyman | 25.2% | 5.7%(+19.5)#11 | 6.9%(+18.3)#718 |
| 12. | Otoe | 25.0% | 5.7%(+19.3)#12 | 6.9%(+18.1)#728 |
| 13. | Duncan | 24.3% | 5.7%(+18.6)#13 | 6.9%(+17.4)#791 |
| 14. | Bartley | 23.6% | 5.7%(+17.9)#14 | 6.9%(+16.7)#850 |
| 15. | Lewiston | 21.4% | 5.7%(+15.7)#15 | 6.9%(+14.5)#1,067 |
| 16. | Foster | 21.4% | 5.7%(+15.7)#16 | 6.9%(+14.5)#1,068 |
| 17. | Berwyn | 20.8% | 5.7%(+15.1)#17 | 6.9%(+14.0)#1,140 |
| 18. | Saronville | 19.2% | 5.7%(+13.5)#18 | 6.9%(+12.3)#1,383 |
| 19. | Huntley | 18.8% | 5.7%(+13.1)#19 | 6.9%(+11.9)#1,467 |
| 20. | Lewellen | 18.3% | 5.7%(+12.6)#20 | 6.9%(+11.4)#1,551 |
| 21. | South Bend | 16.3% | 5.7%(+10.6)#21 | 6.9%(+9.45)#1,994 |
| 22. | O Neill | 16.2% | 5.7%(+10.5)#22 | 6.9%(+9.30)#2,036 |
| 23. | Odessa | 16.0% | 5.7%(+10.3)#23 | 6.9%(+9.12)#2,100 |
| 24. | Naponee | 15.6% | 5.7%(+9.90)#24 | 6.9%(+8.70)#2,245 |
| 25. | Giltner | 15.5% | 5.7%(+9.85)#25 | 6.9%(+8.66)#2,262 |
| 26. | Wayne | 15.2% | 5.7%(+9.51)#26 | 6.9%(+8.31)#2,359 |
| 27. | Broadwater | 15.2% | 5.7%(+9.46)#27 | 6.9%(+8.27)#2,379 |
| 28. | Ogallala | 14.8% | 5.7%(+9.10)#28 | 6.9%(+7.90)#2,526 |
| 29. | St Edward | 14.5% | 5.7%(+8.85)#29 | 6.9%(+7.66)#2,624 |
| 30. | Hyannis | 14.5% | 5.7%(+8.77)#30 | 6.9%(+7.58)#2,654 |
| 31. | Anoka | 14.3% | 5.7%(+8.60)#31 | 6.9%(+7.40)#2,745 |
| 32. | Obert | 14.3% | 5.7%(+8.60)#32 | 6.9%(+7.40)#2,747 |
| 33. | Doniphan | 13.9% | 5.7%(+8.19)#33 | 6.9%(+7.00)#2,907 |
| 34. | Paxton | 13.8% | 5.7%(+8.15)#34 | 6.9%(+6.96)#2,919 |
| 35. | Valentine | 13.8% | 5.7%(+8.10)#35 | 6.9%(+6.91)#2,948 |
| 36. | Mccool Junction | 13.7% | 5.7%(+8.06)#36 | 6.9%(+6.86)#2,973 |
| 37. | Bellwood | 13.6% | 5.7%(+7.91)#37 | 6.9%(+6.72)#3,062 |
| 38. | Venango | 13.3% | 5.7%(+7.65)#38 | 6.9%(+6.45)#3,199 |
| 39. | Sumner | 13.2% | 5.7%(+7.55)#39 | 6.9%(+6.35)#3,240 |
| 40. | Emerson | 12.7% | 5.7%(+7.06)#40 | 6.9%(+5.87)#3,514 |
| 41. | Polk | 12.6% | 5.7%(+6.94)#41 | 6.9%(+5.75)#3,590 |
| 42. | Grant | 12.6% | 5.7%(+6.90)#42 | 6.9%(+5.71)#3,620 |
| 43. | Heartwell | 12.3% | 5.7%(+6.59)#43 | 6.9%(+5.40)#3,827 |
| 44. | Loup City | 12.2% | 5.7%(+6.50)#44 | 6.9%(+5.31)#3,883 |
| 45. | Ulysses | 11.8% | 5.7%(+6.08)#45 | 6.9%(+4.88)#4,182 |
| 46. | Winnetoon | 11.8% | 5.7%(+6.08)#46 | 6.9%(+4.88)#4,191 |
| 47. | Verdigre | 11.6% | 5.7%(+5.87)#47 | 6.9%(+4.67)#4,324 |
| 48. | Marquette | 11.5% | 5.7%(+5.79)#48 | 6.9%(+4.59)#4,384 |
| 49. | Stamford | 11.4% | 5.7%(+5.74)#49 | 6.9%(+4.55)#4,430 |
| 50. | Haigler | 11.3% | 5.7%(+5.60)#50 | 6.9%(+4.41)#4,533 |
| 51. | Bridgeport | 11.2% | 5.7%(+5.55)#51 | 6.9%(+4.35)#4,577 |
| 52. | Denton | 11.2% | 5.7%(+5.55)#52 | 6.9%(+4.35)#4,582 |
| 53. | Peru | 11.1% | 5.7%(+5.45)#53 | 6.9%(+4.26)#4,656 |
| 54. | Cheney | 11.0% | 5.7%(+5.30)#54 | 6.9%(+4.11)#4,790 |
| 55. | Nebraska City | 11.0% | 5.7%(+5.27)#55 | 6.9%(+4.07)#4,817 |
| 56. | Clarks | 11.0% | 5.7%(+5.27)#56 | 6.9%(+4.07)#4,822 |
| 57. | Big Springs | 10.8% | 5.7%(+5.08)#57 | 6.9%(+3.88)#4,985 |
| 58. | Cozad | 10.6% | 5.7%(+4.94)#58 | 6.9%(+3.75)#5,093 |
| 59. | Mccook | 10.5% | 5.7%(+4.80)#59 | 6.9%(+3.60)#5,236 |
| 60. | Pleasanton | 10.5% | 5.7%(+4.77)#60 | 6.9%(+3.57)#5,264 |
| 61. | Imperial | 10.2% | 5.7%(+4.53)#61 | 6.9%(+3.34)#5,541 |
| 62. | Ralston | 10.2% | 5.7%(+4.48)#62 | 6.9%(+3.28)#5,609 |
| 63. | Dannebrog | 10.2% | 5.7%(+4.47)#63 | 6.9%(+3.28)#5,617 |
| 64. | Kearney | 10.1% | 5.7%(+4.45)#64 | 6.9%(+3.26)#5,636 |
| 65. | Burwell | 10.1% | 5.7%(+4.40)#65 | 6.9%(+3.21)#5,685 |
| 66. | Fordyce | 10.0% | 5.7%(+4.31)#66 | 6.9%(+3.12)#5,775 |
| 67. | Scottsbluff | 10.0% | 5.7%(+4.28)#67 | 6.9%(+3.09)#5,819 |
| 68. | Harrison | 9.9% | 5.7%(+4.20)#68 | 6.9%(+3.01)#5,900 |
| 69. | Upland | 9.6% | 5.7%(+3.90)#69 | 6.9%(+2.71)#6,277 |
| 70. | Bushnell | 9.4% | 5.7%(+3.69)#70 | 6.9%(+2.49)#6,549 |
| 71. | Nemaha | 9.1% | 5.7%(+3.40)#71 | 6.9%(+2.21)#6,966 |
| 72. | Auburn | 9.0% | 5.7%(+3.30)#72 | 6.9%(+2.11)#7,117 |
| 73. | Carroll | 8.7% | 5.7%(+2.97)#73 | 6.9%(+1.78)#7,603 |
| 74. | Eagle | 8.5% | 5.7%(+2.85)#74 | 6.9%(+1.66)#7,806 |
| 75. | Alma | 8.4% | 5.7%(+2.71)#75 | 6.9%(+1.52)#8,042 |
| 76. | Wallace | 8.4% | 5.7%(+2.71)#76 | 6.9%(+1.52)#8,048 |
| 77. | Oakland | 8.2% | 5.7%(+2.52)#77 | 6.9%(+1.32)#8,395 |
| 78. | Sutherland | 8.2% | 5.7%(+2.49)#78 | 6.9%(+1.30)#8,441 |
| 79. | Offutt Afb | 8.2% | 5.7%(+2.48)#79 | 6.9%(+1.28)#8,460 |
| 80. | Bow Valley | 8.2% | 5.7%(+2.48)#80 | 6.9%(+1.28)#8,468 |
| 81. | Atkinson | 8.1% | 5.7%(+2.37)#81 | 6.9%(+1.18)#8,653 |
| 82. | Broken Bow | 8.0% | 5.7%(+2.36)#82 | 6.9%(+1.16)#8,687 |
| 83. | Benedict | 7.9% | 5.7%(+2.18)#83 | 6.9%(+0.984)#8,993 |
| 84. | Scotia | 7.8% | 5.7%(+2.13)#84 | 6.9%(+0.940)#9,083 |
| 85. | Stratton | 7.8% | 5.7%(+2.11)#85 | 6.9%(+0.920)#9,116 |
| 86. | Nehawka | 7.8% | 5.7%(+2.08)#86 | 6.9%(+0.886)#9,183 |
| 87. | Wisner | 7.7% | 5.7%(+2.05)#87 | 6.9%(+0.860)#9,235 |
| 88. | Ayr | 7.7% | 5.7%(+2.01)#88 | 6.9%(+0.811)#9,346 |
| 89. | Henry | 7.7% | 5.7%(+2.01)#89 | 6.9%(+0.811)#9,354 |
| 90. | Hartington | 7.7% | 5.7%(+1.99)#90 | 6.9%(+0.801)#9,369 |
| 91. | Norfolk | 7.6% | 5.7%(+1.94)#91 | 6.9%(+0.751)#9,457 |
| 92. | Central City | 7.6% | 5.7%(+1.89)#92 | 6.9%(+0.696)#9,587 |
| 93. | Pierce | 7.5% | 5.7%(+1.85)#93 | 6.9%(+0.653)#9,674 |
| 94. | Gordon | 7.5% | 5.7%(+1.84)#94 | 6.9%(+0.650)#9,685 |
| 95. | Chadron | 7.5% | 5.7%(+1.84)#95 | 6.9%(+0.647)#9,692 |
| 96. | North Platte | 7.5% | 5.7%(+1.82)#96 | 6.9%(+0.628)#9,741 |
| 97. | Hemingford | 7.5% | 5.7%(+1.80)#97 | 6.9%(+0.602)#9,789 |
| 98. | Murray | 7.4% | 5.7%(+1.70)#98 | 6.9%(+0.508)#10,015 |
| 99. | South Sioux City | 7.4% | 5.7%(+1.69)#99 | 6.9%(+0.497)#10,034 |
| 100. | Hastings | 7.3% | 5.7%(+1.66)#100 | 6.9%(+0.467)#10,095 |
Common Questions
What are the Top 10 Cities with the Highest Percentage of Population Employed in Accommodation & Food Services in Nebraska?
Top 10 Cities with the Highest Percentage of Population Employed in Accommodation & Food Services in Nebraska are:
What city has the Highest Percentage of Population Employed in Accommodation & Food Services in Nebraska?
Lamar has the Highest Percentage of Population Employed in Accommodation & Food Services in Nebraska with 100.0%.
What is the Percentage of Population Employed in Accommodation & Food Services in the State of Nebraska?
Percentage of Population Employed in Accommodation & Food Services in Nebraska is 5.7%.
What is the Percentage of Population Employed in Accommodation & Food Services in the United States?
Percentage of Population Employed in Accommodation & Food Services in the United States is 6.9%.