Zip Codes with the Highest Percentage of Population Employed in Accommodation & Food Services in Santa Clarita, CA
RELATED REPORTS & OPTIONS
Accommodation & Food Services
Santa Clarita
Compare Zip Codes
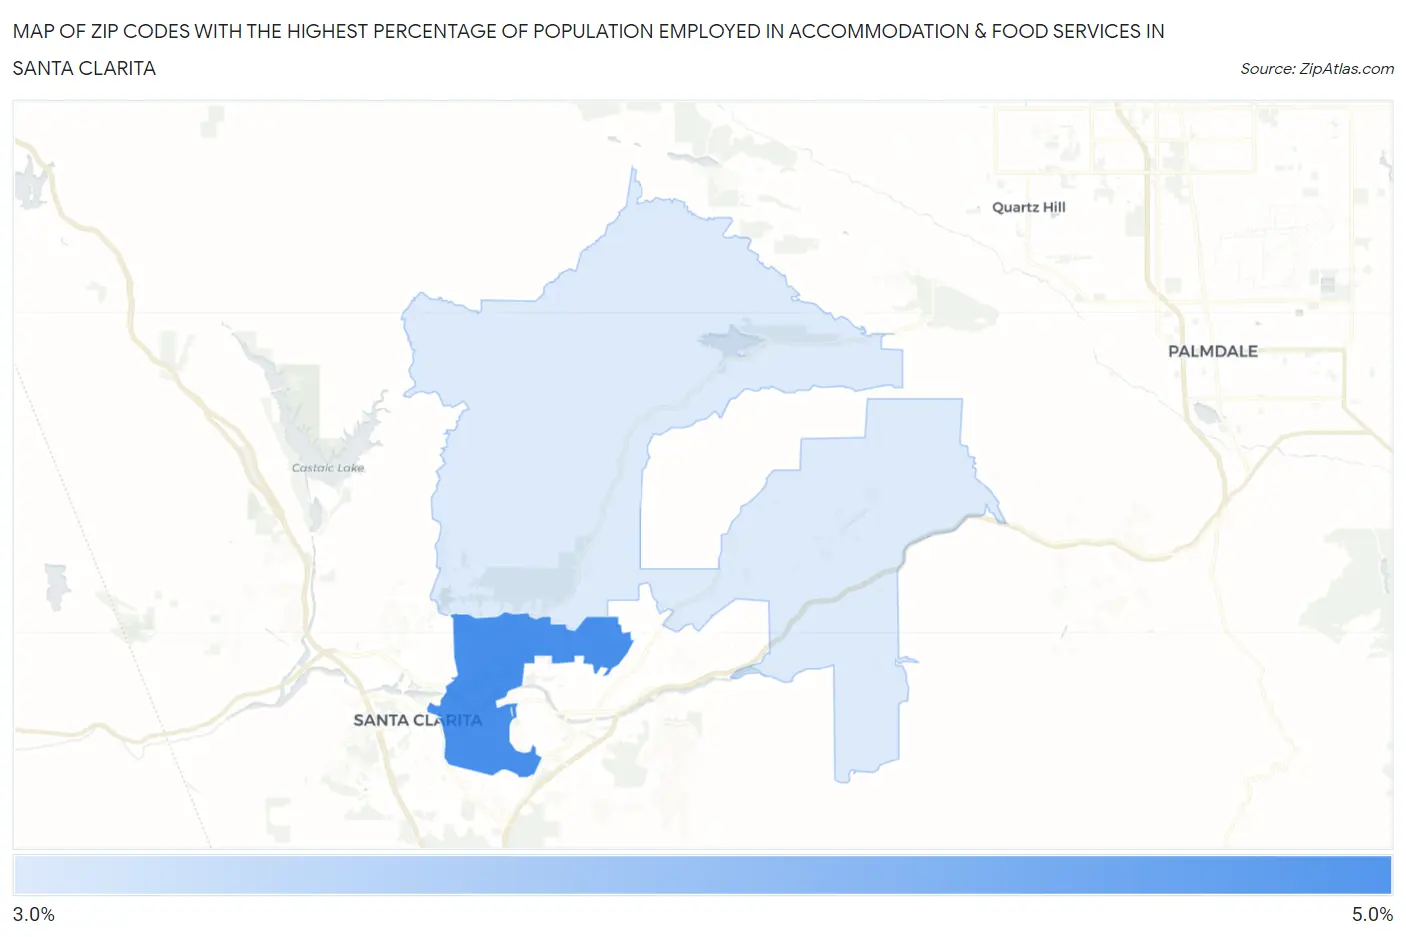
Map of Zip Codes with the Highest Percentage of Population Employed in Accommodation & Food Services in Santa Clarita
3.5%
4.1%
Zip Codes with the Highest Percentage of Population Employed in Accommodation & Food Services in Santa Clarita, CA
| Zip Code | % Employed | vs State | vs National | |
| 1. | 91350 | 4.1% | 7.2%(-3.11)#1,282 | 6.9%(-2.82)#19,964 |
| 2. | 91390 | 3.5% | 7.2%(-3.69)#1,354 | 6.9%(-3.40)#21,839 |
1
Common Questions
What are the Top Zip Codes with the Highest Percentage of Population Employed in Accommodation & Food Services in Santa Clarita, CA?
Top Zip Codes with the Highest Percentage of Population Employed in Accommodation & Food Services in Santa Clarita, CA are:
What zip code has the Highest Percentage of Population Employed in Accommodation & Food Services in Santa Clarita, CA?
91350 has the Highest Percentage of Population Employed in Accommodation & Food Services in Santa Clarita, CA with 4.1%.
What is the Percentage of Population Employed in Accommodation & Food Services in Santa Clarita, CA?
Percentage of Population Employed in Accommodation & Food Services in Santa Clarita is 6.1%.
What is the Percentage of Population Employed in Accommodation & Food Services in California?
Percentage of Population Employed in Accommodation & Food Services in California is 7.2%.
What is the Percentage of Population Employed in Accommodation & Food Services in the United States?
Percentage of Population Employed in Accommodation & Food Services in the United States is 6.9%.