Cities with the Highest Percentage of Population Employed in Accommodation & Food Services in Massachusetts
RELATED REPORTS & OPTIONS
Accommodation & Food Services
Massachusetts
Compare Cities
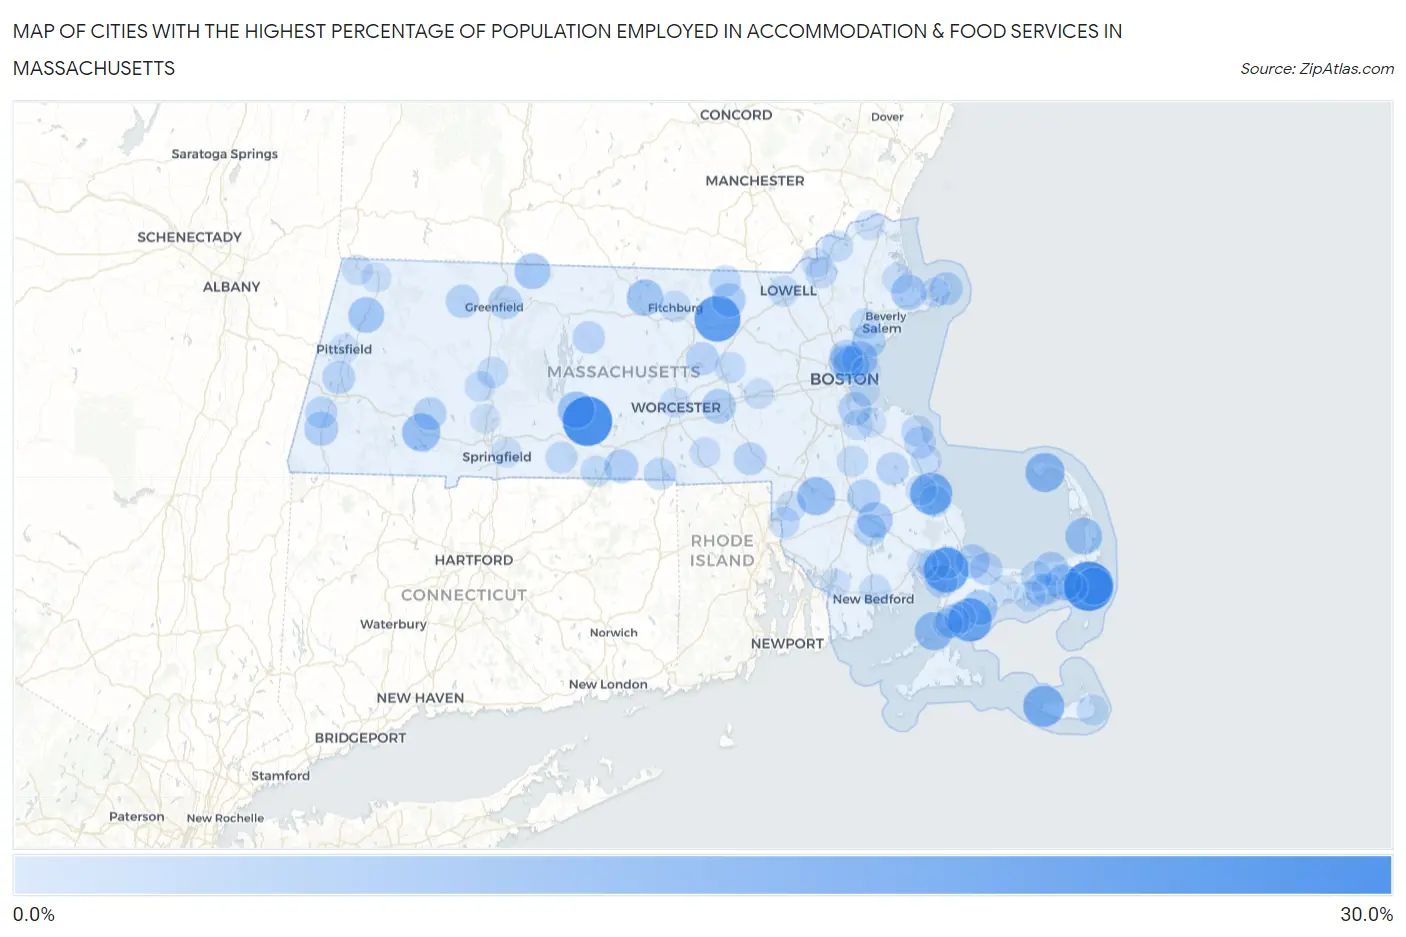
Map of Cities with the Highest Percentage of Population Employed in Accommodation & Food Services in Massachusetts
0.0%
30.0%
Cities with the Highest Percentage of Population Employed in Accommodation & Food Services in Massachusetts
| City | % Employed | vs State | vs National | |
| 1. | West Chatham | 26.5% | 5.8%(+20.7)#1 | 6.9%(+19.6)#640 |
| 2. | Warren | 26.4% | 5.8%(+20.6)#2 | 6.9%(+19.5)#646 |
| 3. | Devens | 22.7% | 5.8%(+17.0)#3 | 6.9%(+15.8)#934 |
| 4. | Bourne | 21.6% | 5.8%(+15.9)#4 | 6.9%(+14.7)#1,045 |
| 5. | Seconsett Island | 20.0% | 5.8%(+14.2)#5 | 6.9%(+13.1)#1,250 |
| 6. | North Plymouth | 18.7% | 5.8%(+12.9)#6 | 6.9%(+11.8)#1,472 |
| 7. | Madaket | 17.7% | 5.8%(+11.9)#7 | 6.9%(+10.8)#1,674 |
| 8. | Provincetown | 15.8% | 5.8%(+10.0)#8 | 6.9%(+8.90)#2,179 |
| 9. | Woods Hole | 14.7% | 5.8%(+8.94)#9 | 6.9%(+7.82)#2,556 |
| 10. | Blandford | 14.6% | 5.8%(+8.84)#10 | 6.9%(+7.73)#2,591 |
| 11. | Norton Center | 14.5% | 5.8%(+8.77)#11 | 6.9%(+7.65)#2,625 |
| 12. | Chatham | 13.8% | 5.8%(+8.02)#12 | 6.9%(+6.91)#2,952 |
| 13. | Ware | 13.4% | 5.8%(+7.63)#13 | 6.9%(+6.51)#3,168 |
| 14. | North Eastham | 13.3% | 5.8%(+7.50)#14 | 6.9%(+6.38)#3,231 |
| 15. | South Ashburnham | 12.9% | 5.8%(+7.10)#15 | 6.9%(+5.98)#3,447 |
| 16. | Chelsea | 12.6% | 5.8%(+6.80)#16 | 6.9%(+5.68)#3,633 |
| 17. | Cheshire | 12.3% | 5.8%(+6.53)#17 | 6.9%(+5.41)#3,819 |
| 18. | Northfield | 12.2% | 5.8%(+6.41)#18 | 6.9%(+5.30)#3,889 |
| 19. | Northwest Harwich | 12.0% | 5.8%(+6.26)#19 | 6.9%(+5.15)#3,983 |
| 20. | Middleborough Center | 11.9% | 5.8%(+6.12)#20 | 6.9%(+5.01)#4,093 |
| 21. | Essex | 11.8% | 5.8%(+6.02)#21 | 6.9%(+4.90)#4,163 |
| 22. | Revere | 11.6% | 5.8%(+5.88)#22 | 6.9%(+4.76)#4,268 |
| 23. | Mashpee Neck | 11.6% | 5.8%(+5.83)#23 | 6.9%(+4.72)#4,299 |
| 24. | Everett | 11.3% | 5.8%(+5.50)#24 | 6.9%(+4.38)#4,561 |
| 25. | Westborough | 10.8% | 5.8%(+5.08)#25 | 6.9%(+3.96)#4,920 |
| 26. | East Dennis | 10.6% | 5.8%(+4.80)#26 | 6.9%(+3.68)#5,160 |
| 27. | Groton | 10.5% | 5.8%(+4.76)#27 | 6.9%(+3.65)#5,188 |
| 28. | Sandwich | 10.5% | 5.8%(+4.73)#28 | 6.9%(+3.61)#5,224 |
| 29. | Teaticket | 10.5% | 5.8%(+4.70)#29 | 6.9%(+3.58)#5,257 |
| 30. | Great Barrington | 10.4% | 5.8%(+4.67)#30 | 6.9%(+3.55)#5,291 |
| 31. | Southbridge Town | 10.4% | 5.8%(+4.59)#31 | 6.9%(+3.47)#5,378 |
| 32. | Lynn | 10.2% | 5.8%(+4.41)#32 | 6.9%(+3.29)#5,604 |
| 33. | Bridgewater Town | 10.0% | 5.8%(+4.28)#33 | 6.9%(+3.17)#5,720 |
| 34. | Quincy | 9.8% | 5.8%(+4.02)#34 | 6.9%(+2.90)#6,028 |
| 35. | Turners Falls | 9.7% | 5.8%(+3.96)#35 | 6.9%(+2.84)#6,117 |
| 36. | Rockport | 9.7% | 5.8%(+3.93)#36 | 6.9%(+2.81)#6,143 |
| 37. | Shelburne Falls | 9.7% | 5.8%(+3.90)#37 | 6.9%(+2.78)#6,176 |
| 38. | Lenox | 9.6% | 5.8%(+3.82)#38 | 6.9%(+2.70)#6,284 |
| 39. | Amherst | 9.6% | 5.8%(+3.81)#39 | 6.9%(+2.69)#6,291 |
| 40. | Malden | 9.6% | 5.8%(+3.81)#40 | 6.9%(+2.69)#6,294 |
| 41. | Clinton | 9.5% | 5.8%(+3.76)#41 | 6.9%(+2.64)#6,360 |
| 42. | Huntington | 9.5% | 5.8%(+3.74)#42 | 6.9%(+2.62)#6,379 |
| 43. | Pocasset | 9.3% | 5.8%(+3.55)#43 | 6.9%(+2.43)#6,633 |
| 44. | Bellingham | 9.3% | 5.8%(+3.52)#44 | 6.9%(+2.40)#6,669 |
| 45. | South Yarmouth | 9.3% | 5.8%(+3.51)#45 | 6.9%(+2.39)#6,688 |
| 46. | Hanson | 9.1% | 5.8%(+3.32)#46 | 6.9%(+2.20)#6,983 |
| 47. | East Sandwich | 9.1% | 5.8%(+3.32)#47 | 6.9%(+2.20)#6,989 |
| 48. | Petersham | 9.0% | 5.8%(+3.20)#48 | 6.9%(+2.08)#7,157 |
| 49. | North Lakeville | 8.9% | 5.8%(+3.15)#49 | 6.9%(+2.03)#7,252 |
| 50. | Buzzards Bay | 8.8% | 5.8%(+3.03)#50 | 6.9%(+1.91)#7,418 |
| 51. | Webster | 8.8% | 5.8%(+3.01)#51 | 6.9%(+1.89)#7,454 |
| 52. | Housatonic | 8.4% | 5.8%(+2.68)#52 | 6.9%(+1.56)#7,963 |
| 53. | Marshfield Hills | 8.4% | 5.8%(+2.61)#53 | 6.9%(+1.50)#8,085 |
| 54. | Pepperell | 8.2% | 5.8%(+2.47)#54 | 6.9%(+1.35)#8,336 |
| 55. | Scituate | 8.2% | 5.8%(+2.43)#55 | 6.9%(+1.31)#8,418 |
| 56. | East Falmouth | 8.1% | 5.8%(+2.35)#56 | 6.9%(+1.23)#8,548 |
| 57. | Onset | 8.1% | 5.8%(+2.31)#57 | 6.9%(+1.19)#8,625 |
| 58. | Plymouth | 8.0% | 5.8%(+2.27)#58 | 6.9%(+1.15)#8,704 |
| 59. | Lawrence | 8.0% | 5.8%(+2.20)#59 | 6.9%(+1.08)#8,841 |
| 60. | North Seekonk | 7.9% | 5.8%(+2.18)#60 | 6.9%(+1.06)#8,869 |
| 61. | Monson Center | 7.9% | 5.8%(+2.17)#61 | 6.9%(+1.05)#8,883 |
| 62. | West Dennis | 7.9% | 5.8%(+2.16)#62 | 6.9%(+1.04)#8,914 |
| 63. | New Bedford | 7.9% | 5.8%(+2.11)#63 | 6.9%(+0.996)#8,974 |
| 64. | Holland | 7.8% | 5.8%(+2.08)#64 | 6.9%(+0.960)#9,052 |
| 65. | West Warren | 7.8% | 5.8%(+2.07)#65 | 6.9%(+0.947)#9,070 |
| 66. | Hatfield | 7.8% | 5.8%(+2.05)#66 | 6.9%(+0.936)#9,092 |
| 67. | Haverhill | 7.7% | 5.8%(+1.96)#67 | 6.9%(+0.844)#9,258 |
| 68. | West Yarmouth | 7.7% | 5.8%(+1.95)#68 | 6.9%(+0.835)#9,278 |
| 69. | Siasconset | 7.7% | 5.8%(+1.93)#69 | 6.9%(+0.811)#9,348 |
| 70. | Hudson | 7.7% | 5.8%(+1.89)#70 | 6.9%(+0.774)#9,417 |
| 71. | Brockton | 7.6% | 5.8%(+1.87)#71 | 6.9%(+0.755)#9,448 |
| 72. | Fitchburg | 7.6% | 5.8%(+1.84)#72 | 6.9%(+0.726)#9,517 |
| 73. | Yarmouth Port | 7.6% | 5.8%(+1.82)#73 | 6.9%(+0.704)#9,569 |
| 74. | Lowell | 7.6% | 5.8%(+1.80)#74 | 6.9%(+0.680)#9,626 |
| 75. | Kingston | 7.4% | 5.8%(+1.66)#75 | 6.9%(+0.537)#9,941 |
| 76. | Peabody | 7.4% | 5.8%(+1.64)#76 | 6.9%(+0.518)#9,998 |
| 77. | Northampton | 7.3% | 5.8%(+1.56)#77 | 6.9%(+0.439)#10,145 |
| 78. | Whitinsville | 7.2% | 5.8%(+1.43)#78 | 6.9%(+0.311)#10,387 |
| 79. | Ipswich | 7.2% | 5.8%(+1.40)#79 | 6.9%(+0.280)#10,450 |
| 80. | Attleboro | 7.1% | 5.8%(+1.37)#80 | 6.9%(+0.254)#10,528 |
| 81. | Marshfield | 7.1% | 5.8%(+1.36)#81 | 6.9%(+0.242)#10,543 |
| 82. | Braintree Town | 7.1% | 5.8%(+1.32)#82 | 6.9%(+0.196)#10,629 |
| 83. | Methuen Town | 7.0% | 5.8%(+1.27)#83 | 6.9%(+0.149)#10,735 |
| 84. | Falmouth | 7.0% | 5.8%(+1.22)#84 | 6.9%(+0.097)#10,841 |
| 85. | Framingham | 7.0% | 5.8%(+1.20)#85 | 6.9%(+0.080)#10,890 |
| 86. | Williamstown | 7.0% | 5.8%(+1.20)#86 | 6.9%(+0.079)#10,893 |
| 87. | Gloucester | 6.9% | 5.8%(+1.10)#87 | 6.9%(-0.018)#11,113 |
| 88. | Harwich Port | 6.8% | 5.8%(+1.03)#88 | 6.9%(-0.093)#11,310 |
| 89. | Fall River | 6.7% | 5.8%(+0.972)#89 | 6.9%(-0.146)#11,452 |
| 90. | Springfield | 6.7% | 5.8%(+0.930)#90 | 6.9%(-0.188)#11,530 |
| 91. | Worcester | 6.7% | 5.8%(+0.919)#91 | 6.9%(-0.199)#11,550 |
| 92. | Weymouth Town | 6.7% | 5.8%(+0.891)#92 | 6.9%(-0.228)#11,635 |
| 93. | Amesbury Town | 6.6% | 5.8%(+0.846)#93 | 6.9%(-0.273)#11,746 |
| 94. | North Adams | 6.6% | 5.8%(+0.830)#94 | 6.9%(-0.288)#11,790 |
| 95. | Wareham Center | 6.6% | 5.8%(+0.819)#95 | 6.9%(-0.300)#11,813 |
| 96. | Barnstable Town | 6.6% | 5.8%(+0.802)#96 | 6.9%(-0.317)#11,845 |
| 97. | Boston | 6.5% | 5.8%(+0.776)#97 | 6.9%(-0.343)#11,900 |
| 98. | Pittsfield | 6.4% | 5.8%(+0.688)#98 | 6.9%(-0.431)#12,130 |
| 99. | Holyoke | 6.4% | 5.8%(+0.679)#99 | 6.9%(-0.440)#12,144 |
| 100. | Winthrop Town | 6.4% | 5.8%(+0.662)#100 | 6.9%(-0.457)#12,185 |
Common Questions
What are the Top 10 Cities with the Highest Percentage of Population Employed in Accommodation & Food Services in Massachusetts?
Top 10 Cities with the Highest Percentage of Population Employed in Accommodation & Food Services in Massachusetts are:
#1
26.5%
#2
26.4%
#3
22.7%
#4
21.6%
#5
20.0%
#6
18.7%
#7
17.7%
#8
15.8%
#9
14.7%
#10
14.6%
What city has the Highest Percentage of Population Employed in Accommodation & Food Services in Massachusetts?
West Chatham has the Highest Percentage of Population Employed in Accommodation & Food Services in Massachusetts with 26.5%.
What is the Percentage of Population Employed in Accommodation & Food Services in the State of Massachusetts?
Percentage of Population Employed in Accommodation & Food Services in Massachusetts is 5.8%.
What is the Percentage of Population Employed in Accommodation & Food Services in the United States?
Percentage of Population Employed in Accommodation & Food Services in the United States is 6.9%.