Cities with the Highest Percentage of Population Employed in Accommodation & Food Services in Ohio
RELATED REPORTS & OPTIONS
Accommodation & Food Services
Ohio
Compare Cities
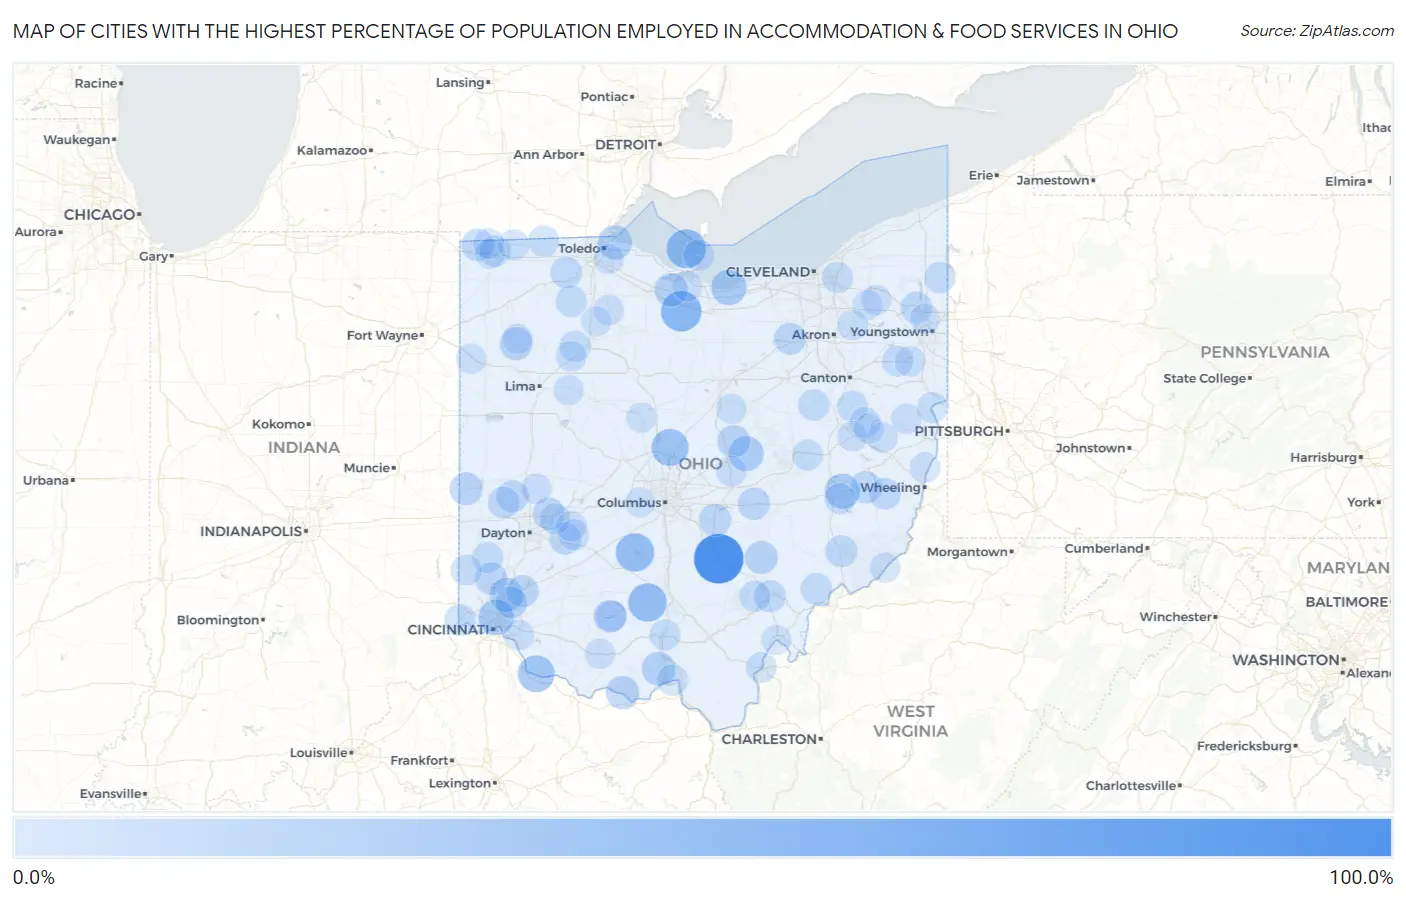
Map of Cities with the Highest Percentage of Population Employed in Accommodation & Food Services in Ohio
0.0%
100.0%
Cities with the Highest Percentage of Population Employed in Accommodation & Food Services in Ohio
| City | % Employed | vs State | vs National | |
| 1. | Rockbridge | 100.0% | 7.0%(+93.0)#1 | 6.9%(+93.1)#18 |
| 2. | Flat Rock | 59.4% | 7.0%(+52.4)#2 | 6.9%(+52.5)#95 |
| 3. | Put In Bay | 53.5% | 7.0%(+46.5)#3 | 6.9%(+46.6)#126 |
| 4. | Bourneville | 50.5% | 7.0%(+43.5)#4 | 6.9%(+43.6)#150 |
| 5. | Pancoastburg | 50.0% | 7.0%(+43.0)#5 | 6.9%(+43.1)#158 |
| 6. | Kilbourne | 44.4% | 7.0%(+37.4)#6 | 6.9%(+37.6)#220 |
| 7. | Chilo | 42.9% | 7.0%(+35.8)#7 | 6.9%(+36.0)#239 |
| 8. | West Logan | 40.3% | 7.0%(+33.2)#8 | 6.9%(+33.4)#262 |
| 9. | Elmwood Place | 37.5% | 7.0%(+30.5)#9 | 6.9%(+30.6)#304 |
| 10. | Beulah Beach | 36.8% | 7.0%(+29.8)#10 | 6.9%(+30.0)#317 |
| 11. | Old Washington | 36.0% | 7.0%(+29.0)#11 | 6.9%(+29.1)#331 |
| 12. | Bladensburg | 35.3% | 7.0%(+28.3)#12 | 6.9%(+28.4)#347 |
| 13. | Harbor View | 32.8% | 7.0%(+25.8)#13 | 6.9%(+25.9)#406 |
| 14. | Olde West Chester | 30.6% | 7.0%(+23.5)#14 | 6.9%(+23.7)#466 |
| 15. | Mcdermott | 30.2% | 7.0%(+23.2)#15 | 6.9%(+23.4)#476 |
| 16. | Vickery | 28.7% | 7.0%(+21.7)#16 | 6.9%(+21.8)#525 |
| 17. | Rome Stout | 28.6% | 7.0%(+21.6)#17 | 6.9%(+21.7)#541 |
| 18. | Hemlock | 27.5% | 7.0%(+20.5)#18 | 6.9%(+20.7)#587 |
| 19. | Palestine | 27.0% | 7.0%(+20.0)#19 | 6.9%(+20.2)#607 |
| 20. | Cloverdale | 26.8% | 7.0%(+19.8)#20 | 6.9%(+19.9)#627 |
| 21. | Rocky Fork Point | 26.4% | 7.0%(+19.4)#21 | 6.9%(+19.5)#647 |
| 22. | Gambier | 26.3% | 7.0%(+19.3)#22 | 6.9%(+19.4)#650 |
| 23. | New Haven Cdp Huron County | 25.2% | 7.0%(+18.2)#23 | 6.9%(+18.3)#717 |
| 24. | Thurston | 25.0% | 7.0%(+18.0)#24 | 6.9%(+18.1)#724 |
| 25. | Williamsdale | 24.7% | 7.0%(+17.7)#25 | 6.9%(+17.8)#763 |
| 26. | Newport Cdp Shelby County | 24.2% | 7.0%(+17.2)#26 | 6.9%(+17.3)#798 |
| 27. | Crystal Lakes | 24.1% | 7.0%(+17.1)#27 | 6.9%(+17.2)#806 |
| 28. | Lake Seneca | 23.9% | 7.0%(+16.8)#28 | 6.9%(+17.0)#829 |
| 29. | Gratiot | 23.8% | 7.0%(+16.8)#29 | 6.9%(+17.0)#831 |
| 30. | Ludlow Falls | 23.7% | 7.0%(+16.7)#30 | 6.9%(+16.9)#842 |
| 31. | Kings Mills | 23.5% | 7.0%(+16.5)#31 | 6.9%(+16.7)#854 |
| 32. | Gloria Glens Park | 23.3% | 7.0%(+16.3)#32 | 6.9%(+16.4)#878 |
| 33. | Brecon | 23.2% | 7.0%(+16.2)#33 | 6.9%(+16.3)#887 |
| 34. | Macksburg | 22.9% | 7.0%(+15.9)#34 | 6.9%(+16.0)#920 |
| 35. | Morgandale | 22.9% | 7.0%(+15.8)#35 | 6.9%(+16.0)#925 |
| 36. | Wilberforce | 22.6% | 7.0%(+15.6)#36 | 6.9%(+15.7)#945 |
| 37. | Potsdam | 22.3% | 7.0%(+15.3)#37 | 6.9%(+15.4)#970 |
| 38. | Athens | 22.2% | 7.0%(+15.2)#38 | 6.9%(+15.3)#973 |
| 39. | Fairview | 22.2% | 7.0%(+15.2)#39 | 6.9%(+15.3)#988 |
| 40. | Neapolis | 22.2% | 7.0%(+15.2)#40 | 6.9%(+15.3)#993 |
| 41. | Mount Hope | 22.1% | 7.0%(+15.1)#41 | 6.9%(+15.2)#1,000 |
| 42. | Bethesda | 21.6% | 7.0%(+14.6)#42 | 6.9%(+14.7)#1,046 |
| 43. | Elizabethtown | 21.0% | 7.0%(+14.0)#43 | 6.9%(+14.1)#1,120 |
| 44. | Winesburg | 21.0% | 7.0%(+13.9)#44 | 6.9%(+14.1)#1,126 |
| 45. | Vincent | 20.8% | 7.0%(+13.8)#45 | 6.9%(+13.9)#1,146 |
| 46. | West Elkton | 20.3% | 7.0%(+13.3)#46 | 6.9%(+13.5)#1,201 |
| 47. | Milton Center | 20.3% | 7.0%(+13.3)#47 | 6.9%(+13.4)#1,204 |
| 48. | Kinsman Center | 20.2% | 7.0%(+13.2)#48 | 6.9%(+13.4)#1,214 |
| 49. | New Marshfield | 20.0% | 7.0%(+13.0)#49 | 6.9%(+13.1)#1,245 |
| 50. | Bass Lake | 19.9% | 7.0%(+12.9)#50 | 6.9%(+13.0)#1,272 |
| 51. | New Boston | 19.6% | 7.0%(+12.6)#51 | 6.9%(+12.7)#1,308 |
| 52. | Kunkle | 19.5% | 7.0%(+12.5)#52 | 6.9%(+12.7)#1,324 |
| 53. | Woodmere | 19.5% | 7.0%(+12.5)#53 | 6.9%(+12.6)#1,327 |
| 54. | Wellsville | 19.4% | 7.0%(+12.4)#54 | 6.9%(+12.5)#1,347 |
| 55. | Benton Ridge | 19.3% | 7.0%(+12.3)#55 | 6.9%(+12.4)#1,373 |
| 56. | Kelleys Island | 19.3% | 7.0%(+12.3)#56 | 6.9%(+12.4)#1,374 |
| 57. | West Lafayette | 19.2% | 7.0%(+12.1)#57 | 6.9%(+12.3)#1,397 |
| 58. | Lyons | 19.0% | 7.0%(+12.0)#58 | 6.9%(+12.1)#1,415 |
| 59. | Piketon | 19.0% | 7.0%(+12.0)#59 | 6.9%(+12.1)#1,423 |
| 60. | Mineral City | 19.0% | 7.0%(+12.0)#60 | 6.9%(+12.1)#1,425 |
| 61. | Damascus | 18.9% | 7.0%(+11.9)#61 | 6.9%(+12.0)#1,434 |
| 62. | Lore City | 18.8% | 7.0%(+11.7)#62 | 6.9%(+11.9)#1,461 |
| 63. | New Springfield | 18.7% | 7.0%(+11.7)#63 | 6.9%(+11.8)#1,482 |
| 64. | Cedarville | 18.7% | 7.0%(+11.6)#64 | 6.9%(+11.8)#1,483 |
| 65. | Highland Holiday | 18.4% | 7.0%(+11.4)#65 | 6.9%(+11.6)#1,522 |
| 66. | Mount Cory | 18.3% | 7.0%(+11.3)#66 | 6.9%(+11.4)#1,566 |
| 67. | Fayette | 18.2% | 7.0%(+11.2)#67 | 6.9%(+11.3)#1,580 |
| 68. | Sherrodsville | 18.1% | 7.0%(+11.1)#68 | 6.9%(+11.2)#1,601 |
| 69. | Oxford | 18.1% | 7.0%(+11.1)#69 | 6.9%(+11.2)#1,604 |
| 70. | Kanauga | 17.6% | 7.0%(+10.6)#70 | 6.9%(+10.7)#1,697 |
| 71. | Holiday Valley | 17.4% | 7.0%(+10.4)#71 | 6.9%(+10.5)#1,734 |
| 72. | St Louisville | 17.2% | 7.0%(+10.1)#72 | 6.9%(+10.3)#1,798 |
| 73. | Connorville | 17.1% | 7.0%(+10.1)#73 | 6.9%(+10.2)#1,819 |
| 74. | Kent | 17.1% | 7.0%(+10.1)#74 | 6.9%(+10.2)#1,821 |
| 75. | West Millgrove | 16.9% | 7.0%(+9.91)#75 | 6.9%(+10.0)#1,850 |
| 76. | Salem | 16.9% | 7.0%(+9.86)#76 | 6.9%(+9.98)#1,862 |
| 77. | Casstown | 16.8% | 7.0%(+9.77)#77 | 6.9%(+9.89)#1,881 |
| 78. | Withamsville | 16.7% | 7.0%(+9.70)#78 | 6.9%(+9.83)#1,891 |
| 79. | Hiram | 16.7% | 7.0%(+9.69)#79 | 6.9%(+9.81)#1,896 |
| 80. | Scio | 16.6% | 7.0%(+9.55)#80 | 6.9%(+9.68)#1,938 |
| 81. | Bergholz | 16.5% | 7.0%(+9.51)#81 | 6.9%(+9.63)#1,948 |
| 82. | Clifton | 16.5% | 7.0%(+9.50)#82 | 6.9%(+9.62)#1,952 |
| 83. | Uhrichsville | 16.4% | 7.0%(+9.39)#83 | 6.9%(+9.51)#1,978 |
| 84. | Seaman | 16.3% | 7.0%(+9.33)#84 | 6.9%(+9.46)#1,989 |
| 85. | Pioneer | 16.1% | 7.0%(+9.13)#85 | 6.9%(+9.26)#2,052 |
| 86. | Dupont | 16.1% | 7.0%(+9.12)#86 | 6.9%(+9.25)#2,057 |
| 87. | Walbridge | 16.0% | 7.0%(+9.02)#87 | 6.9%(+9.15)#2,093 |
| 88. | Butler | 15.9% | 7.0%(+8.93)#88 | 6.9%(+9.06)#2,122 |
| 89. | Mckinley Heights | 15.9% | 7.0%(+8.93)#89 | 6.9%(+9.05)#2,123 |
| 90. | Alger | 15.9% | 7.0%(+8.91)#90 | 6.9%(+9.04)#2,130 |
| 91. | Matamoras | 15.9% | 7.0%(+8.88)#91 | 6.9%(+9.00)#2,142 |
| 92. | Green Camp | 15.9% | 7.0%(+8.85)#92 | 6.9%(+8.98)#2,153 |
| 93. | Castalia | 15.8% | 7.0%(+8.84)#93 | 6.9%(+8.97)#2,157 |
| 94. | Bairdstown | 15.8% | 7.0%(+8.78)#94 | 6.9%(+8.91)#2,172 |
| 95. | Lake Darby | 15.7% | 7.0%(+8.74)#95 | 6.9%(+8.87)#2,186 |
| 96. | Leesville | 15.6% | 7.0%(+8.62)#96 | 6.9%(+8.74)#2,222 |
| 97. | Convoy | 15.4% | 7.0%(+8.41)#97 | 6.9%(+8.54)#2,291 |
| 98. | Holiday City | 15.4% | 7.0%(+8.38)#98 | 6.9%(+8.50)#2,310 |
| 99. | Mantua | 15.3% | 7.0%(+8.28)#99 | 6.9%(+8.40)#2,338 |
| 100. | Pomeroy | 15.2% | 7.0%(+8.17)#100 | 6.9%(+8.29)#2,367 |
Common Questions
What are the Top 10 Cities with the Highest Percentage of Population Employed in Accommodation & Food Services in Ohio?
Top 10 Cities with the Highest Percentage of Population Employed in Accommodation & Food Services in Ohio are:
#1
100.0%
#2
59.4%
#3
53.5%
#4
50.5%
#5
50.0%
#6
44.4%
#7
42.9%
#8
37.5%
#9
36.8%
#10
36.0%
What city has the Highest Percentage of Population Employed in Accommodation & Food Services in Ohio?
Rockbridge has the Highest Percentage of Population Employed in Accommodation & Food Services in Ohio with 100.0%.
What is the Percentage of Population Employed in Accommodation & Food Services in the State of Ohio?
Percentage of Population Employed in Accommodation & Food Services in Ohio is 7.0%.
What is the Percentage of Population Employed in Accommodation & Food Services in the United States?
Percentage of Population Employed in Accommodation & Food Services in the United States is 6.9%.