Cities with the Highest Percentage of Population Employed in Accommodation & Food Services in Illinois
RELATED REPORTS & OPTIONS
Accommodation & Food Services
Illinois
Compare Cities
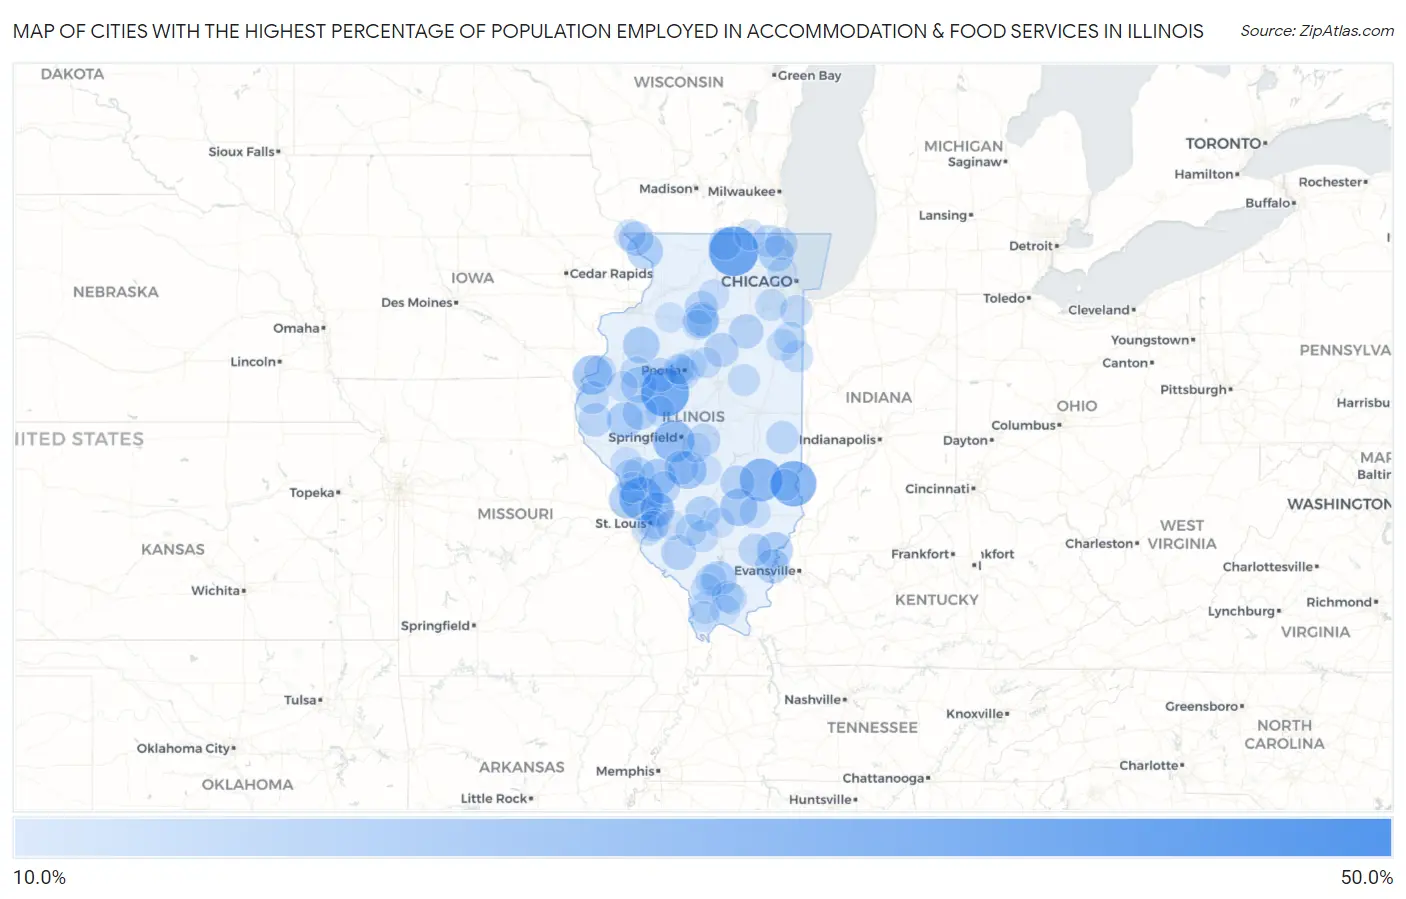
Map of Cities with the Highest Percentage of Population Employed in Accommodation & Food Services in Illinois
0.0%
50.0%
Cities with the Highest Percentage of Population Employed in Accommodation & Food Services in Illinois
| City | % Employed | vs State | vs National | |
| 1. | Serena | 43.9% | 6.5%(+37.4)#1 | 6.9%(+37.0)#228 |
| 2. | Solon Mills | 42.9% | 6.5%(+36.4)#2 | 6.9%(+36.0)#236 |
| 3. | Garden Prairie | 35.6% | 6.5%(+29.1)#3 | 6.9%(+28.7)#340 |
| 4. | Goofy Ridge | 34.0% | 6.5%(+27.5)#4 | 6.9%(+27.1)#369 |
| 5. | West York | 30.8% | 6.5%(+24.3)#5 | 6.9%(+23.9)#459 |
| 6. | Elsah | 28.1% | 6.5%(+21.7)#6 | 6.9%(+21.3)#556 |
| 7. | Jewett | 27.9% | 6.5%(+21.4)#7 | 6.9%(+21.0)#572 |
| 8. | Wilton Center | 26.4% | 6.5%(+19.9)#8 | 6.9%(+19.5)#648 |
| 9. | Curran | 26.1% | 6.5%(+19.7)#9 | 6.9%(+19.3)#663 |
| 10. | Custer Park | 25.6% | 6.5%(+19.1)#10 | 6.9%(+18.7)#698 |
| 11. | Dundas | 25.3% | 6.5%(+18.8)#11 | 6.9%(+18.4)#710 |
| 12. | Pontoosuc | 23.7% | 6.5%(+17.2)#12 | 6.9%(+16.8)#845 |
| 13. | Harvel | 22.2% | 6.5%(+15.8)#13 | 6.9%(+15.3)#978 |
| 14. | Iola | 21.4% | 6.5%(+15.0)#14 | 6.9%(+14.5)#1,066 |
| 15. | Chesterfield | 21.2% | 6.5%(+14.7)#15 | 6.9%(+14.3)#1,098 |
| 16. | Brussels | 21.0% | 6.5%(+14.5)#16 | 6.9%(+14.1)#1,125 |
| 17. | Henderson | 20.7% | 6.5%(+14.2)#17 | 6.9%(+13.8)#1,163 |
| 18. | Ophiem | 20.2% | 6.5%(+13.8)#18 | 6.9%(+13.3)#1,220 |
| 19. | Plum Valley | 20.2% | 6.5%(+13.7)#19 | 6.9%(+13.3)#1,221 |
| 20. | Hanover | 20.1% | 6.5%(+13.6)#20 | 6.9%(+13.2)#1,233 |
| 21. | Ripley | 20.0% | 6.5%(+13.5)#21 | 6.9%(+13.1)#1,255 |
| 22. | Hollowayville | 20.0% | 6.5%(+13.5)#22 | 6.9%(+13.1)#1,256 |
| 23. | Grayville | 19.8% | 6.5%(+13.3)#23 | 6.9%(+12.9)#1,277 |
| 24. | Marietta | 19.4% | 6.5%(+13.0)#24 | 6.9%(+12.6)#1,334 |
| 25. | Indian Creek | 19.4% | 6.5%(+12.9)#25 | 6.9%(+12.5)#1,352 |
| 26. | Freeman Spur | 19.3% | 6.5%(+12.8)#26 | 6.9%(+12.4)#1,368 |
| 27. | Keyesport | 18.9% | 6.5%(+12.5)#27 | 6.9%(+12.1)#1,428 |
| 28. | Tilden | 18.7% | 6.5%(+12.2)#28 | 6.9%(+11.8)#1,477 |
| 29. | Holcomb | 18.7% | 6.5%(+12.2)#29 | 6.9%(+11.8)#1,481 |
| 30. | Browning | 18.6% | 6.5%(+12.1)#30 | 6.9%(+11.7)#1,493 |
| 31. | Maunie | 18.4% | 6.5%(+11.9)#31 | 6.9%(+11.5)#1,538 |
| 32. | Verona | 18.2% | 6.5%(+11.7)#32 | 6.9%(+11.3)#1,586 |
| 33. | Dana | 18.2% | 6.5%(+11.7)#33 | 6.9%(+11.3)#1,589 |
| 34. | Hartford | 18.1% | 6.5%(+11.6)#34 | 6.9%(+11.2)#1,602 |
| 35. | Galena | 18.1% | 6.5%(+11.6)#35 | 6.9%(+11.2)#1,611 |
| 36. | Waggoner | 18.0% | 6.5%(+11.5)#36 | 6.9%(+11.1)#1,631 |
| 37. | South Roxana | 17.9% | 6.5%(+11.5)#37 | 6.9%(+11.1)#1,634 |
| 38. | Shumway | 17.9% | 6.5%(+11.5)#38 | 6.9%(+11.0)#1,637 |
| 39. | Norris | 17.5% | 6.5%(+11.0)#39 | 6.9%(+10.6)#1,710 |
| 40. | Coatsburg | 17.2% | 6.5%(+10.7)#40 | 6.9%(+10.3)#1,792 |
| 41. | La Moille | 17.1% | 6.5%(+10.6)#41 | 6.9%(+10.2)#1,811 |
| 42. | Campbell's Island | 16.8% | 6.5%(+10.4)#42 | 6.9%(+9.95)#1,870 |
| 43. | Basco | 16.7% | 6.5%(+10.2)#43 | 6.9%(+9.79)#1,913 |
| 44. | Mount Auburn | 16.5% | 6.5%(+10.1)#44 | 6.9%(+9.65)#1,946 |
| 45. | Hume | 16.5% | 6.5%(+10.1)#45 | 6.9%(+9.64)#1,947 |
| 46. | Candlewick Lake | 16.5% | 6.5%(+10.0)#46 | 6.9%(+9.63)#1,950 |
| 47. | Mill Shoals | 16.4% | 6.5%(+9.95)#47 | 6.9%(+9.54)#1,973 |
| 48. | Galt | 16.4% | 6.5%(+9.89)#48 | 6.9%(+9.48)#1,985 |
| 49. | Carrollton | 16.3% | 6.5%(+9.83)#49 | 6.9%(+9.41)#2,003 |
| 50. | Round Lake Heights | 16.2% | 6.5%(+9.77)#50 | 6.9%(+9.36)#2,021 |
| 51. | Park City | 16.2% | 6.5%(+9.76)#51 | 6.9%(+9.35)#2,024 |
| 52. | Royal Lakes | 16.0% | 6.5%(+9.53)#52 | 6.9%(+9.12)#2,098 |
| 53. | South Chicago Heights | 15.9% | 6.5%(+9.45)#53 | 6.9%(+9.04)#2,128 |
| 54. | Lomax | 15.7% | 6.5%(+9.24)#54 | 6.9%(+8.83)#2,194 |
| 55. | Smithville | 15.7% | 6.5%(+9.23)#55 | 6.9%(+8.82)#2,200 |
| 56. | Anchor | 15.6% | 6.5%(+9.16)#56 | 6.9%(+8.74)#2,223 |
| 57. | Fairmont | 15.6% | 6.5%(+9.14)#57 | 6.9%(+8.73)#2,231 |
| 58. | Hoyleton | 15.6% | 6.5%(+9.09)#58 | 6.9%(+8.67)#2,259 |
| 59. | Seatonville | 15.5% | 6.5%(+9.04)#59 | 6.9%(+8.63)#2,270 |
| 60. | Donovan | 15.5% | 6.5%(+9.03)#60 | 6.9%(+8.62)#2,271 |
| 61. | Avon | 15.5% | 6.5%(+9.00)#61 | 6.9%(+8.59)#2,282 |
| 62. | Anna | 15.4% | 6.5%(+8.93)#62 | 6.9%(+8.52)#2,294 |
| 63. | Sammons Point | 15.4% | 6.5%(+8.92)#63 | 6.9%(+8.50)#2,304 |
| 64. | Bush | 15.3% | 6.5%(+8.87)#64 | 6.9%(+8.46)#2,322 |
| 65. | Sun River Terrace | 15.2% | 6.5%(+8.68)#65 | 6.9%(+8.27)#2,374 |
| 66. | Creve Coeur | 15.1% | 6.5%(+8.67)#66 | 6.9%(+8.26)#2,384 |
| 67. | Bartelso | 15.0% | 6.5%(+8.56)#67 | 6.9%(+8.15)#2,432 |
| 68. | Annapolis | 15.0% | 6.5%(+8.53)#68 | 6.9%(+8.12)#2,450 |
| 69. | Ridgefield | 15.0% | 6.5%(+8.51)#69 | 6.9%(+8.10)#2,454 |
| 70. | Creal Springs | 14.9% | 6.5%(+8.47)#70 | 6.9%(+8.05)#2,472 |
| 71. | Sailor Springs | 14.9% | 6.5%(+8.42)#71 | 6.9%(+8.01)#2,488 |
| 72. | East Carondelet | 14.8% | 6.5%(+8.37)#72 | 6.9%(+7.96)#2,504 |
| 73. | Menominee | 14.8% | 6.5%(+8.35)#73 | 6.9%(+7.93)#2,515 |
| 74. | Cahokia Heights | 14.8% | 6.5%(+8.32)#74 | 6.9%(+7.91)#2,524 |
| 75. | Germantown Hills | 14.7% | 6.5%(+8.27)#75 | 6.9%(+7.86)#2,537 |
| 76. | New Burnside | 14.7% | 6.5%(+8.24)#76 | 6.9%(+7.82)#2,549 |
| 77. | Pearl | 14.7% | 6.5%(+8.24)#77 | 6.9%(+7.82)#2,552 |
| 78. | West Peoria | 14.7% | 6.5%(+8.23)#78 | 6.9%(+7.82)#2,554 |
| 79. | Eldred | 14.6% | 6.5%(+8.11)#79 | 6.9%(+7.70)#2,605 |
| 80. | Hebron | 14.5% | 6.5%(+8.08)#80 | 6.9%(+7.67)#2,618 |
| 81. | Fieldon | 14.4% | 6.5%(+7.97)#81 | 6.9%(+7.56)#2,659 |
| 82. | Compton | 14.4% | 6.5%(+7.94)#82 | 6.9%(+7.53)#2,671 |
| 83. | Carbondale | 14.3% | 6.5%(+7.85)#83 | 6.9%(+7.44)#2,705 |
| 84. | Norwood | 14.3% | 6.5%(+7.82)#84 | 6.9%(+7.40)#2,718 |
| 85. | Mill Creek | 14.3% | 6.5%(+7.82)#85 | 6.9%(+7.40)#2,742 |
| 86. | Roanoke | 14.3% | 6.5%(+7.79)#86 | 6.9%(+7.38)#2,758 |
| 87. | East St Louis | 14.2% | 6.5%(+7.73)#87 | 6.9%(+7.32)#2,774 |
| 88. | Sauget | 14.1% | 6.5%(+7.62)#88 | 6.9%(+7.20)#2,822 |
| 89. | Westlake | 14.0% | 6.5%(+7.54)#89 | 6.9%(+7.13)#2,849 |
| 90. | Macomb | 13.9% | 6.5%(+7.46)#90 | 6.9%(+7.05)#2,874 |
| 91. | Ohlman | 13.8% | 6.5%(+7.32)#91 | 6.9%(+6.91)#2,946 |
| 92. | Bureau Junction | 13.7% | 6.5%(+7.23)#92 | 6.9%(+6.82)#2,994 |
| 93. | Vienna | 13.6% | 6.5%(+7.14)#93 | 6.9%(+6.73)#3,055 |
| 94. | Lebanon | 13.6% | 6.5%(+7.11)#94 | 6.9%(+6.70)#3,074 |
| 95. | Lake Carroll | 13.6% | 6.5%(+7.11)#95 | 6.9%(+6.69)#3,076 |
| 96. | Mineral | 13.5% | 6.5%(+7.07)#96 | 6.9%(+6.66)#3,088 |
| 97. | Kilbourne | 13.5% | 6.5%(+7.04)#97 | 6.9%(+6.63)#3,109 |
| 98. | Rosemont | 13.5% | 6.5%(+7.03)#98 | 6.9%(+6.61)#3,120 |
| 99. | Salem | 13.5% | 6.5%(+6.99)#99 | 6.9%(+6.58)#3,136 |
| 100. | Edinburg | 13.4% | 6.5%(+6.93)#100 | 6.9%(+6.52)#3,164 |
Common Questions
What are the Top 10 Cities with the Highest Percentage of Population Employed in Accommodation & Food Services in Illinois?
Top 10 Cities with the Highest Percentage of Population Employed in Accommodation & Food Services in Illinois are:
#1
35.6%
#2
34.0%
#3
30.8%
#4
28.1%
#5
27.9%
#6
26.1%
#7
23.7%
#8
22.2%
#9
21.4%
#10
21.2%
What city has the Highest Percentage of Population Employed in Accommodation & Food Services in Illinois?
Garden Prairie has the Highest Percentage of Population Employed in Accommodation & Food Services in Illinois with 35.6%.
What is the Percentage of Population Employed in Accommodation & Food Services in the State of Illinois?
Percentage of Population Employed in Accommodation & Food Services in Illinois is 6.5%.
What is the Percentage of Population Employed in Accommodation & Food Services in the United States?
Percentage of Population Employed in Accommodation & Food Services in the United States is 6.9%.