Cities with the Highest Percentage of Population Employed in Accommodation & Food Services in South Dakota
RELATED REPORTS & OPTIONS
Accommodation & Food Services
South Dakota
Compare Cities
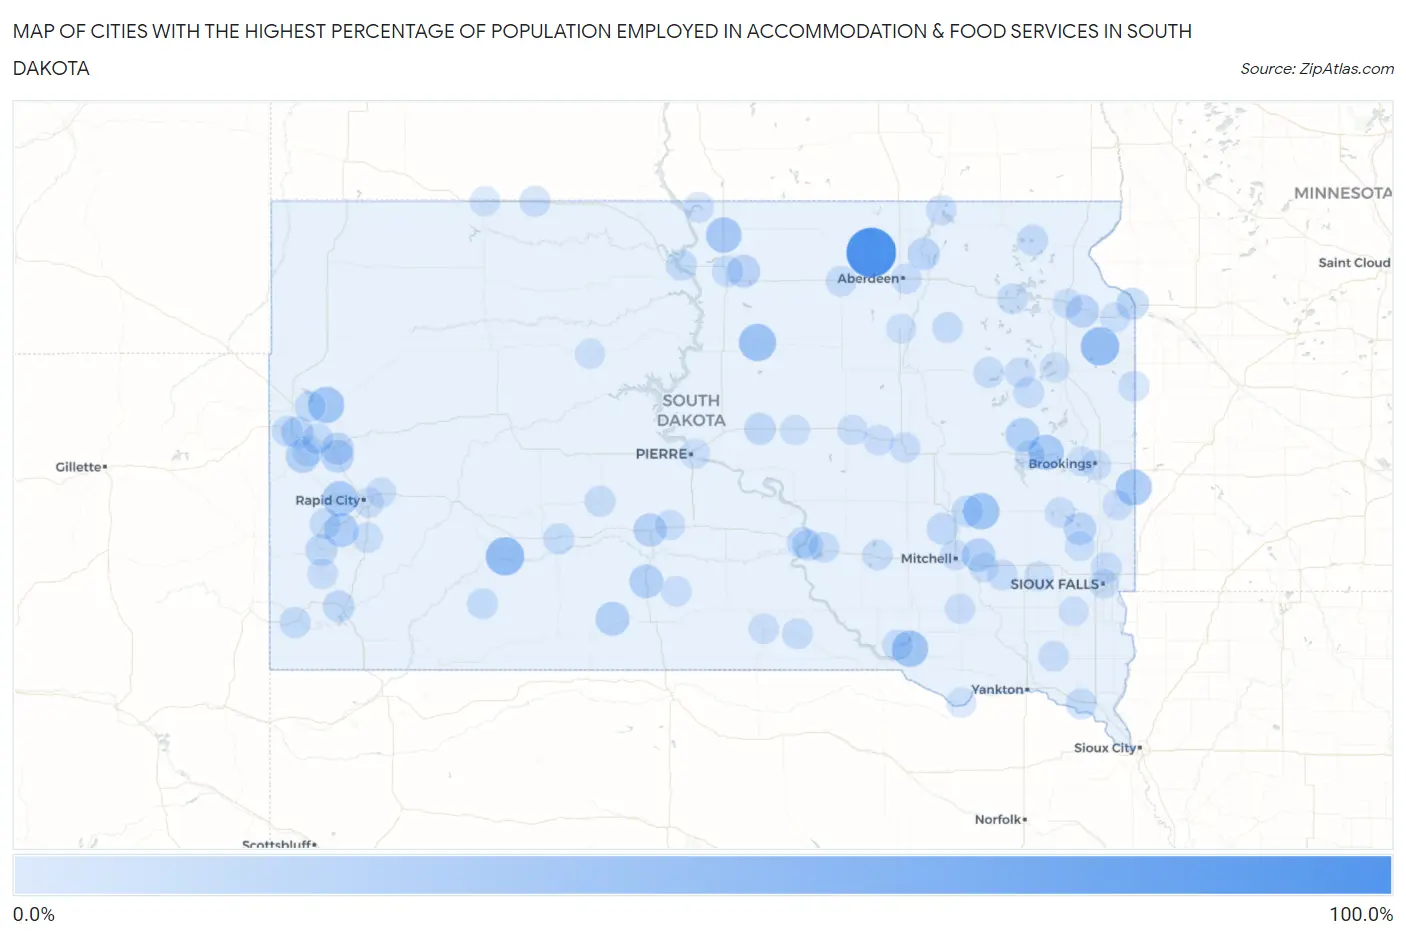
Map of Cities with the Highest Percentage of Population Employed in Accommodation & Food Services in South Dakota
0.0%
100.0%
Cities with the Highest Percentage of Population Employed in Accommodation & Food Services in South Dakota
| City | % Employed | vs State | vs National | |
| 1. | Wetonka | 100.0% | 6.8%(+93.2)#1 | 6.9%(+93.1)#31 |
| 2. | Horse Creek | 57.1% | 6.8%(+50.3)#2 | 6.9%(+50.3)#106 |
| 3. | Interior | 45.8% | 6.8%(+39.0)#3 | 6.9%(+39.0)#203 |
| 4. | Strandburg | 45.7% | 6.8%(+38.9)#4 | 6.9%(+38.8)#206 |
| 5. | Lebanon | 40.4% | 6.8%(+33.6)#5 | 6.9%(+33.5)#260 |
| 6. | Ravinia | 36.4% | 6.8%(+29.5)#6 | 6.9%(+29.5)#325 |
| 7. | Fedora | 36.4% | 6.8%(+29.5)#7 | 6.9%(+29.5)#326 |
| 8. | Nisland | 35.7% | 6.8%(+28.9)#8 | 6.9%(+28.8)#337 |
| 9. | Ward | 35.0% | 6.8%(+28.2)#9 | 6.9%(+28.1)#354 |
| 10. | Mound City | 31.6% | 6.8%(+24.7)#10 | 6.9%(+24.7)#431 |
| 11. | Hetland | 31.2% | 6.8%(+24.4)#11 | 6.9%(+24.4)#446 |
| 12. | Johnson Siding | 30.3% | 6.8%(+23.5)#12 | 6.9%(+23.4)#474 |
| 13. | Golden View Colony | 26.9% | 6.8%(+20.1)#13 | 6.9%(+20.0)#617 |
| 14. | Keystone | 26.5% | 6.8%(+19.7)#14 | 6.9%(+19.6)#639 |
| 15. | Parmelee | 25.0% | 6.8%(+18.2)#15 | 6.9%(+18.1)#725 |
| 16. | Erwin | 25.0% | 6.8%(+18.2)#16 | 6.9%(+18.1)#741 |
| 17. | White River | 24.5% | 6.8%(+17.7)#17 | 6.9%(+17.7)#769 |
| 18. | Fulton | 22.5% | 6.8%(+15.7)#18 | 6.9%(+15.6)#953 |
| 19. | Lead | 22.1% | 6.8%(+15.3)#19 | 6.9%(+15.3)#994 |
| 20. | Murdo | 21.8% | 6.8%(+14.9)#20 | 6.9%(+14.9)#1,033 |
| 21. | Java | 20.2% | 6.8%(+13.4)#21 | 6.9%(+13.4)#1,219 |
| 22. | Marvin | 20.0% | 6.8%(+13.2)#22 | 6.9%(+13.1)#1,259 |
| 23. | Blucksberg Mountain | 19.5% | 6.8%(+12.6)#23 | 6.9%(+12.6)#1,329 |
| 24. | Chester | 19.0% | 6.8%(+12.2)#24 | 6.9%(+12.2)#1,411 |
| 25. | Sturgis | 18.5% | 6.8%(+11.7)#25 | 6.9%(+11.6)#1,508 |
| 26. | Columbia | 17.5% | 6.8%(+10.7)#26 | 6.9%(+10.6)#1,706 |
| 27. | Big Stone City | 17.5% | 6.8%(+10.6)#27 | 6.9%(+10.6)#1,717 |
| 28. | Spearfish | 17.4% | 6.8%(+10.6)#28 | 6.9%(+10.6)#1,727 |
| 29. | Stephan | 17.1% | 6.8%(+10.3)#29 | 6.9%(+10.3)#1,803 |
| 30. | Custer | 15.8% | 6.8%(+8.95)#30 | 6.9%(+8.90)#2,177 |
| 31. | Letcher | 15.1% | 6.8%(+8.28)#31 | 6.9%(+8.24)#2,394 |
| 32. | Harrold | 15.1% | 6.8%(+8.26)#32 | 6.9%(+8.21)#2,404 |
| 33. | Hot Springs | 15.0% | 6.8%(+8.14)#33 | 6.9%(+8.09)#2,455 |
| 34. | Artesian | 14.4% | 6.8%(+7.59)#34 | 6.9%(+7.54)#2,667 |
| 35. | Oacoma | 13.5% | 6.8%(+6.69)#35 | 6.9%(+6.65)#3,097 |
| 36. | Mountain Plains | 13.4% | 6.8%(+6.58)#36 | 6.9%(+6.53)#3,156 |
| 37. | Selby | 12.9% | 6.8%(+6.03)#37 | 6.9%(+5.98)#3,450 |
| 38. | Deadwood | 12.8% | 6.8%(+5.97)#38 | 6.9%(+5.93)#3,482 |
| 39. | Vermillion | 12.7% | 6.8%(+5.82)#39 | 6.9%(+5.78)#3,576 |
| 40. | Whitewood | 12.6% | 6.8%(+5.74)#40 | 6.9%(+5.69)#3,630 |
| 41. | Clear Lake | 12.5% | 6.8%(+5.67)#41 | 6.9%(+5.62)#3,686 |
| 42. | Hill City | 12.3% | 6.8%(+5.50)#42 | 6.9%(+5.45)#3,789 |
| 43. | Mobridge | 12.3% | 6.8%(+5.46)#43 | 6.9%(+5.41)#3,820 |
| 44. | Fruitdale | 12.2% | 6.8%(+5.36)#44 | 6.9%(+5.31)#3,880 |
| 45. | Chamberlain | 12.0% | 6.8%(+5.16)#45 | 6.9%(+5.12)#4,018 |
| 46. | Edgemont | 12.0% | 6.8%(+5.13)#46 | 6.9%(+5.08)#4,034 |
| 47. | North Spearfish | 11.8% | 6.8%(+4.96)#47 | 6.9%(+4.92)#4,152 |
| 48. | Kadoka | 11.6% | 6.8%(+4.81)#48 | 6.9%(+4.76)#4,267 |
| 49. | Kyle | 11.6% | 6.8%(+4.76)#49 | 6.9%(+4.71)#4,308 |
| 50. | Lake Andes | 11.3% | 6.8%(+4.50)#50 | 6.9%(+4.45)#4,492 |
| 51. | Hazel | 11.3% | 6.8%(+4.46)#51 | 6.9%(+4.41)#4,534 |
| 52. | Midland | 11.3% | 6.8%(+4.44)#52 | 6.9%(+4.39)#4,557 |
| 53. | Clark | 11.1% | 6.8%(+4.24)#53 | 6.9%(+4.19)#4,723 |
| 54. | Pukwana | 11.0% | 6.8%(+4.16)#54 | 6.9%(+4.11)#4,789 |
| 55. | Morristown | 10.8% | 6.8%(+3.98)#55 | 6.9%(+3.93)#4,941 |
| 56. | Gary | 10.8% | 6.8%(+3.92)#56 | 6.9%(+3.87)#5,000 |
| 57. | White Lake | 10.7% | 6.8%(+3.90)#57 | 6.9%(+3.85)#5,014 |
| 58. | Webster | 10.7% | 6.8%(+3.87)#58 | 6.9%(+3.82)#5,043 |
| 59. | Emery | 10.5% | 6.8%(+3.71)#59 | 6.9%(+3.66)#5,175 |
| 60. | Aberdeen | 10.5% | 6.8%(+3.68)#60 | 6.9%(+3.63)#5,210 |
| 61. | Ipswich | 10.3% | 6.8%(+3.45)#61 | 6.9%(+3.40)#5,474 |
| 62. | Renner Corner | 10.2% | 6.8%(+3.36)#62 | 6.9%(+3.31)#5,565 |
| 63. | Irene | 10.1% | 6.8%(+3.24)#63 | 6.9%(+3.19)#5,698 |
| 64. | Gregory | 10.0% | 6.8%(+3.17)#64 | 6.9%(+3.12)#5,768 |
| 65. | Conde | 10.0% | 6.8%(+3.17)#65 | 6.9%(+3.12)#5,785 |
| 66. | Pringle | 9.7% | 6.8%(+2.85)#66 | 6.9%(+2.80)#6,164 |
| 67. | Colome | 9.6% | 6.8%(+2.75)#67 | 6.9%(+2.70)#6,281 |
| 68. | Wood | 9.5% | 6.8%(+2.69)#68 | 6.9%(+2.64)#6,354 |
| 69. | Wolsey | 9.5% | 6.8%(+2.62)#69 | 6.9%(+2.57)#6,445 |
| 70. | Henry | 9.4% | 6.8%(+2.54)#70 | 6.9%(+2.49)#6,546 |
| 71. | Wessington | 9.2% | 6.8%(+2.34)#71 | 6.9%(+2.29)#6,824 |
| 72. | Pollock | 9.2% | 6.8%(+2.32)#72 | 6.9%(+2.27)#6,854 |
| 73. | Hermosa | 9.0% | 6.8%(+2.21)#73 | 6.9%(+2.16)#7,035 |
| 74. | Madison | 9.0% | 6.8%(+2.12)#74 | 6.9%(+2.07)#7,176 |
| 75. | Rapid City | 8.9% | 6.8%(+2.11)#75 | 6.9%(+2.06)#7,195 |
| 76. | Parkston | 8.9% | 6.8%(+2.05)#76 | 6.9%(+2.00)#7,290 |
| 77. | Mitchell | 8.8% | 6.8%(+1.98)#77 | 6.9%(+1.93)#7,392 |
| 78. | St Lawrence | 8.8% | 6.8%(+1.94)#78 | 6.9%(+1.89)#7,446 |
| 79. | Prairiewood | 8.7% | 6.8%(+1.91)#79 | 6.9%(+1.86)#7,491 |
| 80. | Flandreau | 8.7% | 6.8%(+1.86)#80 | 6.9%(+1.81)#7,534 |
| 81. | Hecla | 8.7% | 6.8%(+1.86)#81 | 6.9%(+1.81)#7,543 |
| 82. | Brookings | 8.5% | 6.8%(+1.69)#82 | 6.9%(+1.65)#7,825 |
| 83. | Draper | 8.3% | 6.8%(+1.50)#83 | 6.9%(+1.45)#8,189 |
| 84. | Highmore | 8.3% | 6.8%(+1.44)#84 | 6.9%(+1.39)#8,278 |
| 85. | Box Elder | 8.2% | 6.8%(+1.32)#85 | 6.9%(+1.27)#8,476 |
| 86. | Eagle Butte | 8.1% | 6.8%(+1.31)#86 | 6.9%(+1.26)#8,499 |
| 87. | Pierre | 8.1% | 6.8%(+1.26)#87 | 6.9%(+1.21)#8,591 |
| 88. | Milbank | 8.1% | 6.8%(+1.25)#88 | 6.9%(+1.20)#8,610 |
| 89. | Lemmon | 8.0% | 6.8%(+1.20)#89 | 6.9%(+1.15)#8,697 |
| 90. | Summit | 8.0% | 6.8%(+1.19)#90 | 6.9%(+1.14)#8,711 |
| 91. | Running Water | 8.0% | 6.8%(+1.17)#91 | 6.9%(+1.12)#8,758 |
| 92. | Watertown | 8.0% | 6.8%(+1.14)#92 | 6.9%(+1.09)#8,813 |
| 93. | Volga | 7.8% | 6.8%(+0.933)#93 | 6.9%(+0.884)#9,186 |
| 94. | Canistota | 7.7% | 6.8%(+0.904)#94 | 6.9%(+0.855)#9,243 |
| 95. | Colton | 7.6% | 6.8%(+0.804)#95 | 6.9%(+0.755)#9,451 |
| 96. | Mellette | 7.6% | 6.8%(+0.763)#96 | 6.9%(+0.714)#9,544 |
| 97. | Chancellor | 7.6% | 6.8%(+0.754)#97 | 6.9%(+0.705)#9,564 |
| 98. | Alexandria | 7.6% | 6.8%(+0.727)#98 | 6.9%(+0.678)#9,627 |
| 99. | Sioux Falls | 7.5% | 6.8%(+0.697)#99 | 6.9%(+0.648)#9,689 |
| 100. | Lake Preston | 7.5% | 6.8%(+0.678)#100 | 6.9%(+0.629)#9,739 |
Common Questions
What are the Top 10 Cities with the Highest Percentage of Population Employed in Accommodation & Food Services in South Dakota?
Top 10 Cities with the Highest Percentage of Population Employed in Accommodation & Food Services in South Dakota are:
#1
100.0%
#2
45.8%
#3
45.7%
#4
40.4%
#5
36.4%
#6
36.4%
#7
35.7%
#8
35.0%
#9
31.6%
#10
31.2%
What city has the Highest Percentage of Population Employed in Accommodation & Food Services in South Dakota?
Wetonka has the Highest Percentage of Population Employed in Accommodation & Food Services in South Dakota with 100.0%.
What is the Percentage of Population Employed in Accommodation & Food Services in the State of South Dakota?
Percentage of Population Employed in Accommodation & Food Services in South Dakota is 6.8%.
What is the Percentage of Population Employed in Accommodation & Food Services in the United States?
Percentage of Population Employed in Accommodation & Food Services in the United States is 6.9%.