Zip Codes with the Highest Percentage of Population Employed in Accommodation & Food Services in Desert Hot Springs, CA
RELATED REPORTS & OPTIONS
Accommodation & Food Services
Desert Hot Springs
Compare Zip Codes
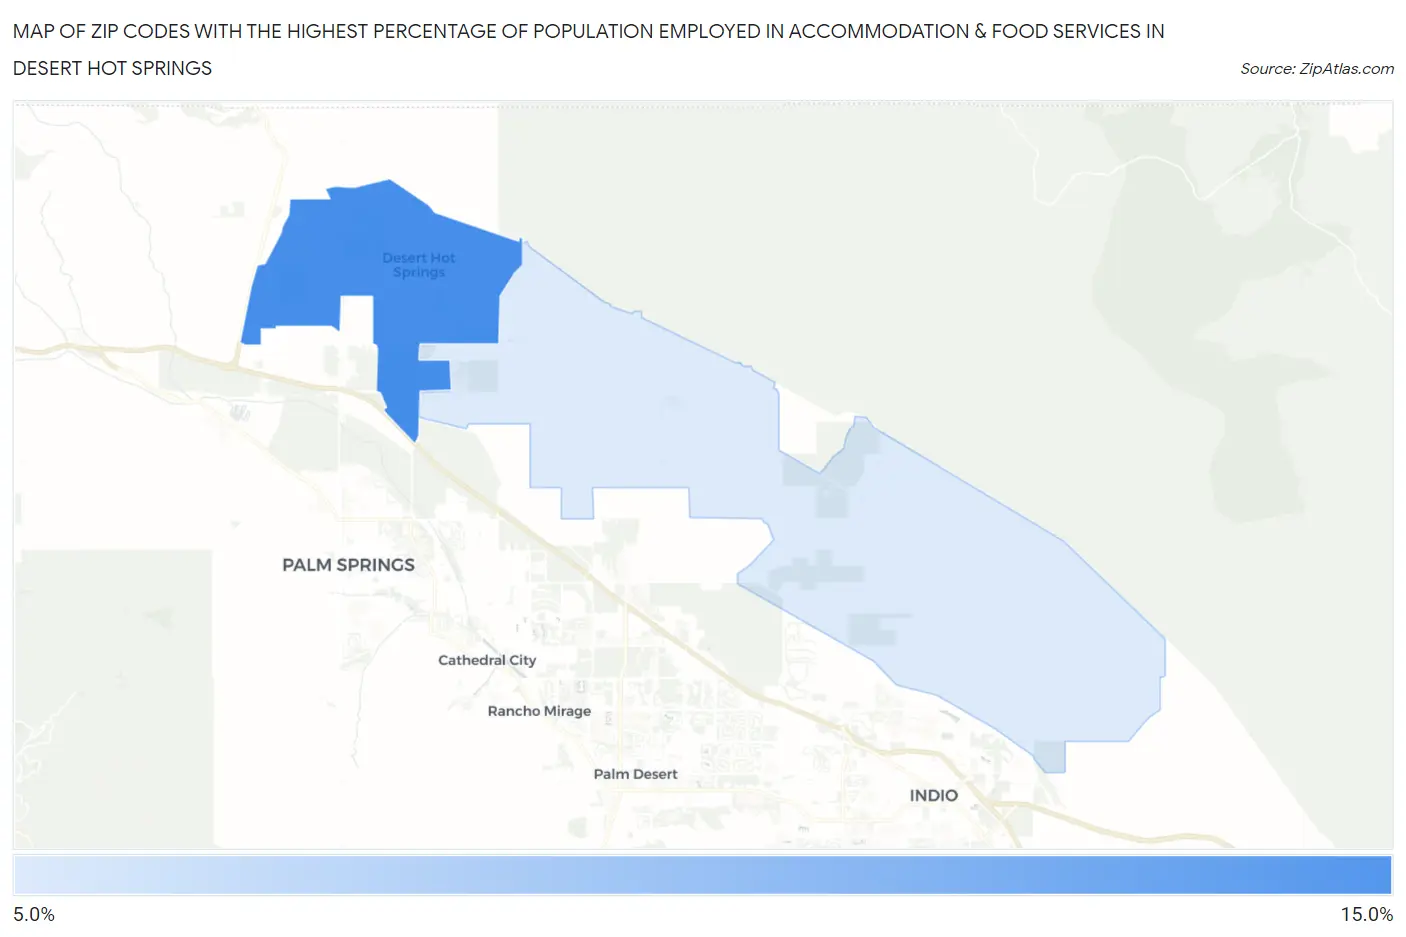
Map of Zip Codes with the Highest Percentage of Population Employed in Accommodation & Food Services in Desert Hot Springs
10.3%
12.6%
Zip Codes with the Highest Percentage of Population Employed in Accommodation & Food Services in Desert Hot Springs, CA
| Zip Code | % Employed | vs State | vs National | |
| 1. | 92240 | 12.6% | 7.2%(+5.46)#161 | 6.9%(+5.75)#2,515 |
| 2. | 92241 | 10.3% | 7.2%(+3.16)#266 | 6.9%(+3.45)#4,167 |
1
Common Questions
What are the Top Zip Codes with the Highest Percentage of Population Employed in Accommodation & Food Services in Desert Hot Springs, CA?
Top Zip Codes with the Highest Percentage of Population Employed in Accommodation & Food Services in Desert Hot Springs, CA are:
What zip code has the Highest Percentage of Population Employed in Accommodation & Food Services in Desert Hot Springs, CA?
92240 has the Highest Percentage of Population Employed in Accommodation & Food Services in Desert Hot Springs, CA with 12.6%.
What is the Percentage of Population Employed in Accommodation & Food Services in Desert Hot Springs, CA?
Percentage of Population Employed in Accommodation & Food Services in Desert Hot Springs is 10.3%.
What is the Percentage of Population Employed in Accommodation & Food Services in California?
Percentage of Population Employed in Accommodation & Food Services in California is 7.2%.
What is the Percentage of Population Employed in Accommodation & Food Services in the United States?
Percentage of Population Employed in Accommodation & Food Services in the United States is 6.9%.