Zip Codes with the Highest Percentage of Population Employed in Accommodation & Food Services in Culver City, CA
RELATED REPORTS & OPTIONS
Accommodation & Food Services
Culver City
Compare Zip Codes
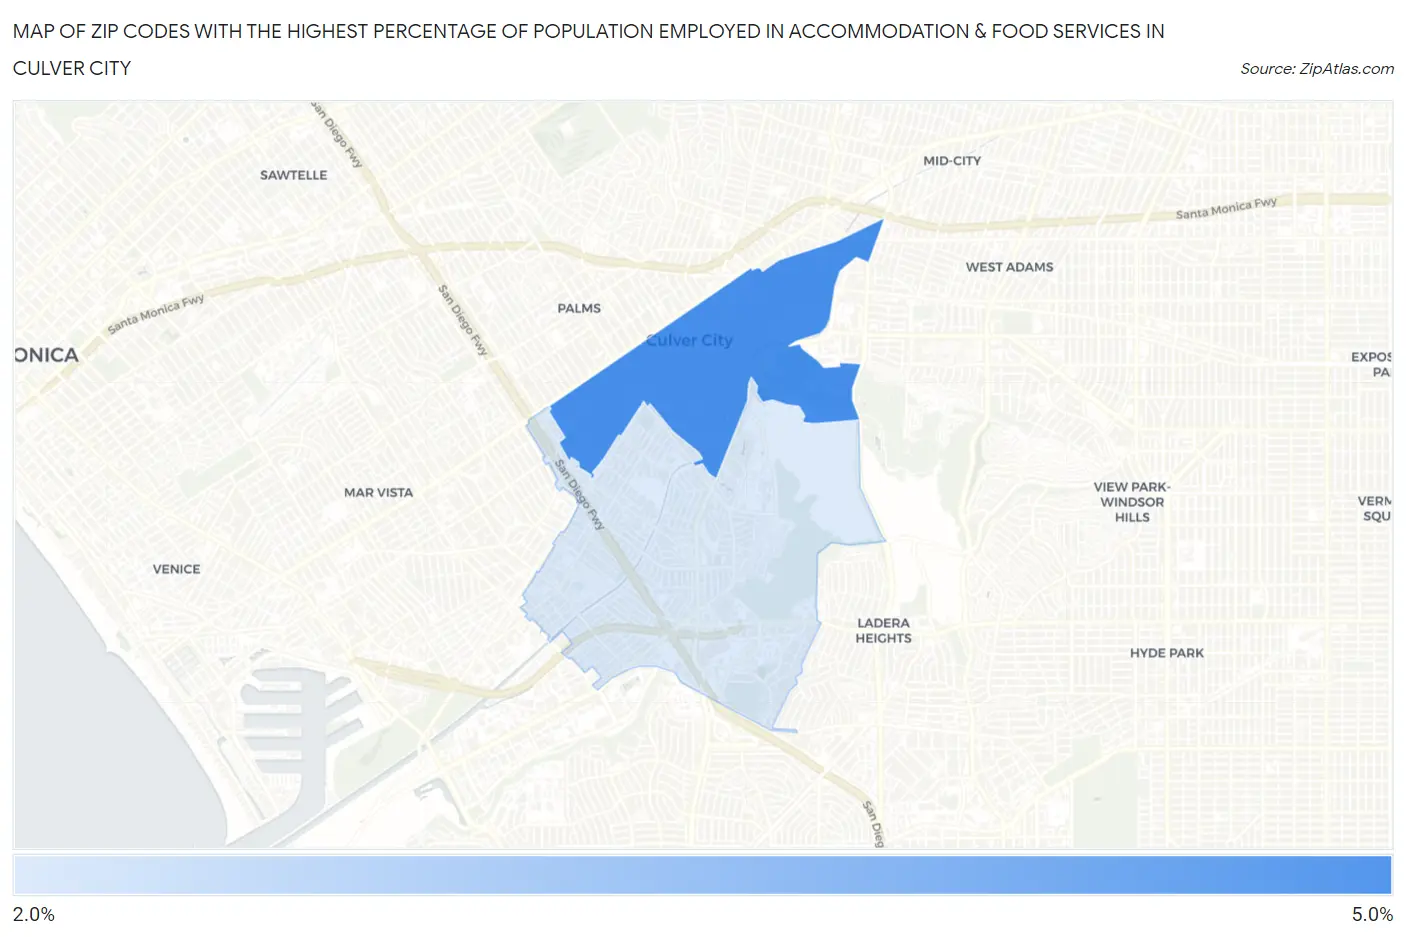
Map of Zip Codes with the Highest Percentage of Population Employed in Accommodation & Food Services in Culver City
2.7%
4.3%
Zip Codes with the Highest Percentage of Population Employed in Accommodation & Food Services in Culver City, CA
| Zip Code | % Employed | vs State | vs National | |
| 1. | 90232 | 4.3% | 7.2%(-2.92)#1,251 | 6.9%(-2.63)#19,330 |
| 2. | 90230 | 2.7% | 7.2%(-4.44)#1,435 | 6.9%(-4.15)#23,939 |
1
Common Questions
What are the Top Zip Codes with the Highest Percentage of Population Employed in Accommodation & Food Services in Culver City, CA?
Top Zip Codes with the Highest Percentage of Population Employed in Accommodation & Food Services in Culver City, CA are:
What zip code has the Highest Percentage of Population Employed in Accommodation & Food Services in Culver City, CA?
90232 has the Highest Percentage of Population Employed in Accommodation & Food Services in Culver City, CA with 4.3%.
What is the Percentage of Population Employed in Accommodation & Food Services in Culver City, CA?
Percentage of Population Employed in Accommodation & Food Services in Culver City is 2.8%.
What is the Percentage of Population Employed in Accommodation & Food Services in California?
Percentage of Population Employed in Accommodation & Food Services in California is 7.2%.
What is the Percentage of Population Employed in Accommodation & Food Services in the United States?
Percentage of Population Employed in Accommodation & Food Services in the United States is 6.9%.