Cities with the Highest Percentage of Population Employed in Accommodation & Food Services in South Carolina
RELATED REPORTS & OPTIONS
Accommodation & Food Services
South Carolina
Compare Cities
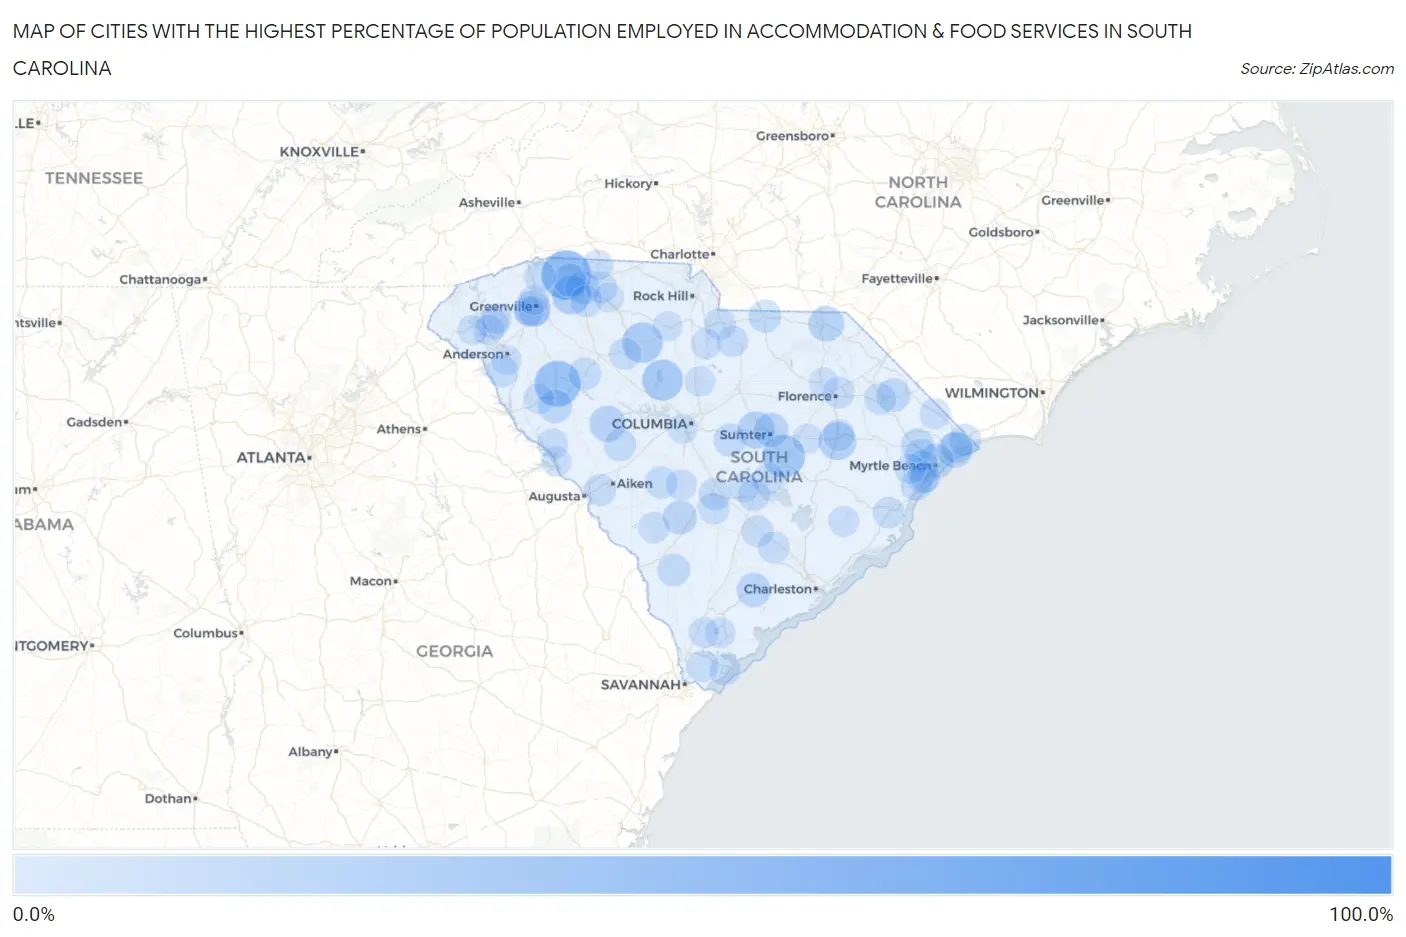
Map of Cities with the Highest Percentage of Population Employed in Accommodation & Food Services in South Carolina
0.0%
100.0%
Cities with the Highest Percentage of Population Employed in Accommodation & Food Services in South Carolina
| City | % Employed | vs State | vs National | |
| 1. | Ketchuptown | 100.0% | 8.0%(+92.0)#1 | 6.9%(+93.1)#36 |
| 2. | Gramling | 50.8% | 8.0%(+42.8)#2 | 6.9%(+43.9)#145 |
| 3. | Finklea | 46.2% | 8.0%(+38.2)#3 | 6.9%(+39.3)#202 |
| 4. | Cokesbury | 43.9% | 8.0%(+35.9)#4 | 6.9%(+37.0)#227 |
| 5. | Homewood | 38.2% | 8.0%(+30.3)#5 | 6.9%(+31.4)#294 |
| 6. | Keowee Key | 37.2% | 8.0%(+29.3)#6 | 6.9%(+30.4)#309 |
| 7. | Alcolu | 36.8% | 8.0%(+28.8)#7 | 6.9%(+29.9)#318 |
| 8. | Jenkinsville | 33.3% | 8.0%(+25.4)#8 | 6.9%(+26.5)#387 |
| 9. | Carlisle | 32.8% | 8.0%(+24.9)#9 | 6.9%(+26.0)#404 |
| 10. | North Santee | 31.3% | 8.0%(+23.3)#10 | 6.9%(+24.4)#444 |
| 11. | Startex | 29.3% | 8.0%(+21.3)#11 | 6.9%(+22.4)#504 |
| 12. | Lake City | 26.9% | 8.0%(+18.9)#12 | 6.9%(+20.0)#622 |
| 13. | Cherryvale | 26.1% | 8.0%(+18.2)#13 | 6.9%(+19.3)#662 |
| 14. | Saluda | 24.0% | 8.0%(+16.0)#14 | 6.9%(+17.1)#819 |
| 15. | Judson | 23.9% | 8.0%(+16.0)#15 | 6.9%(+17.0)#821 |
| 16. | Wallace | 22.8% | 8.0%(+14.8)#16 | 6.9%(+15.9)#927 |
| 17. | Newtown | 22.8% | 8.0%(+14.8)#17 | 6.9%(+15.9)#929 |
| 18. | Atlantic Beach | 22.1% | 8.0%(+14.1)#18 | 6.9%(+15.2)#1,003 |
| 19. | Dale | 22.1% | 8.0%(+14.1)#19 | 6.9%(+15.2)#1,006 |
| 20. | Myrtle Beach | 21.2% | 8.0%(+13.3)#20 | 6.9%(+14.4)#1,090 |
| 21. | Mulberry | 20.2% | 8.0%(+12.3)#21 | 6.9%(+13.4)#1,217 |
| 22. | Clemson University | 20.1% | 8.0%(+12.2)#22 | 6.9%(+13.2)#1,226 |
| 23. | Jacksonboro | 20.0% | 8.0%(+12.0)#23 | 6.9%(+13.1)#1,244 |
| 24. | Denmark | 19.8% | 8.0%(+11.8)#24 | 6.9%(+12.9)#1,285 |
| 25. | Promised Land | 19.5% | 8.0%(+11.5)#25 | 6.9%(+12.6)#1,328 |
| 26. | Southern Shops | 19.2% | 8.0%(+11.2)#26 | 6.9%(+12.3)#1,392 |
| 27. | Mullins | 18.9% | 8.0%(+10.9)#27 | 6.9%(+12.0)#1,436 |
| 28. | The Cliffs Valley | 18.8% | 8.0%(+10.8)#28 | 6.9%(+11.9)#1,459 |
| 29. | Inman Mills | 18.3% | 8.0%(+10.3)#29 | 6.9%(+11.4)#1,550 |
| 30. | Conway | 18.2% | 8.0%(+10.2)#30 | 6.9%(+11.3)#1,593 |
| 31. | Arkwright | 18.0% | 8.0%(+10.0)#31 | 6.9%(+11.1)#1,622 |
| 32. | Eastover | 17.7% | 8.0%(+9.73)#32 | 6.9%(+10.8)#1,677 |
| 33. | Carolina Forest | 17.6% | 8.0%(+9.63)#33 | 6.9%(+10.7)#1,698 |
| 34. | Olympia | 17.5% | 8.0%(+9.58)#34 | 6.9%(+10.7)#1,704 |
| 35. | Pageland | 17.3% | 8.0%(+9.33)#35 | 6.9%(+10.4)#1,762 |
| 36. | Brunson | 17.1% | 8.0%(+9.13)#36 | 6.9%(+10.2)#1,805 |
| 37. | Socastee | 17.0% | 8.0%(+9.08)#37 | 6.9%(+10.2)#1,824 |
| 38. | Red Hill | 17.0% | 8.0%(+9.06)#38 | 6.9%(+10.2)#1,828 |
| 39. | Whitney | 16.5% | 8.0%(+8.54)#39 | 6.9%(+9.63)#1,951 |
| 40. | Mountville | 16.5% | 8.0%(+8.52)#40 | 6.9%(+9.61)#1,958 |
| 41. | Salley | 16.2% | 8.0%(+8.25)#41 | 6.9%(+9.34)#2,025 |
| 42. | Ridge Spring | 16.1% | 8.0%(+8.09)#42 | 6.9%(+9.18)#2,085 |
| 43. | Santee | 16.0% | 8.0%(+8.00)#43 | 6.9%(+9.09)#2,113 |
| 44. | Little River | 15.8% | 8.0%(+7.85)#44 | 6.9%(+8.94)#2,162 |
| 45. | Wilkinson Heights | 15.8% | 8.0%(+7.81)#45 | 6.9%(+8.90)#2,178 |
| 46. | Sheldon | 15.7% | 8.0%(+7.68)#46 | 6.9%(+8.77)#2,213 |
| 47. | Sandy Springs | 15.6% | 8.0%(+7.65)#47 | 6.9%(+8.74)#2,226 |
| 48. | Centenary | 15.6% | 8.0%(+7.58)#48 | 6.9%(+8.67)#2,258 |
| 49. | Whitmire | 15.6% | 8.0%(+7.58)#49 | 6.9%(+8.67)#2,261 |
| 50. | Marion | 15.5% | 8.0%(+7.53)#50 | 6.9%(+8.62)#2,272 |
| 51. | Starr | 15.5% | 8.0%(+7.52)#51 | 6.9%(+8.61)#2,275 |
| 52. | North Myrtle Beach | 15.4% | 8.0%(+7.41)#52 | 6.9%(+8.49)#2,312 |
| 53. | Langley | 15.3% | 8.0%(+7.33)#53 | 6.9%(+8.42)#2,333 |
| 54. | Harleyville | 15.3% | 8.0%(+7.32)#54 | 6.9%(+8.41)#2,336 |
| 55. | Ridgeville | 15.2% | 8.0%(+7.23)#55 | 6.9%(+8.32)#2,355 |
| 56. | Roebuck | 15.1% | 8.0%(+7.15)#56 | 6.9%(+8.24)#2,391 |
| 57. | Quinby | 15.1% | 8.0%(+7.12)#57 | 6.9%(+8.21)#2,400 |
| 58. | Lancaster | 15.1% | 8.0%(+7.12)#58 | 6.9%(+8.20)#2,407 |
| 59. | Clifton | 15.1% | 8.0%(+7.11)#59 | 6.9%(+8.20)#2,412 |
| 60. | Scranton | 15.0% | 8.0%(+6.99)#60 | 6.9%(+8.08)#2,463 |
| 61. | Summerton | 14.8% | 8.0%(+6.88)#61 | 6.9%(+7.97)#2,502 |
| 62. | Central | 14.8% | 8.0%(+6.87)#62 | 6.9%(+7.96)#2,505 |
| 63. | Arthurtown | 14.8% | 8.0%(+6.82)#63 | 6.9%(+7.91)#2,522 |
| 64. | Tigerville | 14.8% | 8.0%(+6.78)#64 | 6.9%(+7.87)#2,534 |
| 65. | Georgetown | 14.7% | 8.0%(+6.75)#65 | 6.9%(+7.84)#2,541 |
| 66. | Bluffton | 14.7% | 8.0%(+6.75)#66 | 6.9%(+7.84)#2,542 |
| 67. | Barnwell | 14.7% | 8.0%(+6.73)#67 | 6.9%(+7.82)#2,553 |
| 68. | Heath Springs | 14.4% | 8.0%(+6.45)#68 | 6.9%(+7.54)#2,669 |
| 69. | Murrells Inlet | 14.2% | 8.0%(+6.27)#69 | 6.9%(+7.36)#2,762 |
| 70. | Rowesville | 14.2% | 8.0%(+6.22)#70 | 6.9%(+7.31)#2,782 |
| 71. | Loris | 13.7% | 8.0%(+5.75)#71 | 6.9%(+6.84)#2,982 |
| 72. | Livingston | 13.7% | 8.0%(+5.75)#72 | 6.9%(+6.84)#2,984 |
| 73. | Hilton Head Island | 13.7% | 8.0%(+5.73)#73 | 6.9%(+6.82)#2,995 |
| 74. | Garden City | 13.6% | 8.0%(+5.66)#74 | 6.9%(+6.75)#3,044 |
| 75. | Chesnee | 13.4% | 8.0%(+5.40)#75 | 6.9%(+6.49)#3,176 |
| 76. | Abbeville | 13.3% | 8.0%(+5.37)#76 | 6.9%(+6.46)#3,185 |
| 77. | Plum Branch | 13.3% | 8.0%(+5.36)#77 | 6.9%(+6.45)#3,201 |
| 78. | Great Falls | 13.0% | 8.0%(+5.07)#78 | 6.9%(+6.16)#3,344 |
| 79. | Laurel Bay | 12.9% | 8.0%(+4.96)#79 | 6.9%(+6.05)#3,406 |
| 80. | Surfside Beach | 12.9% | 8.0%(+4.92)#80 | 6.9%(+6.01)#3,433 |
| 81. | Jamestown | 12.8% | 8.0%(+4.80)#81 | 6.9%(+5.88)#3,507 |
| 82. | Ridgeland | 12.8% | 8.0%(+4.79)#82 | 6.9%(+5.88)#3,509 |
| 83. | Clemson | 12.7% | 8.0%(+4.78)#83 | 6.9%(+5.87)#3,515 |
| 84. | Cateechee | 12.7% | 8.0%(+4.74)#84 | 6.9%(+5.83)#3,536 |
| 85. | Norris | 12.7% | 8.0%(+4.74)#85 | 6.9%(+5.83)#3,537 |
| 86. | Dunean | 12.7% | 8.0%(+4.74)#86 | 6.9%(+5.83)#3,539 |
| 87. | Modoc | 12.5% | 8.0%(+4.53)#87 | 6.9%(+5.62)#3,666 |
| 88. | Bucksport | 12.5% | 8.0%(+4.50)#88 | 6.9%(+5.59)#3,711 |
| 89. | Welcome | 12.4% | 8.0%(+4.48)#89 | 6.9%(+5.57)#3,720 |
| 90. | Ridgeway | 12.4% | 8.0%(+4.43)#90 | 6.9%(+5.52)#3,741 |
| 91. | Dovesville | 12.3% | 8.0%(+4.32)#91 | 6.9%(+5.41)#3,812 |
| 92. | Gayle Mill | 12.2% | 8.0%(+4.28)#92 | 6.9%(+5.37)#3,848 |
| 93. | Homeland Park | 12.2% | 8.0%(+4.25)#93 | 6.9%(+5.34)#3,862 |
| 94. | Springdale | 12.0% | 8.0%(+4.03)#94 | 6.9%(+5.12)#4,002 |
| 95. | Turbeville | 12.0% | 8.0%(+4.03)#95 | 6.9%(+5.12)#4,006 |
| 96. | Sans Souci | 12.0% | 8.0%(+4.01)#96 | 6.9%(+5.10)#4,026 |
| 97. | Seneca | 11.9% | 8.0%(+3.93)#97 | 6.9%(+5.02)#4,081 |
| 98. | Pacolet | 11.8% | 8.0%(+3.80)#98 | 6.9%(+4.89)#4,169 |
| 99. | Darlington | 11.7% | 8.0%(+3.70)#99 | 6.9%(+4.79)#4,250 |
| 100. | Elloree | 11.6% | 8.0%(+3.66)#100 | 6.9%(+4.75)#4,275 |
Common Questions
What are the Top 10 Cities with the Highest Percentage of Population Employed in Accommodation & Food Services in South Carolina?
Top 10 Cities with the Highest Percentage of Population Employed in Accommodation & Food Services in South Carolina are:
#1
50.8%
#2
43.9%
#3
36.8%
#4
33.3%
#5
32.8%
#6
29.3%
#7
26.9%
#8
26.1%
#9
24.0%
#10
23.9%
What city has the Highest Percentage of Population Employed in Accommodation & Food Services in South Carolina?
Gramling has the Highest Percentage of Population Employed in Accommodation & Food Services in South Carolina with 50.8%.
What is the Percentage of Population Employed in Accommodation & Food Services in the State of South Carolina?
Percentage of Population Employed in Accommodation & Food Services in South Carolina is 8.0%.
What is the Percentage of Population Employed in Accommodation & Food Services in the United States?
Percentage of Population Employed in Accommodation & Food Services in the United States is 6.9%.