Cities with the Highest Percentage of Population Employed in Accommodation & Food Services in Maryland
RELATED REPORTS & OPTIONS
Accommodation & Food Services
Maryland
Compare Cities
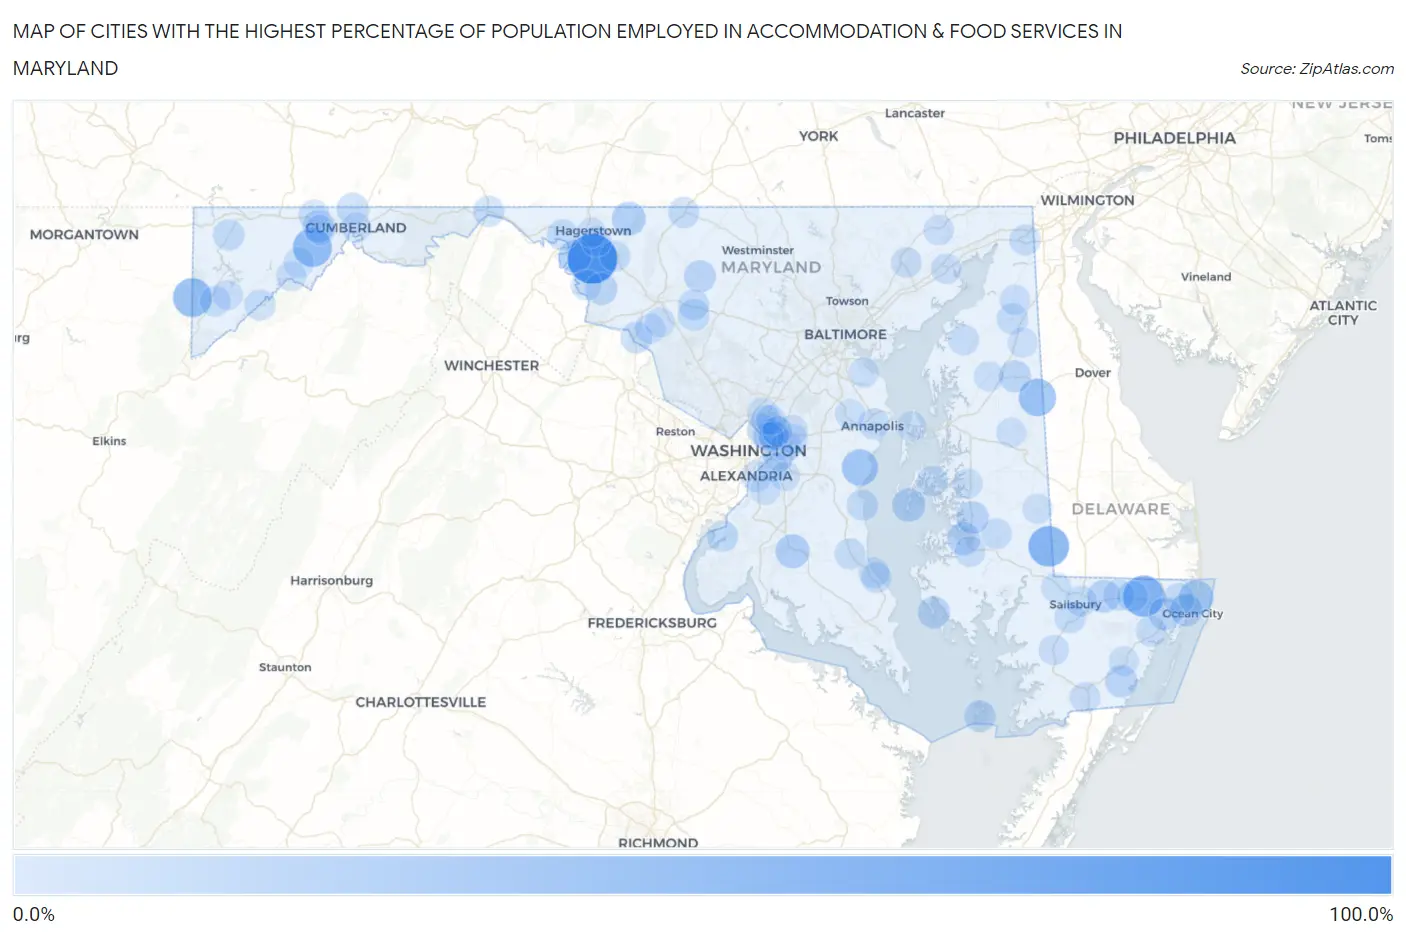
Map of Cities with the Highest Percentage of Population Employed in Accommodation & Food Services in Maryland
0.0%
100.0%
Cities with the Highest Percentage of Population Employed in Accommodation & Food Services in Maryland
| City | % Employed | vs State | vs National | |
| 1. | Breathedsville | 100.0% | 5.8%(+94.2)#1 | 6.9%(+93.1)#3 |
| 2. | Whaleyville | 60.2% | 5.8%(+54.4)#2 | 6.9%(+53.3)#89 |
| 3. | Galestown | 57.1% | 5.8%(+51.3)#3 | 6.9%(+50.3)#109 |
| 4. | Gilmore | 49.3% | 5.8%(+43.5)#4 | 6.9%(+42.4)#173 |
| 5. | Hutton | 48.3% | 5.8%(+42.4)#5 | 6.9%(+41.4)#183 |
| 6. | Henderson | 41.4% | 5.8%(+35.6)#6 | 6.9%(+34.5)#251 |
| 7. | Galesville | 36.5% | 5.8%(+30.7)#7 | 6.9%(+29.6)#323 |
| 8. | Ocean City | 29.0% | 5.8%(+23.2)#8 | 6.9%(+22.1)#513 |
| 9. | Bryantown | 26.4% | 5.8%(+20.6)#9 | 6.9%(+19.5)#645 |
| 10. | Greensburg | 25.0% | 5.8%(+19.2)#10 | 6.9%(+18.1)#734 |
| 11. | Tilghman Island | 23.2% | 5.8%(+17.4)#11 | 6.9%(+16.3)#886 |
| 12. | Algonquin | 21.1% | 5.8%(+15.3)#12 | 6.9%(+14.2)#1,111 |
| 13. | Parsonsburg | 20.9% | 5.8%(+15.0)#13 | 6.9%(+14.0)#1,136 |
| 14. | Downsville | 20.5% | 5.8%(+14.7)#14 | 6.9%(+13.6)#1,182 |
| 15. | Berlin | 20.0% | 5.8%(+14.2)#15 | 6.9%(+13.1)#1,236 |
| 16. | West Ocean City | 19.9% | 5.8%(+14.1)#16 | 6.9%(+13.1)#1,263 |
| 17. | Trappe | 19.9% | 5.8%(+14.1)#17 | 6.9%(+13.0)#1,265 |
| 18. | Girdletree | 19.4% | 5.8%(+13.6)#18 | 6.9%(+12.5)#1,346 |
| 19. | Frostburg | 19.3% | 5.8%(+13.5)#19 | 6.9%(+12.4)#1,363 |
| 20. | Fishing Creek | 18.1% | 5.8%(+12.2)#20 | 6.9%(+11.2)#1,607 |
| 21. | Mount Briar | 18.0% | 5.8%(+12.2)#21 | 6.9%(+11.1)#1,619 |
| 22. | Barclay | 17.8% | 5.8%(+12.0)#22 | 6.9%(+10.9)#1,652 |
| 23. | Libertytown | 17.7% | 5.8%(+11.9)#23 | 6.9%(+10.9)#1,669 |
| 24. | Smith Island | 16.1% | 5.8%(+10.3)#24 | 6.9%(+9.25)#2,056 |
| 25. | Ellerslie | 15.9% | 5.8%(+10.1)#25 | 6.9%(+9.03)#2,132 |
| 26. | Burnt Mills | 15.8% | 5.8%(+9.92)#26 | 6.9%(+8.89)#2,181 |
| 27. | Capitol Heights | 15.7% | 5.8%(+9.86)#27 | 6.9%(+8.83)#2,196 |
| 28. | Point Of Rocks | 15.4% | 5.8%(+9.52)#28 | 6.9%(+8.48)#2,315 |
| 29. | Monrovia | 15.2% | 5.8%(+9.38)#29 | 6.9%(+8.34)#2,346 |
| 30. | Accident | 14.6% | 5.8%(+8.72)#30 | 6.9%(+7.68)#2,615 |
| 31. | Ocean Pines | 14.2% | 5.8%(+8.39)#31 | 6.9%(+7.35)#2,764 |
| 32. | Pinesburg | 13.9% | 5.8%(+8.06)#32 | 6.9%(+7.03)#2,888 |
| 33. | Indian Head | 13.9% | 5.8%(+8.03)#33 | 6.9%(+7.00)#2,910 |
| 34. | Fruitland | 13.7% | 5.8%(+7.83)#34 | 6.9%(+6.79)#3,010 |
| 35. | Pittsville | 13.6% | 5.8%(+7.80)#35 | 6.9%(+6.76)#3,022 |
| 36. | Kitzmiller | 13.6% | 5.8%(+7.79)#36 | 6.9%(+6.76)#3,033 |
| 37. | Elkton | 13.5% | 5.8%(+7.69)#37 | 6.9%(+6.66)#3,093 |
| 38. | Galena | 13.4% | 5.8%(+7.58)#38 | 6.9%(+6.55)#3,146 |
| 39. | Hancock | 13.4% | 5.8%(+7.58)#39 | 6.9%(+6.54)#3,148 |
| 40. | Salisbury | 13.4% | 5.8%(+7.52)#40 | 6.9%(+6.49)#3,177 |
| 41. | North Beach | 13.3% | 5.8%(+7.50)#41 | 6.9%(+6.47)#3,184 |
| 42. | Naval Academy | 12.9% | 5.8%(+7.07)#42 | 6.9%(+6.04)#3,410 |
| 43. | Emmitsburg | 12.9% | 5.8%(+7.04)#43 | 6.9%(+6.00)#3,438 |
| 44. | Chillum | 12.7% | 5.8%(+6.85)#44 | 6.9%(+5.82)#3,547 |
| 45. | Willards | 12.7% | 5.8%(+6.83)#45 | 6.9%(+5.79)#3,564 |
| 46. | Brentwood | 12.6% | 5.8%(+6.75)#46 | 6.9%(+5.71)#3,619 |
| 47. | New Market | 12.5% | 5.8%(+6.68)#47 | 6.9%(+5.65)#3,655 |
| 48. | Mount Lena | 12.3% | 5.8%(+6.44)#48 | 6.9%(+5.41)#3,818 |
| 49. | Forest Heights | 12.2% | 5.8%(+6.37)#49 | 6.9%(+5.34)#3,868 |
| 50. | Calvert Beach | 12.2% | 5.8%(+6.31)#50 | 6.9%(+5.28)#3,901 |
| 51. | Secretary | 12.1% | 5.8%(+6.24)#51 | 6.9%(+5.21)#3,941 |
| 52. | Cambridge | 12.0% | 5.8%(+6.15)#52 | 6.9%(+5.11)#4,019 |
| 53. | Prince Frederick | 11.9% | 5.8%(+6.06)#53 | 6.9%(+5.02)#4,080 |
| 54. | Long Beach | 11.9% | 5.8%(+6.05)#54 | 6.9%(+5.02)#4,082 |
| 55. | St Michaels | 11.7% | 5.8%(+5.84)#55 | 6.9%(+4.81)#4,236 |
| 56. | Mountain Lake Park | 11.5% | 5.8%(+5.66)#56 | 6.9%(+4.63)#4,360 |
| 57. | Sharpsburg | 11.4% | 5.8%(+5.51)#57 | 6.9%(+4.47)#4,471 |
| 58. | Worton | 11.3% | 5.8%(+5.49)#58 | 6.9%(+4.46)#4,484 |
| 59. | Newark | 11.3% | 5.8%(+5.47)#59 | 6.9%(+4.44)#4,504 |
| 60. | Finzel | 11.3% | 5.8%(+5.46)#60 | 6.9%(+4.43)#4,515 |
| 61. | Riverdale Park | 11.3% | 5.8%(+5.43)#61 | 6.9%(+4.40)#4,542 |
| 62. | Edmonston | 10.9% | 5.8%(+5.02)#62 | 6.9%(+3.99)#4,886 |
| 63. | Brown Station | 10.8% | 5.8%(+4.97)#63 | 6.9%(+3.93)#4,936 |
| 64. | Summerfield | 10.8% | 5.8%(+4.96)#64 | 6.9%(+3.93)#4,938 |
| 65. | Bel Air | 10.8% | 5.8%(+4.95)#65 | 6.9%(+3.92)#4,955 |
| 66. | Hillandale | 10.7% | 5.8%(+4.85)#66 | 6.9%(+3.82)#5,044 |
| 67. | Lanham | 10.6% | 5.8%(+4.75)#67 | 6.9%(+3.72)#5,130 |
| 68. | Cecilton | 10.5% | 5.8%(+4.62)#68 | 6.9%(+3.59)#5,252 |
| 69. | Aberdeen | 10.2% | 5.8%(+4.39)#69 | 6.9%(+3.35)#5,524 |
| 70. | Funkstown | 10.2% | 5.8%(+4.39)#70 | 6.9%(+3.35)#5,525 |
| 71. | Darlington | 10.1% | 5.8%(+4.24)#71 | 6.9%(+3.21)#5,686 |
| 72. | Pocomoke City | 10.0% | 5.8%(+4.20)#72 | 6.9%(+3.17)#5,722 |
| 73. | Adamstown | 10.0% | 5.8%(+4.19)#73 | 6.9%(+3.15)#5,733 |
| 74. | Deer Park | 10.0% | 5.8%(+4.15)#74 | 6.9%(+3.12)#5,771 |
| 75. | Grahamtown | 9.9% | 5.8%(+4.07)#75 | 6.9%(+3.04)#5,873 |
| 76. | Princess Anne | 9.7% | 5.8%(+3.83)#76 | 6.9%(+2.80)#6,157 |
| 77. | Springdale | 9.7% | 5.8%(+3.81)#77 | 6.9%(+2.78)#6,181 |
| 78. | Hebron | 9.7% | 5.8%(+3.81)#78 | 6.9%(+2.77)#6,188 |
| 79. | Silver Hill | 9.6% | 5.8%(+3.77)#79 | 6.9%(+2.74)#6,224 |
| 80. | Adelphi | 9.6% | 5.8%(+3.71)#80 | 6.9%(+2.67)#6,316 |
| 81. | Barton | 9.6% | 5.8%(+3.70)#81 | 6.9%(+2.67)#6,321 |
| 82. | Easton | 9.4% | 5.8%(+3.58)#82 | 6.9%(+2.54)#6,489 |
| 83. | Westernport | 9.3% | 5.8%(+3.49)#83 | 6.9%(+2.46)#6,595 |
| 84. | Buckeystown | 9.2% | 5.8%(+3.38)#84 | 6.9%(+2.35)#6,743 |
| 85. | Friendly | 9.2% | 5.8%(+3.33)#85 | 6.9%(+2.29)#6,826 |
| 86. | Riviera Beach | 9.1% | 5.8%(+3.25)#86 | 6.9%(+2.22)#6,934 |
| 87. | Millington | 9.1% | 5.8%(+3.24)#87 | 6.9%(+2.21)#6,947 |
| 88. | Cottage City | 9.1% | 5.8%(+3.23)#88 | 6.9%(+2.19)#6,995 |
| 89. | Cumberland | 9.1% | 5.8%(+3.21)#89 | 6.9%(+2.18)#7,011 |
| 90. | Church Hill | 9.1% | 5.8%(+3.21)#90 | 6.9%(+2.18)#7,014 |
| 91. | Bladensburg | 9.0% | 5.8%(+3.15)#91 | 6.9%(+2.12)#7,090 |
| 92. | College Park | 9.0% | 5.8%(+3.11)#92 | 6.9%(+2.07)#7,177 |
| 93. | Stevensville | 9.0% | 5.8%(+3.11)#93 | 6.9%(+2.07)#7,179 |
| 94. | Crownsville | 8.9% | 5.8%(+3.07)#94 | 6.9%(+2.03)#7,242 |
| 95. | Ridgely | 8.9% | 5.8%(+3.02)#95 | 6.9%(+1.99)#7,312 |
| 96. | Snow Hill | 8.8% | 5.8%(+2.95)#96 | 6.9%(+1.91)#7,417 |
| 97. | East Riverdale | 8.7% | 5.8%(+2.89)#97 | 6.9%(+1.86)#7,487 |
| 98. | Federalsburg | 8.6% | 5.8%(+2.72)#98 | 6.9%(+1.68)#7,770 |
| 99. | Andrews Afb | 8.4% | 5.8%(+2.59)#99 | 6.9%(+1.56)#7,971 |
| 100. | Hagerstown | 8.4% | 5.8%(+2.59)#100 | 6.9%(+1.55)#7,979 |
Common Questions
What are the Top 10 Cities with the Highest Percentage of Population Employed in Accommodation & Food Services in Maryland?
Top 10 Cities with the Highest Percentage of Population Employed in Accommodation & Food Services in Maryland are:
#1
100.0%
#2
60.2%
#3
57.1%
#4
49.3%
#5
48.3%
#6
41.4%
#7
36.5%
#8
29.0%
#9
26.4%
#10
25.0%
What city has the Highest Percentage of Population Employed in Accommodation & Food Services in Maryland?
Breathedsville has the Highest Percentage of Population Employed in Accommodation & Food Services in Maryland with 100.0%.
What is the Percentage of Population Employed in Accommodation & Food Services in the State of Maryland?
Percentage of Population Employed in Accommodation & Food Services in Maryland is 5.8%.
What is the Percentage of Population Employed in Accommodation & Food Services in the United States?
Percentage of Population Employed in Accommodation & Food Services in the United States is 6.9%.