Lytle Creek, CA Map & Demographics
Lytle Creek Map
Lytle Creek Overview
$34,607
PER CAPITA INCOME
$62,039
AVG FAMILY INCOME
$56,607
AVG HOUSEHOLD INCOME
0.36
INEQUALITY / GINI INDEX
528
TOTAL POPULATION
290
MALE POPULATION
238
FEMALE POPULATION
121.85
MALES / 100 FEMALES
82.07
FEMALES / 100 MALES
53.6
MEDIAN AGE
2.4
AVG FAMILY SIZE
1.8
AVG HOUSEHOLD SIZE
252
LABOR FORCE [ PEOPLE ]
51.9%
PERCENT IN LABOR FORCE
12.3%
UNEMPLOYMENT RATE
Lytle Creek Zip Codes
Lytle Creek Area Codes
Income in Lytle Creek
Income Overview in Lytle Creek
Per Capita Income in Lytle Creek is $34,607, while median incomes of families and households are $62,039 and $56,607 respectively.
| Characteristic | Number | Measure |
| Per Capita Income | 528 | $34,607 |
| Median Family Income | 129 | $62,039 |
| Mean Family Income | 129 | $74,957 |
| Median Household Income | 269 | $56,607 |
| Mean Household Income | 269 | $67,176 |
| Income Deficit | 129 | $0 |
| Wage / Income Gap (%) | 528 | 0.00% |
| Wage / Income Gap ($) | 528 | 100.00¢ per $1 |
| Gini / Inequality Index | 528 | 0.36 |
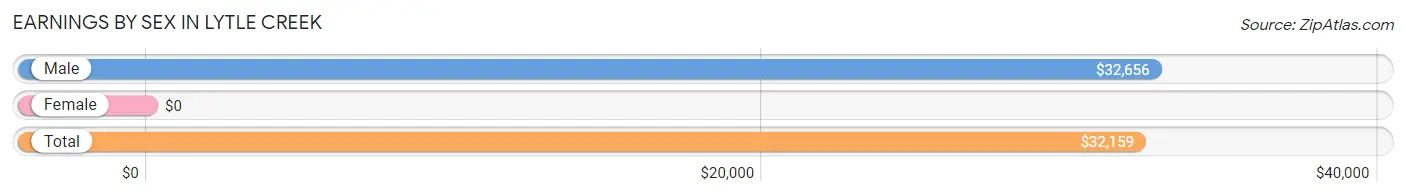
Earnings by Sex in Lytle Creek
| Sex | Number | Average Earnings |
| Male | 114 (43.3%) | $32,656 |
| Female | 149 (56.7%) | $0 |
| Total | 263 (100.0%) | $32,159 |
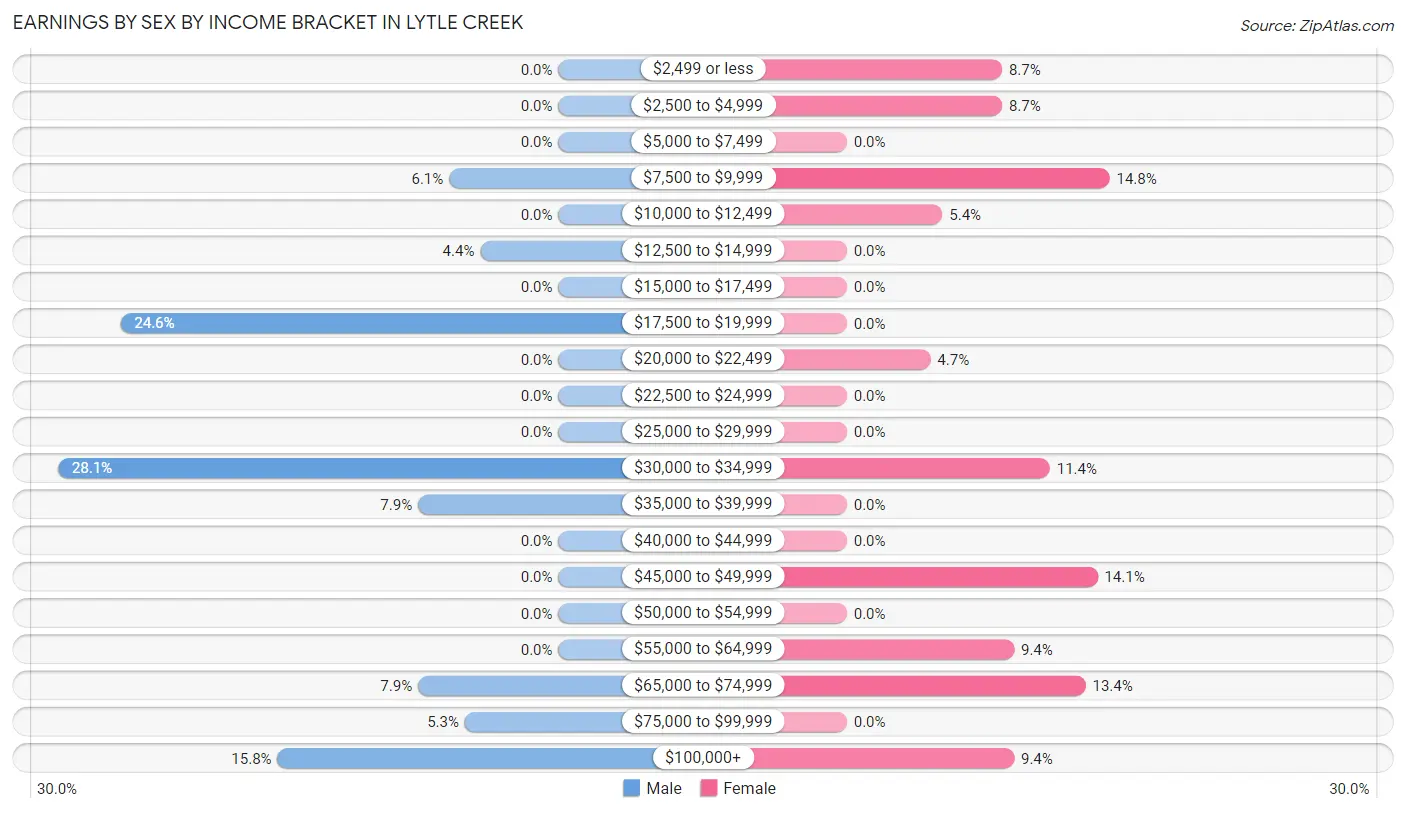
Earnings by Sex by Income Bracket in Lytle Creek
The most common earnings brackets in Lytle Creek are $30,000 to $34,999 for men (32 | 28.1%) and $7,500 to $9,999 for women (22 | 14.8%).
| Income | Male | Female |
| $2,499 or less | 0 (0.0%) | 13 (8.7%) |
| $2,500 to $4,999 | 0 (0.0%) | 13 (8.7%) |
| $5,000 to $7,499 | 0 (0.0%) | 0 (0.0%) |
| $7,500 to $9,999 | 7 (6.1%) | 22 (14.8%) |
| $10,000 to $12,499 | 0 (0.0%) | 8 (5.4%) |
| $12,500 to $14,999 | 5 (4.4%) | 0 (0.0%) |
| $15,000 to $17,499 | 0 (0.0%) | 0 (0.0%) |
| $17,500 to $19,999 | 28 (24.6%) | 0 (0.0%) |
| $20,000 to $22,499 | 0 (0.0%) | 7 (4.7%) |
| $22,500 to $24,999 | 0 (0.0%) | 0 (0.0%) |
| $25,000 to $29,999 | 0 (0.0%) | 0 (0.0%) |
| $30,000 to $34,999 | 32 (28.1%) | 17 (11.4%) |
| $35,000 to $39,999 | 9 (7.9%) | 0 (0.0%) |
| $40,000 to $44,999 | 0 (0.0%) | 0 (0.0%) |
| $45,000 to $49,999 | 0 (0.0%) | 21 (14.1%) |
| $50,000 to $54,999 | 0 (0.0%) | 0 (0.0%) |
| $55,000 to $64,999 | 0 (0.0%) | 14 (9.4%) |
| $65,000 to $74,999 | 9 (7.9%) | 20 (13.4%) |
| $75,000 to $99,999 | 6 (5.3%) | 0 (0.0%) |
| $100,000+ | 18 (15.8%) | 14 (9.4%) |
| Total | 114 (100.0%) | 149 (100.0%) |
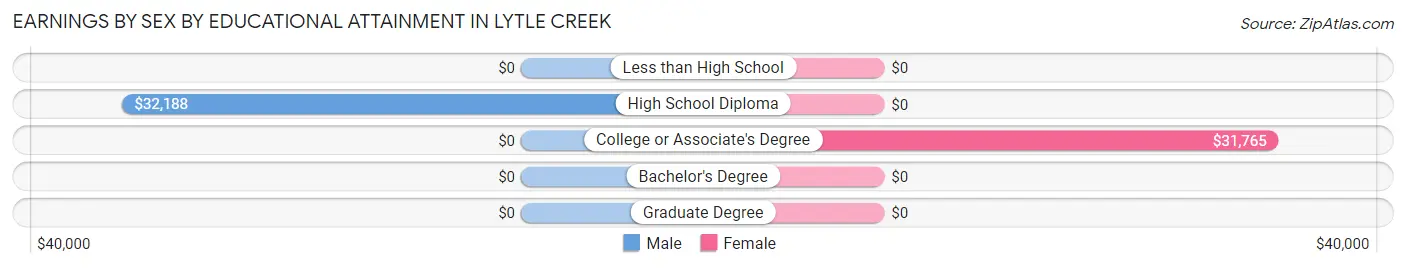
Earnings by Sex by Educational Attainment in Lytle Creek
| Educational Attainment | Male Income | Female Income |
| Less than High School | - | - |
| High School Diploma | $32,188 | $0 |
| College or Associate's Degree | - | - |
| Bachelor's Degree | - | - |
| Graduate Degree | - | - |
| Total | $32,656 | $0 |
Family Income in Lytle Creek
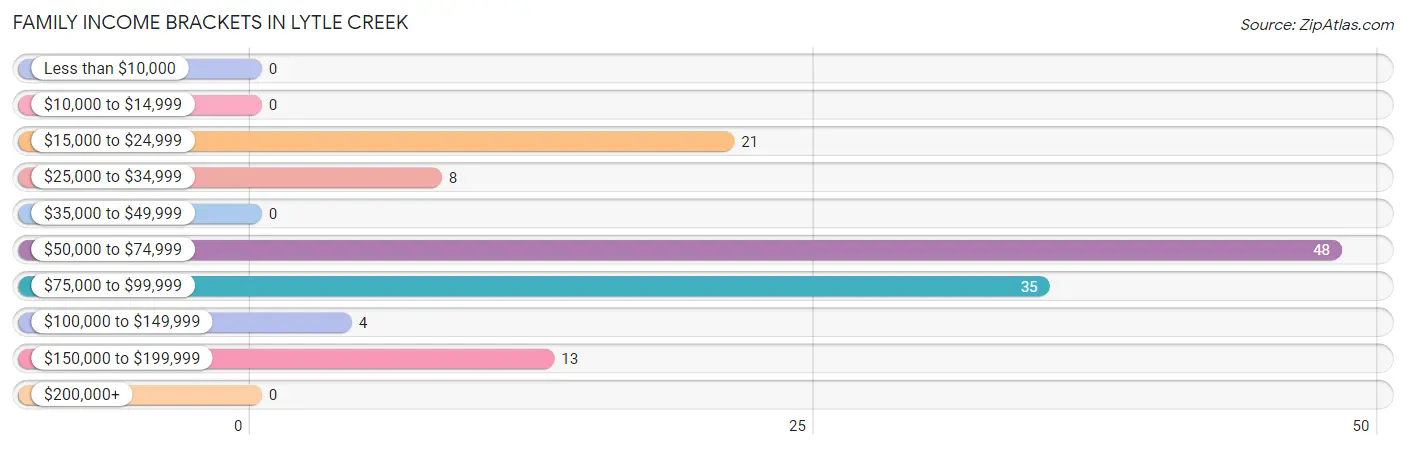
Family Income Brackets in Lytle Creek
According to the Lytle Creek family income data, there are 48 families falling into the $50,000 to $74,999 income range, which is the most common income bracket and makes up 37.2% of all families.
| Income Bracket | # Families | % Families |
| Less than $10,000 | 0 | 0.0% |
| $10,000 to $14,999 | 0 | 0.0% |
| $15,000 to $24,999 | 21 | 16.3% |
| $25,000 to $34,999 | 8 | 6.2% |
| $35,000 to $49,999 | 0 | 0.0% |
| $50,000 to $74,999 | 48 | 37.2% |
| $75,000 to $99,999 | 35 | 27.1% |
| $100,000 to $149,999 | 4 | 3.1% |
| $150,000 to $199,999 | 13 | 10.1% |
| $200,000+ | 0 | 0.0% |
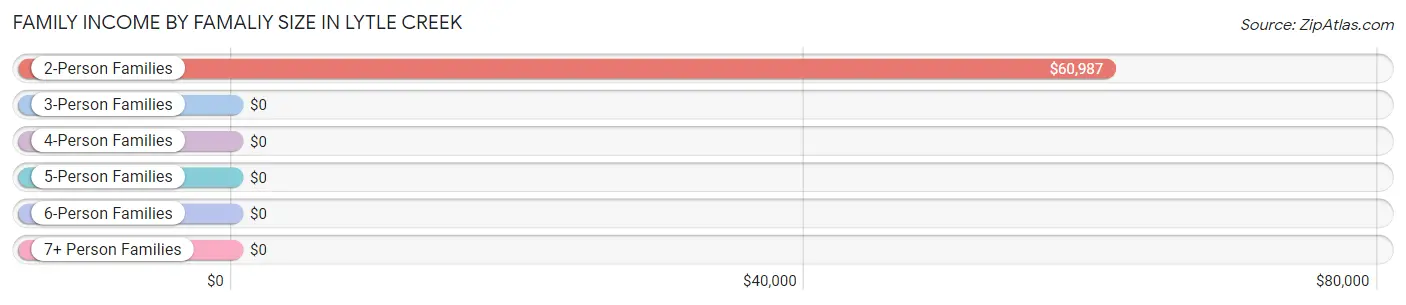
Family Income by Famaliy Size in Lytle Creek
2-person families (99 | 76.7%) account for the highest median family income in Lytle Creek with $60,987 per family, while 2-person families (99 | 76.7%) have the highest median income of $30,494 per family member.
| Income Bracket | # Families | Median Income |
| 2-Person Families | 99 (76.7%) | $60,987 |
| 3-Person Families | 23 (17.8%) | $0 |
| 4-Person Families | 7 (5.4%) | $0 |
| 5-Person Families | 0 (0.0%) | $0 |
| 6-Person Families | 0 (0.0%) | $0 |
| 7+ Person Families | 0 (0.0%) | $0 |
| Total | 129 (100.0%) | $62,039 |
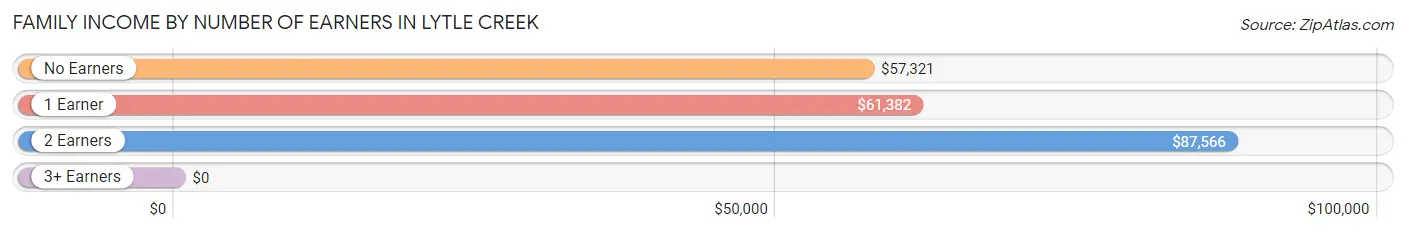
Family Income by Number of Earners in Lytle Creek
| Number of Earners | # Families | Median Income |
| No Earners | 41 (31.8%) | $57,321 |
| 1 Earner | 35 (27.1%) | $61,382 |
| 2 Earners | 53 (41.1%) | $87,566 |
| 3+ Earners | 0 (0.0%) | $0 |
| Total | 129 (100.0%) | $62,039 |
Household Income in Lytle Creek
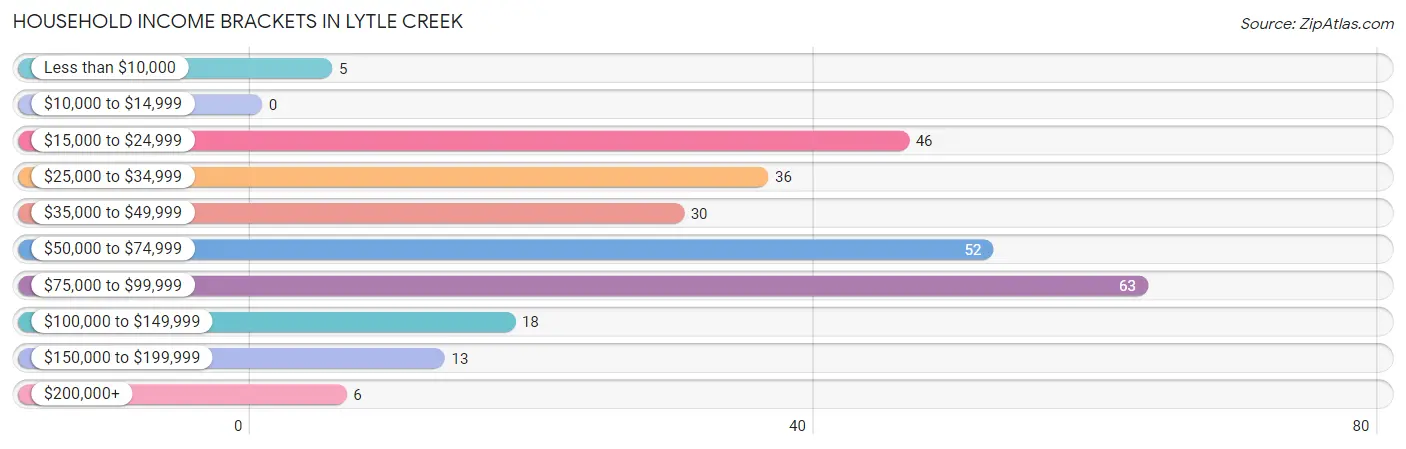
Household Income Brackets in Lytle Creek
With 63 households falling in the category, the $75,000 to $99,999 income range is the most frequent in Lytle Creek, accounting for 23.4% of all households.
| Income Bracket | # Households | % Households |
| Less than $10,000 | 5 | 1.9% |
| $10,000 to $14,999 | 0 | 0.0% |
| $15,000 to $24,999 | 46 | 17.1% |
| $25,000 to $34,999 | 36 | 13.4% |
| $35,000 to $49,999 | 30 | 11.2% |
| $50,000 to $74,999 | 52 | 19.3% |
| $75,000 to $99,999 | 63 | 23.4% |
| $100,000 to $149,999 | 18 | 6.7% |
| $150,000 to $199,999 | 13 | 4.8% |
| $200,000+ | 6 | 2.2% |
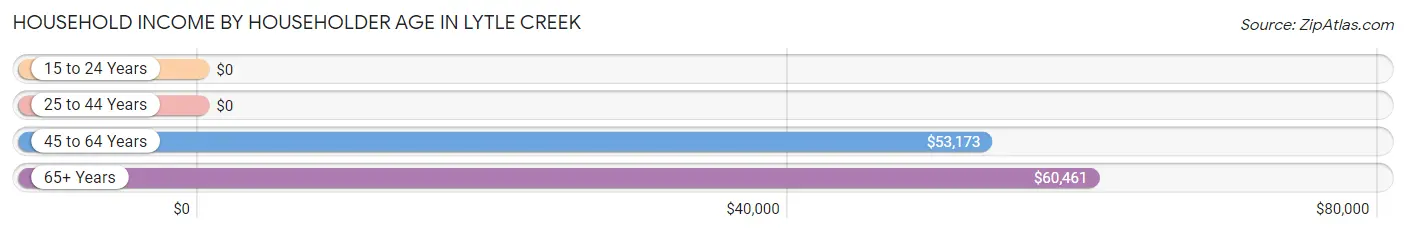
Household Income by Householder Age in Lytle Creek
The median household income in Lytle Creek is $56,607, with the highest median household income of $60,461 found in the 65+ years age bracket for the primary householder. A total of 103 households (38.3%) fall into this category.
| Income Bracket | # Households | Median Income |
| 15 to 24 Years | 0 (0.0%) | $0 |
| 25 to 44 Years | 49 (18.2%) | $0 |
| 45 to 64 Years | 117 (43.5%) | $53,173 |
| 65+ Years | 103 (38.3%) | $60,461 |
| Total | 269 (100.0%) | $56,607 |
Poverty in Lytle Creek
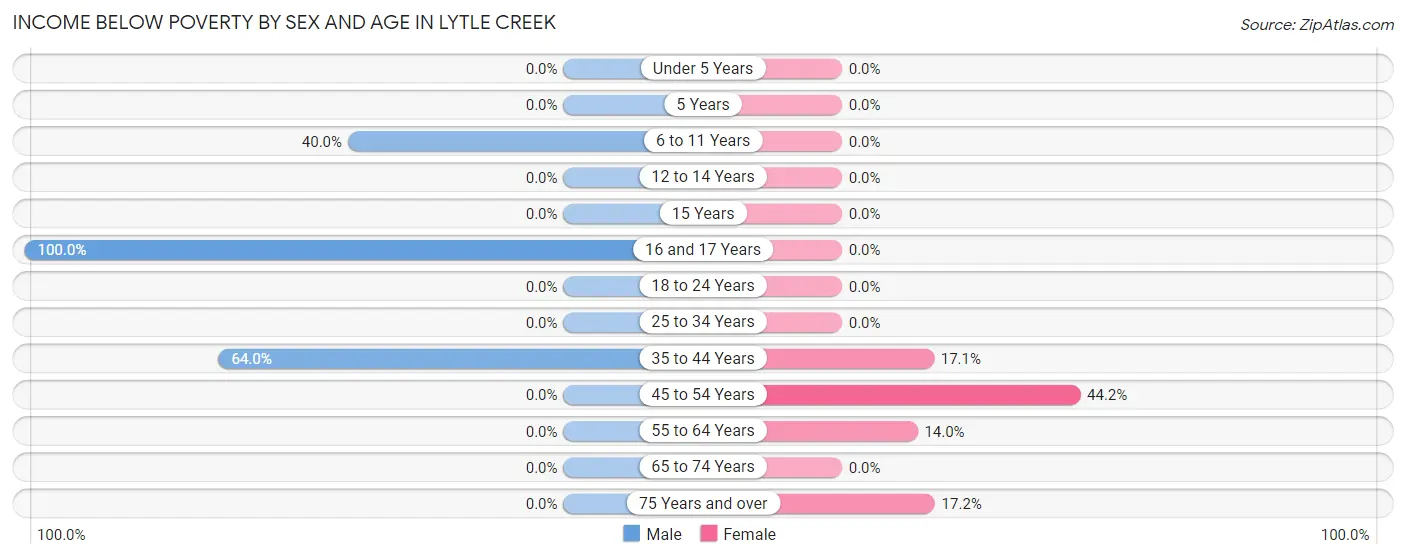
Income Below Poverty by Sex and Age in Lytle Creek
With 18.3% poverty level for males and 18.1% for females among the residents of Lytle Creek, 16 and 17 year old males and 45 to 54 year old females are the most vulnerable to poverty, with 7 males (100.0%) and 23 females (44.2%) in their respective age groups living below the poverty level.
| Age Bracket | Male | Female |
| Under 5 Years | 0 (0.0%) | 0 (0.0%) |
| 5 Years | 0 (0.0%) | 0 (0.0%) |
| 6 to 11 Years | 14 (40.0%) | 0 (0.0%) |
| 12 to 14 Years | 0 (0.0%) | 0 (0.0%) |
| 15 Years | 0 (0.0%) | 0 (0.0%) |
| 16 and 17 Years | 7 (100.0%) | 0 (0.0%) |
| 18 to 24 Years | 0 (0.0%) | 0 (0.0%) |
| 25 to 34 Years | 0 (0.0%) | 0 (0.0%) |
| 35 to 44 Years | 32 (64.0%) | 7 (17.1%) |
| 45 to 54 Years | 0 (0.0%) | 23 (44.2%) |
| 55 to 64 Years | 0 (0.0%) | 8 (14.0%) |
| 65 to 74 Years | 0 (0.0%) | 0 (0.0%) |
| 75 Years and over | 0 (0.0%) | 5 (17.2%) |
| Total | 53 (18.3%) | 43 (18.1%) |
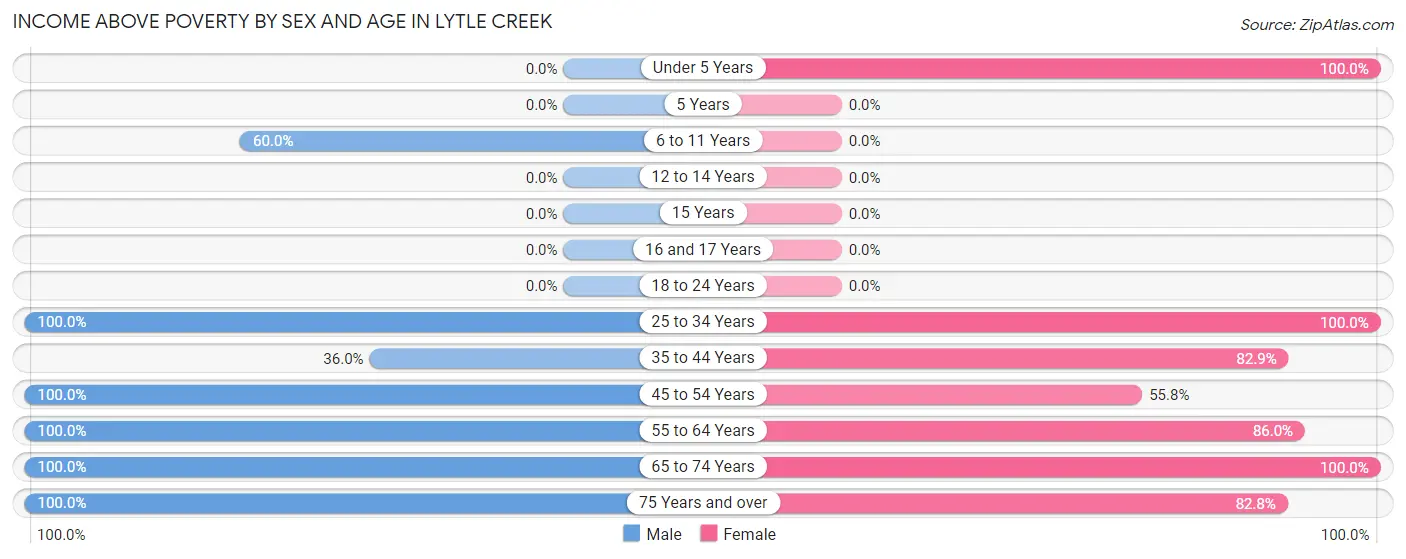
Income Above Poverty by Sex and Age in Lytle Creek
According to the poverty statistics in Lytle Creek, males aged 25 to 34 years and females aged under 5 years are the age groups that are most secure financially, with 100.0% of males and 100.0% of females in these age groups living above the poverty line.
| Age Bracket | Male | Female |
| Under 5 Years | 0 (0.0%) | 7 (100.0%) |
| 5 Years | 0 (0.0%) | 0 (0.0%) |
| 6 to 11 Years | 21 (60.0%) | 0 (0.0%) |
| 12 to 14 Years | 0 (0.0%) | 0 (0.0%) |
| 15 Years | 0 (0.0%) | 0 (0.0%) |
| 16 and 17 Years | 0 (0.0%) | 0 (0.0%) |
| 18 to 24 Years | 0 (0.0%) | 0 (0.0%) |
| 25 to 34 Years | 31 (100.0%) | 10 (100.0%) |
| 35 to 44 Years | 18 (36.0%) | 34 (82.9%) |
| 45 to 54 Years | 41 (100.0%) | 29 (55.8%) |
| 55 to 64 Years | 59 (100.0%) | 49 (86.0%) |
| 65 to 74 Years | 47 (100.0%) | 42 (100.0%) |
| 75 Years and over | 20 (100.0%) | 24 (82.8%) |
| Total | 237 (81.7%) | 195 (81.9%) |
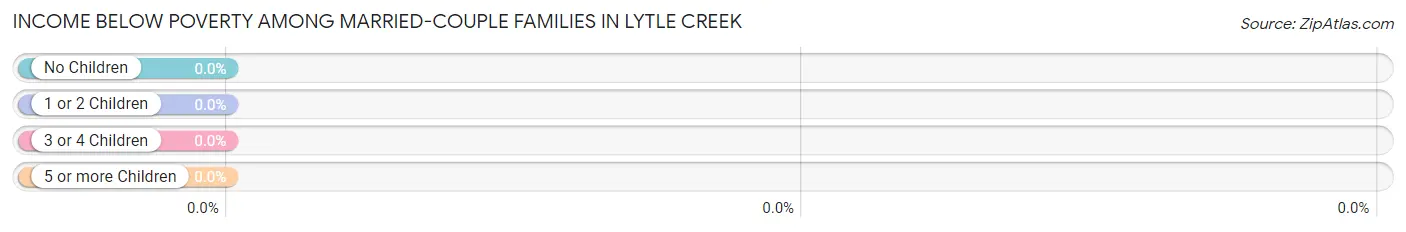
Income Below Poverty Among Married-Couple Families in Lytle Creek
| Children | Above Poverty | Below Poverty |
| No Children | 81 (100.0%) | 0 (0.0%) |
| 1 or 2 Children | 23 (100.0%) | 0 (0.0%) |
| 3 or 4 Children | 0 (0.0%) | 0 (0.0%) |
| 5 or more Children | 0 (0.0%) | 0 (0.0%) |
| Total | 104 (100.0%) | 0 (0.0%) |
Income Below Poverty Among Single-Parent Households in Lytle Creek
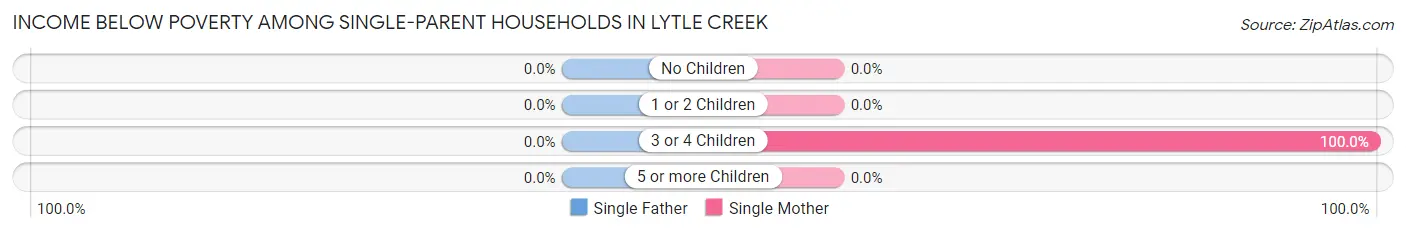
| Children | Single Father | Single Mother |
| No Children | 0 (0.0%) | 0 (0.0%) |
| 1 or 2 Children | 0 (0.0%) | 0 (0.0%) |
| 3 or 4 Children | 0 (0.0%) | 7 (100.0%) |
| 5 or more Children | 0 (0.0%) | 0 (0.0%) |
| Total | 0 (0.0%) | 7 (35.0%) |
Income Below Poverty Among Married-Couple vs Single-Parent Households in Lytle Creek
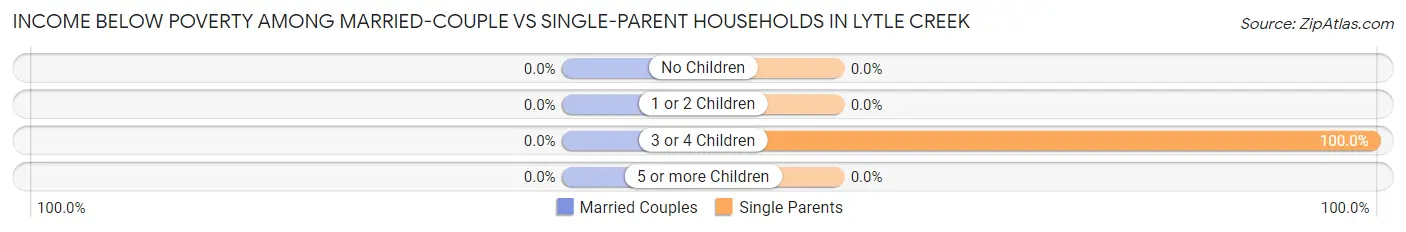
| Children | Married-Couple Families | Single-Parent Households |
| No Children | 0 (0.0%) | 0 (0.0%) |
| 1 or 2 Children | 0 (0.0%) | 0 (0.0%) |
| 3 or 4 Children | 0 (0.0%) | 7 (100.0%) |
| 5 or more Children | 0 (0.0%) | 0 (0.0%) |
| Total | 0 (0.0%) | 7 (28.0%) |
Race in Lytle Creek
The most populous races in Lytle Creek are White / Caucasian (496 | 93.9%), Hispanic or Latino (76 | 14.4%), and Asian (32 | 6.1%).
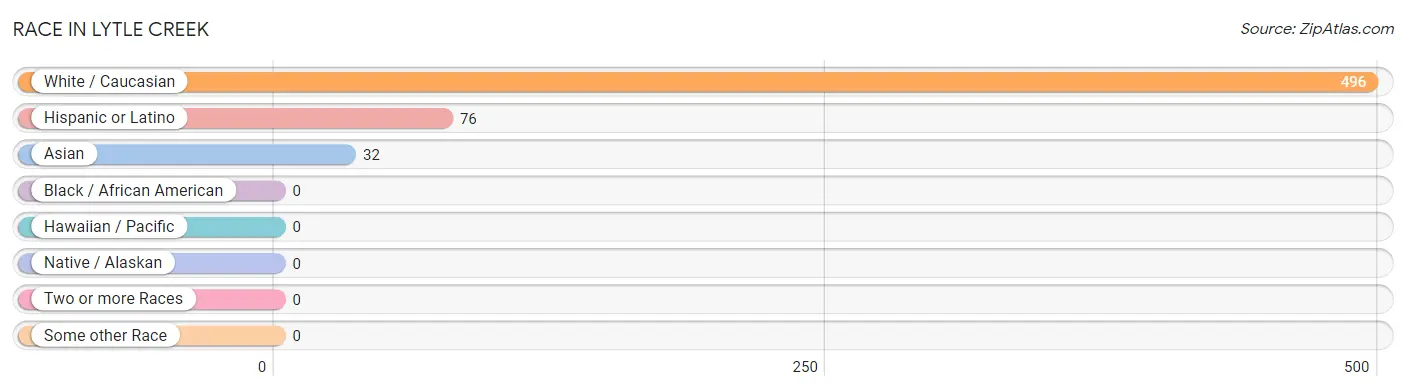
| Race | # Population | % Population |
| Asian | 32 | 6.1% |
| Black / African American | 0 | 0.0% |
| Hawaiian / Pacific | 0 | 0.0% |
| Hispanic or Latino | 76 | 14.4% |
| Native / Alaskan | 0 | 0.0% |
| White / Caucasian | 496 | 93.9% |
| Two or more Races | 0 | 0.0% |
| Some other Race | 0 | 0.0% |
| Total | 528 | 100.0% |
Ancestry in Lytle Creek
The most populous ancestries reported in Lytle Creek are English (95 | 18.0%), Mexican (76 | 14.4%), Italian (67 | 12.7%), German (55 | 10.4%), and Irish (27 | 5.1%), together accounting for 60.6% of all Lytle Creek residents.
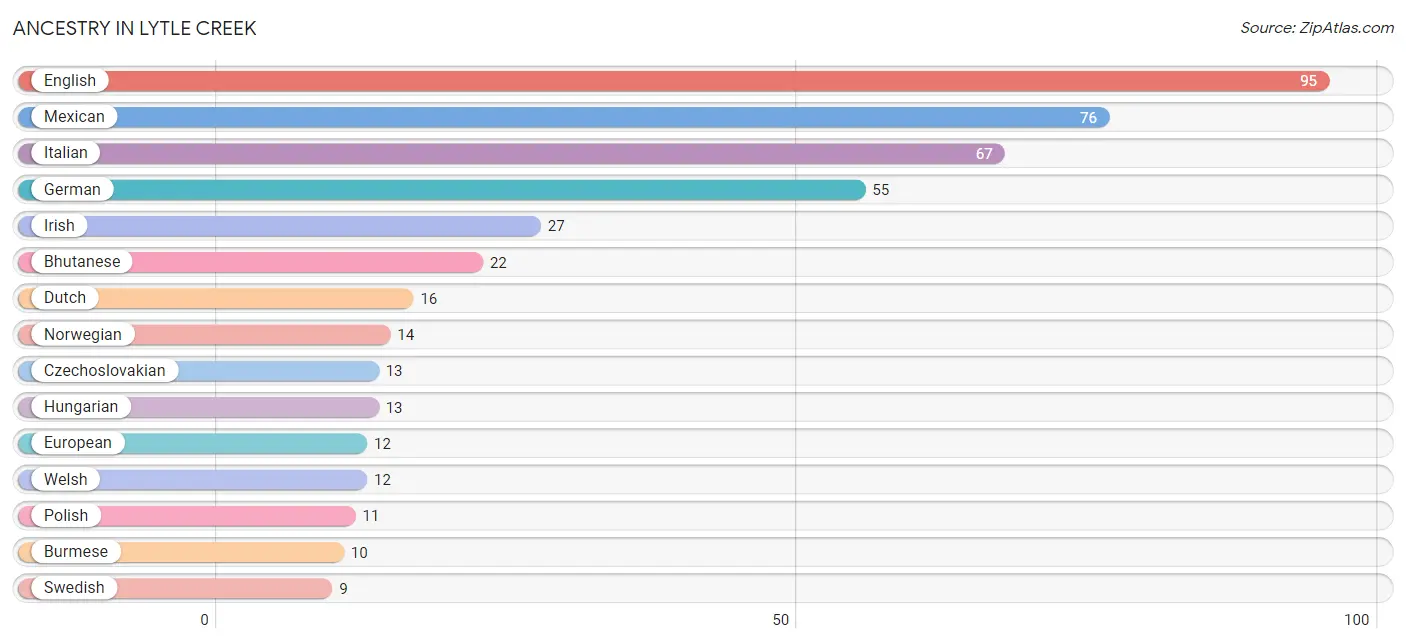
| Ancestry | # Population | % Population |
| American | 5 | 0.9% |
| Bhutanese | 22 | 4.2% |
| Burmese | 10 | 1.9% |
| Czechoslovakian | 13 | 2.5% |
| Dutch | 16 | 3.0% |
| English | 95 | 18.0% |
| European | 12 | 2.3% |
| French | 8 | 1.5% |
| German | 55 | 10.4% |
| Hungarian | 13 | 2.5% |
| Irish | 27 | 5.1% |
| Italian | 67 | 12.7% |
| Mexican | 76 | 14.4% |
| Norwegian | 14 | 2.6% |
| Polish | 11 | 2.1% |
| Scotch-Irish | 5 | 0.9% |
| Scottish | 8 | 1.5% |
| Swedish | 9 | 1.7% |
| Welsh | 12 | 2.3% | View All 19 Rows |
Immigrants in Lytle Creek
The most numerous immigrant groups reported in Lytle Creek came from Central America (20 | 3.8%), Latin America (20 | 3.8%), Mexico (20 | 3.8%), Asia (5 | 0.9%), and Eastern Asia (5 | 0.9%), together accounting for 13.3% of all Lytle Creek residents.
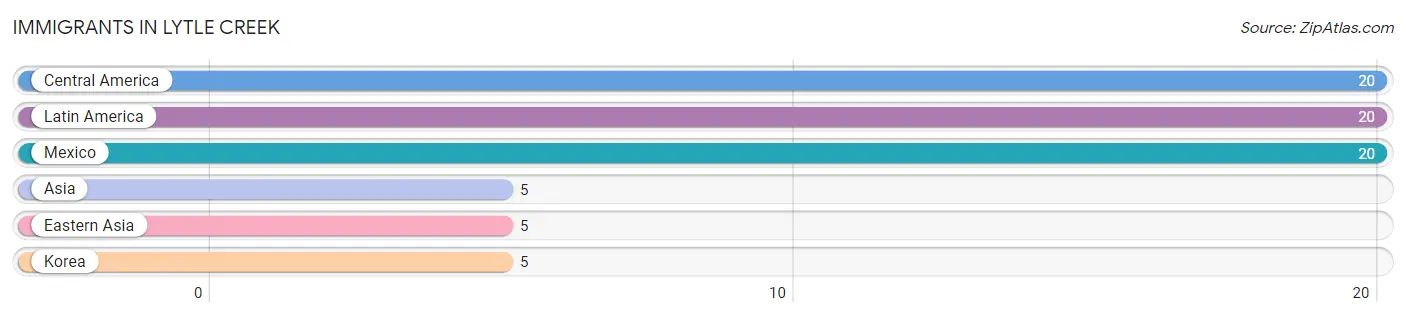
| Immigration Origin | # Population | % Population |
| Asia | 5 | 0.9% |
| Central America | 20 | 3.8% |
| Eastern Asia | 5 | 0.9% |
| Korea | 5 | 0.9% |
| Latin America | 20 | 3.8% |
| Mexico | 20 | 3.8% | View All 6 Rows |
Sex and Age in Lytle Creek
Sex and Age in Lytle Creek
The most populous age groups in Lytle Creek are 35 to 39 Years (50 | 17.2%) for men and 65 to 69 Years (37 | 15.5%) for women.
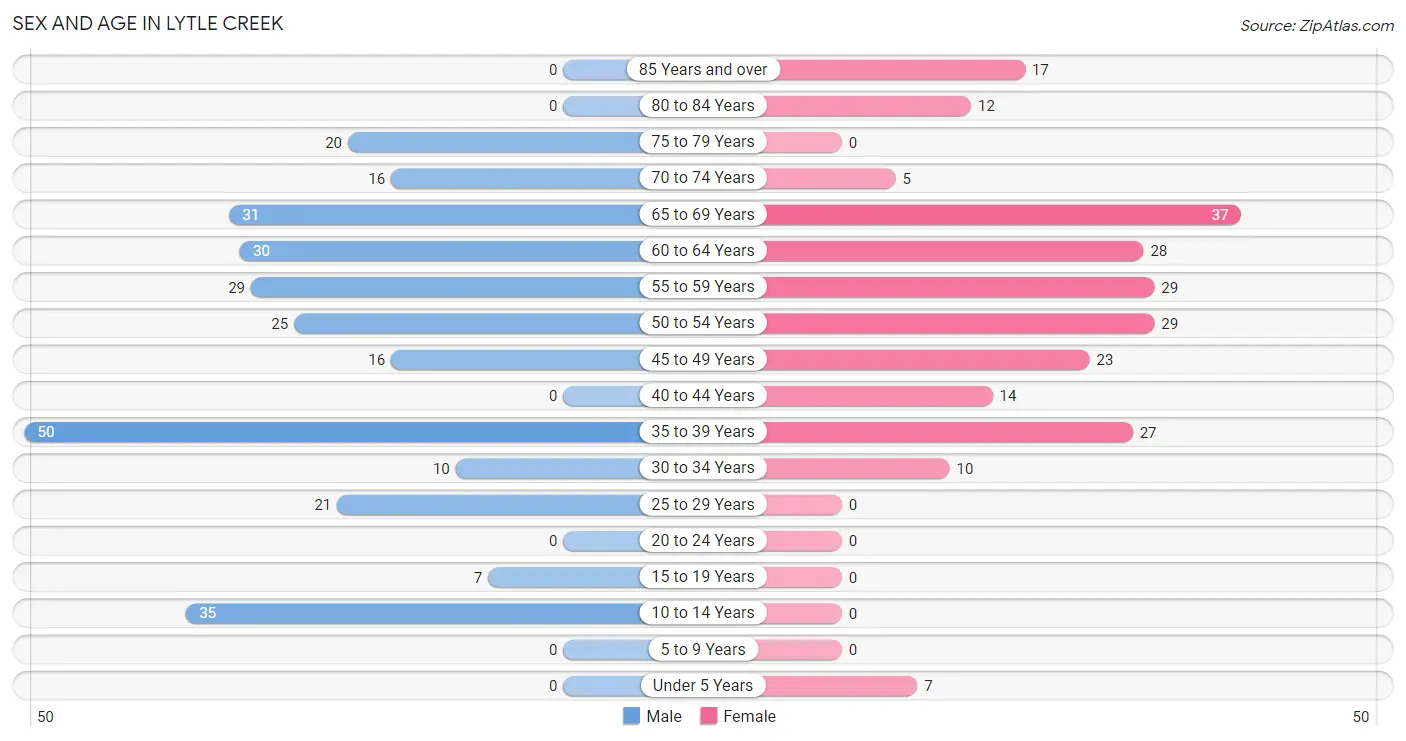
| Age Bracket | Male | Female |
| Under 5 Years | 0 (0.0%) | 7 (2.9%) |
| 5 to 9 Years | 0 (0.0%) | 0 (0.0%) |
| 10 to 14 Years | 35 (12.1%) | 0 (0.0%) |
| 15 to 19 Years | 7 (2.4%) | 0 (0.0%) |
| 20 to 24 Years | 0 (0.0%) | 0 (0.0%) |
| 25 to 29 Years | 21 (7.2%) | 0 (0.0%) |
| 30 to 34 Years | 10 (3.5%) | 10 (4.2%) |
| 35 to 39 Years | 50 (17.2%) | 27 (11.3%) |
| 40 to 44 Years | 0 (0.0%) | 14 (5.9%) |
| 45 to 49 Years | 16 (5.5%) | 23 (9.7%) |
| 50 to 54 Years | 25 (8.6%) | 29 (12.2%) |
| 55 to 59 Years | 29 (10.0%) | 29 (12.2%) |
| 60 to 64 Years | 30 (10.3%) | 28 (11.8%) |
| 65 to 69 Years | 31 (10.7%) | 37 (15.5%) |
| 70 to 74 Years | 16 (5.5%) | 5 (2.1%) |
| 75 to 79 Years | 20 (6.9%) | 0 (0.0%) |
| 80 to 84 Years | 0 (0.0%) | 12 (5.0%) |
| 85 Years and over | 0 (0.0%) | 17 (7.1%) |
| Total | 290 (100.0%) | 238 (100.0%) |
Families and Households in Lytle Creek
Median Family Size in Lytle Creek
The median family size in Lytle Creek is 2.35 persons per family, with single female/mother families (20 | 15.5%) accounting for the largest median family size of 2.85 persons per family. On the other hand, single male/father families (5 | 3.9%) represent the smallest median family size with 2.00 persons per family.
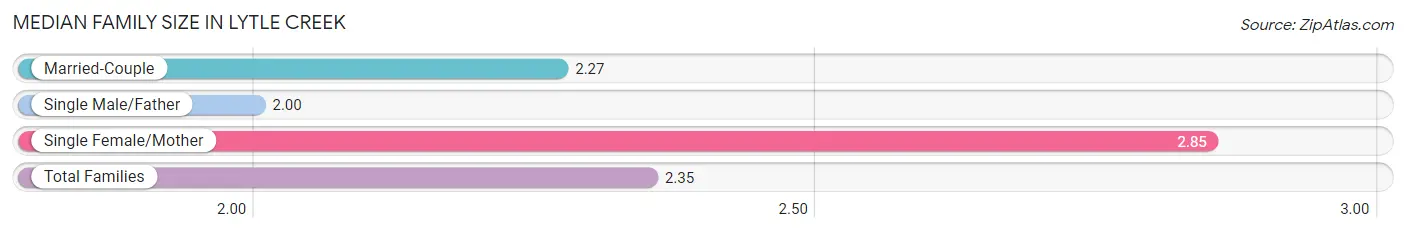
| Family Type | # Families | Family Size |
| Married-Couple | 104 (80.6%) | 2.27 |
| Single Male/Father | 5 (3.9%) | 2.00 |
| Single Female/Mother | 20 (15.5%) | 2.85 |
| Total Families | 129 (100.0%) | 2.35 |
Median Household Size in Lytle Creek
The median household size in Lytle Creek is 1.84 persons per household, with single female/mother households (20 | 7.4%) accounting for the largest median household size of 2.85 persons per household. non-family households (140 | 52.0%) represent the smallest median household size with 1.38 persons per household.
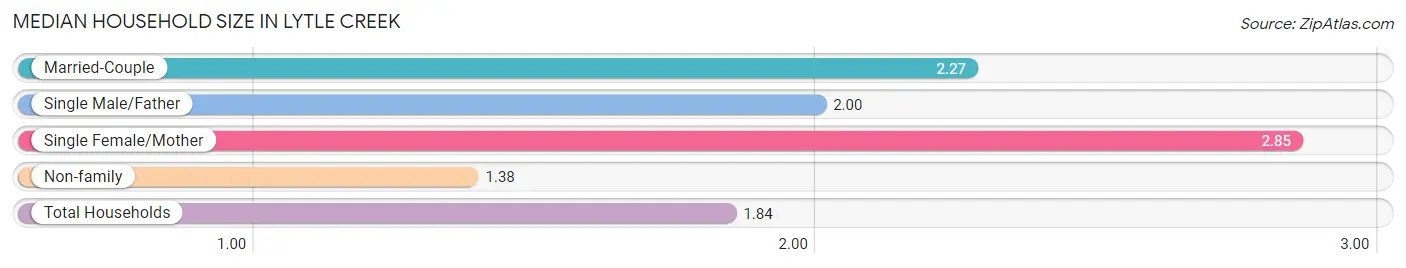
| Household Type | # Households | Household Size |
| Married-Couple | 104 (38.7%) | 2.27 |
| Single Male/Father | 5 (1.9%) | 2.00 |
| Single Female/Mother | 20 (7.4%) | 2.85 |
| Non-family | 140 (52.0%) | 1.38 |
| Total Households | 269 (100.0%) | 1.84 |
Household Size by Marriage Status in Lytle Creek
Out of a total of 269 households in Lytle Creek, 129 (48.0%) are family households, while 140 (52.0%) are nonfamily households. The most numerous type of family households are 2-person households, comprising 99, and the most common type of nonfamily households are 1-person households, comprising 91.
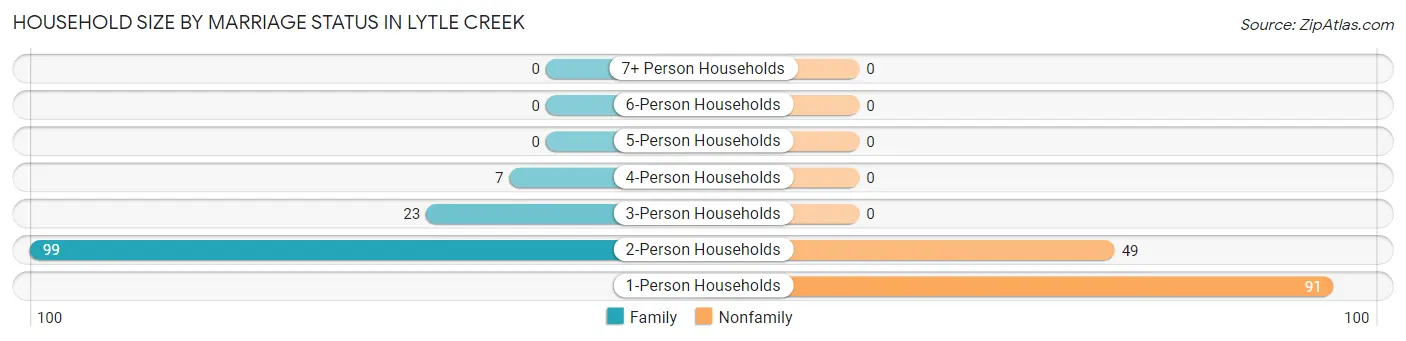
| Household Size | Family Households | Nonfamily Households |
| 1-Person Households | - | 91 (33.8%) |
| 2-Person Households | 99 (36.8%) | 49 (18.2%) |
| 3-Person Households | 23 (8.6%) | 0 (0.0%) |
| 4-Person Households | 7 (2.6%) | 0 (0.0%) |
| 5-Person Households | 0 (0.0%) | 0 (0.0%) |
| 6-Person Households | 0 (0.0%) | 0 (0.0%) |
| 7+ Person Households | 0 (0.0%) | 0 (0.0%) |
| Total | 129 (48.0%) | 140 (52.0%) |
Female Fertility in Lytle Creek
Fertility by Age in Lytle Creek
| Age Bracket | Women with Births | Births / 1,000 Women |
| 15 to 19 years | 0 (0.0%) | 0.0 |
| 20 to 34 years | 0 (0.0%) | 0.0 |
| 35 to 50 years | 0 (0.0%) | 0.0 |
| Total | 0 (0.0%) | 0.0 |
Fertility by Age by Marriage Status in Lytle Creek
| Age Bracket | Married | Unmarried |
| 15 to 19 years | 0 (0.0%) | 0 (0.0%) |
| 20 to 34 years | 0 (0.0%) | 0 (0.0%) |
| 35 to 50 years | 0 (0.0%) | 0 (0.0%) |
| Total | 0 (0.0%) | 0 (0.0%) |
Fertility by Education in Lytle Creek
| Educational Attainment | Women with Births | Births / 1,000 Women |
| Less than High School | 0 (0.0%) | 0.0 |
| High School Diploma | 0 (0.0%) | 0.0 |
| College or Associate's Degree | 0 (0.0%) | 0.0 |
| Bachelor's Degree | 0 (0.0%) | 0.0 |
| Graduate Degree | 0 (0.0%) | 0.0 |
| Total | 0 (0.0%) | 0.0 |
Fertility by Education by Marriage Status in Lytle Creek
| Educational Attainment | Married | Unmarried |
| Less than High School | 0 (0.0%) | 0 (0.0%) |
| High School Diploma | 0 (0.0%) | 0 (0.0%) |
| College or Associate's Degree | 0 (0.0%) | 0 (0.0%) |
| Bachelor's Degree | 0 (0.0%) | 0 (0.0%) |
| Graduate Degree | 0 (0.0%) | 0 (0.0%) |
| Total | 0 (0.0%) | 0 (0.0%) |
Employment Characteristics in Lytle Creek
Employment by Class of Employer in Lytle Creek
Among the 221 employed individuals in Lytle Creek, private company employees (116 | 52.5%), self-employed (not incorporated) (32 | 14.5%), and not-for-profit organizations (31 | 14.0%) make up the most common classes of employment.
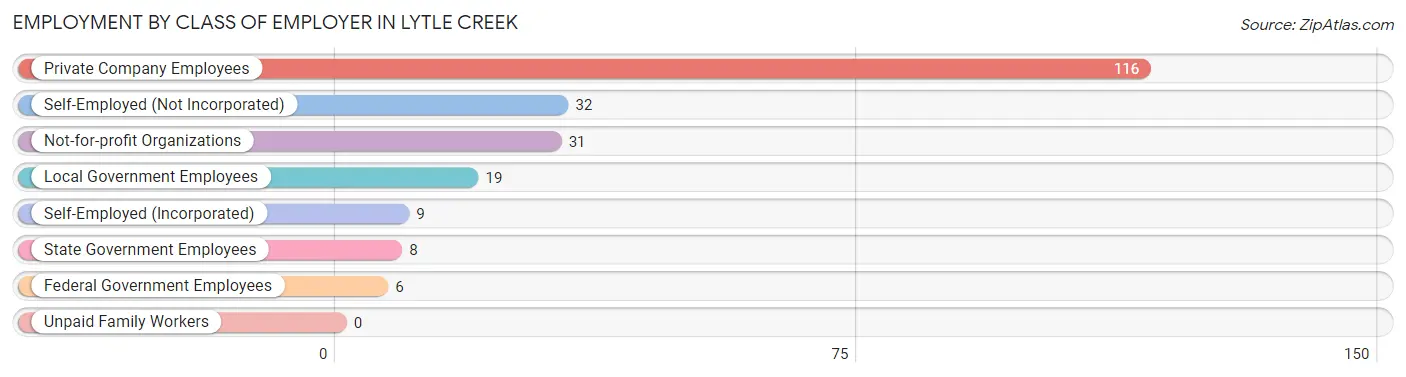
| Employer Class | # Employees | % Employees |
| Private Company Employees | 116 | 52.5% |
| Self-Employed (Incorporated) | 9 | 4.1% |
| Self-Employed (Not Incorporated) | 32 | 14.5% |
| Not-for-profit Organizations | 31 | 14.0% |
| Local Government Employees | 19 | 8.6% |
| State Government Employees | 8 | 3.6% |
| Federal Government Employees | 6 | 2.7% |
| Unpaid Family Workers | 0 | 0.0% |
| Total | 221 | 100.0% |
Employment Status by Age in Lytle Creek
According to the labor force statistics for Lytle Creek, out of the total population over 16 years of age (486), 51.9% or 252 individuals are in the labor force, with 12.3% or 31 of them unemployed. The age group with the highest labor force participation rate is 25 to 29 years, with 100.0% or 21 individuals in the labor force. Within the labor force, the 55 to 59 years age range has the highest percentage of unemployed individuals, with 61.9% or 26 of them being unemployed.
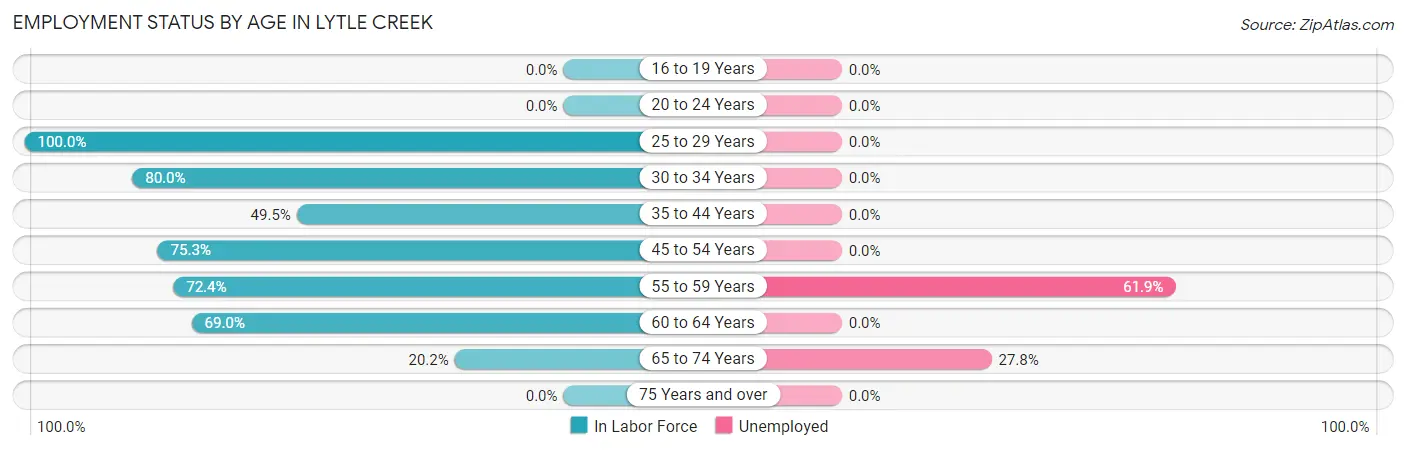
| Age Bracket | In Labor Force | Unemployed |
| 16 to 19 Years | 0 (0.0%) | 0 (0.0%) |
| 20 to 24 Years | 0 (0.0%) | 0 (0.0%) |
| 25 to 29 Years | 21 (100.0%) | 0 (0.0%) |
| 30 to 34 Years | 16 (80.0%) | 0 (0.0%) |
| 35 to 44 Years | 45 (49.5%) | 0 (0.0%) |
| 45 to 54 Years | 70 (75.3%) | 0 (0.0%) |
| 55 to 59 Years | 42 (72.4%) | 26 (61.9%) |
| 60 to 64 Years | 40 (69.0%) | 0 (0.0%) |
| 65 to 74 Years | 18 (20.2%) | 5 (27.8%) |
| 75 Years and over | 0 (0.0%) | 0 (0.0%) |
| Total | 252 (51.9%) | 31 (12.3%) |
Employment Status by Educational Attainment in Lytle Creek
According to labor force statistics for Lytle Creek, 68.6% of individuals (234) out of the total population between 25 and 64 years of age (341) are in the labor force, with 11.1% or 26 of them being unemployed. The group with the highest labor force participation rate are those with the educational attainment of college / associate degree, with 78.4% or 134 individuals in the labor force. Within the labor force, individuals with college / associate degree education have the highest percentage of unemployment, with 19.4% or 26 of them being unemployed.
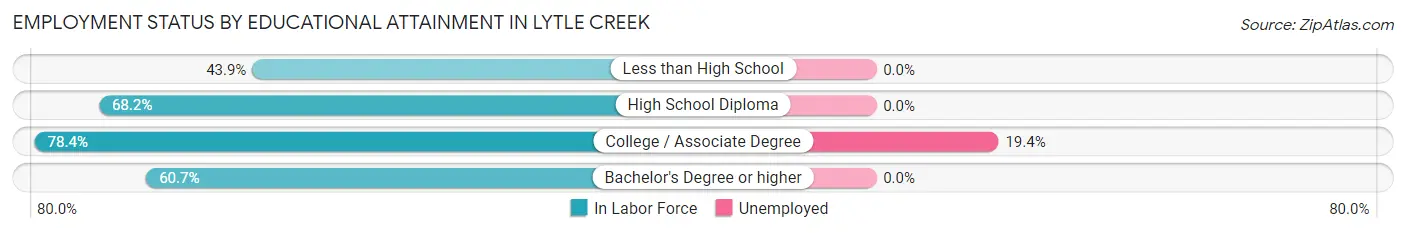
| Educational Attainment | In Labor Force | Unemployed |
| Less than High School | 25 (43.9%) | 0 (0.0%) |
| High School Diploma | 58 (68.2%) | 0 (0.0%) |
| College / Associate Degree | 134 (78.4%) | 33 (19.4%) |
| Bachelor's Degree or higher | 17 (60.7%) | 0 (0.0%) |
| Total | 234 (68.6%) | 38 (11.1%) |
Employment Occupations by Sex in Lytle Creek
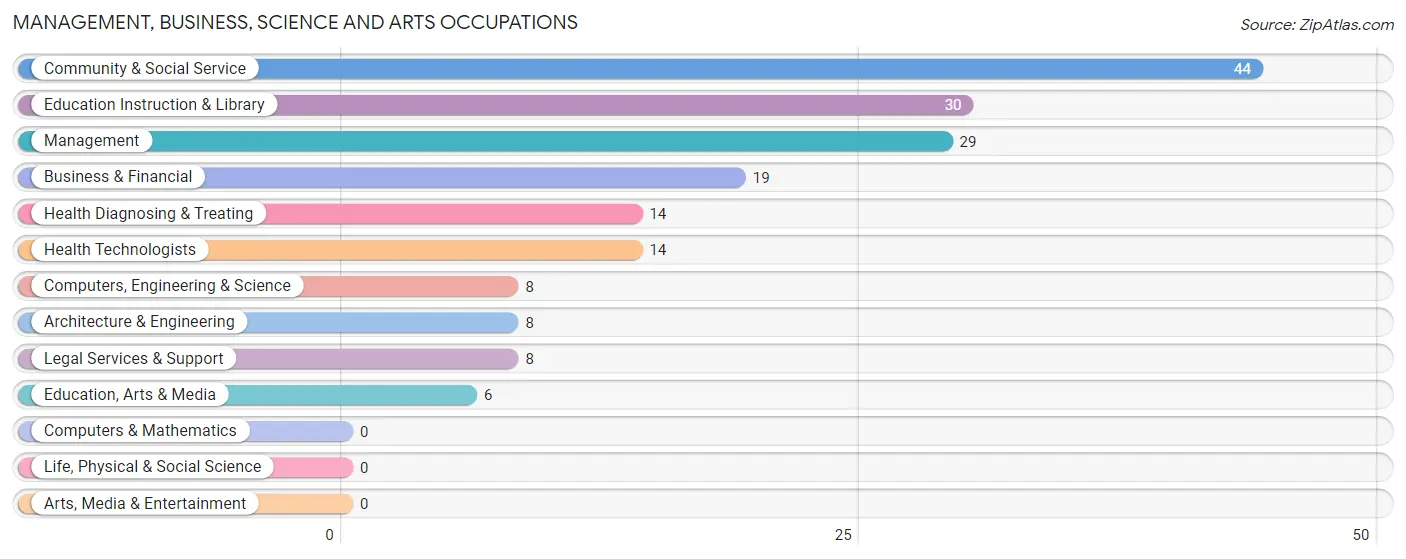
Management, Business, Science and Arts Occupations
The most common Management, Business, Science and Arts occupations in Lytle Creek are Community & Social Service (44 | 19.9%), Education Instruction & Library (30 | 13.6%), Management (29 | 13.1%), Business & Financial (19 | 8.6%), and Health Diagnosing & Treating (14 | 6.3%).
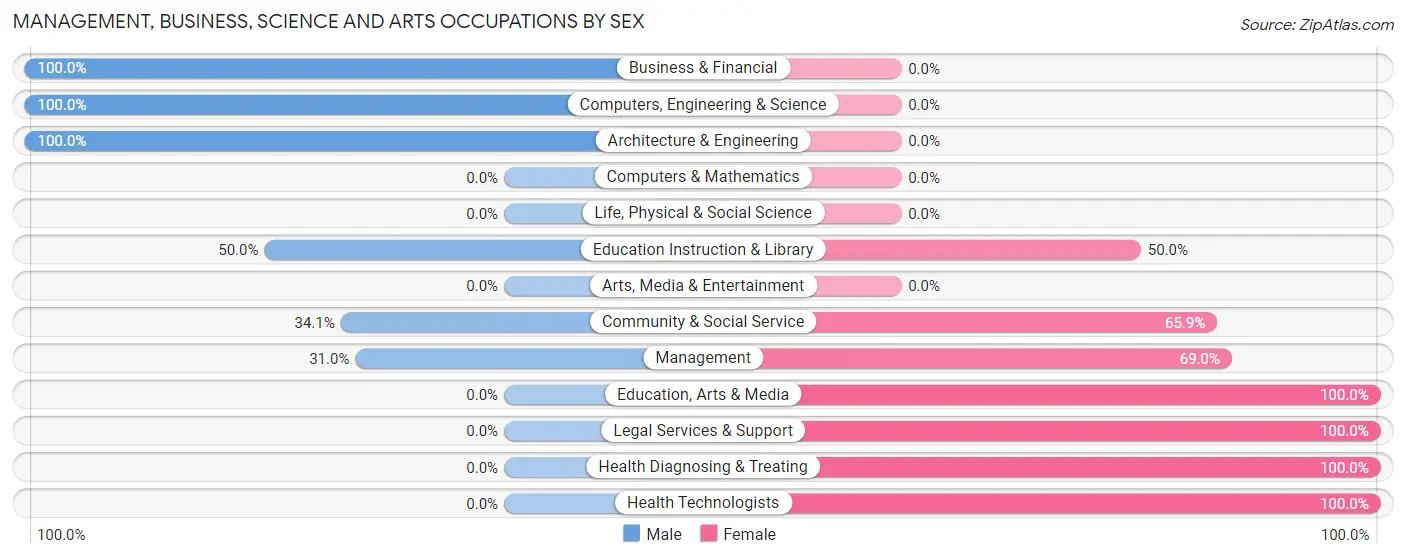
Management, Business, Science and Arts Occupations by Sex
Within the Management, Business, Science and Arts occupations in Lytle Creek, the most male-oriented occupations are Business & Financial (100.0%), Computers, Engineering & Science (100.0%), and Architecture & Engineering (100.0%), while the most female-oriented occupations are Education, Arts & Media (100.0%), Legal Services & Support (100.0%), and Health Diagnosing & Treating (100.0%).
| Occupation | Male | Female |
| Management | 9 (31.0%) | 20 (69.0%) |
| Business & Financial | 19 (100.0%) | 0 (0.0%) |
| Computers, Engineering & Science | 8 (100.0%) | 0 (0.0%) |
| Computers & Mathematics | 0 (0.0%) | 0 (0.0%) |
| Architecture & Engineering | 8 (100.0%) | 0 (0.0%) |
| Life, Physical & Social Science | 0 (0.0%) | 0 (0.0%) |
| Community & Social Service | 15 (34.1%) | 29 (65.9%) |
| Education, Arts & Media | 0 (0.0%) | 6 (100.0%) |
| Legal Services & Support | 0 (0.0%) | 8 (100.0%) |
| Education Instruction & Library | 15 (50.0%) | 15 (50.0%) |
| Arts, Media & Entertainment | 0 (0.0%) | 0 (0.0%) |
| Health Diagnosing & Treating | 0 (0.0%) | 14 (100.0%) |
| Health Technologists | 0 (0.0%) | 14 (100.0%) |
| Total (Category) | 51 (44.7%) | 63 (55.3%) |
| Total (Overall) | 107 (48.4%) | 114 (51.6%) |
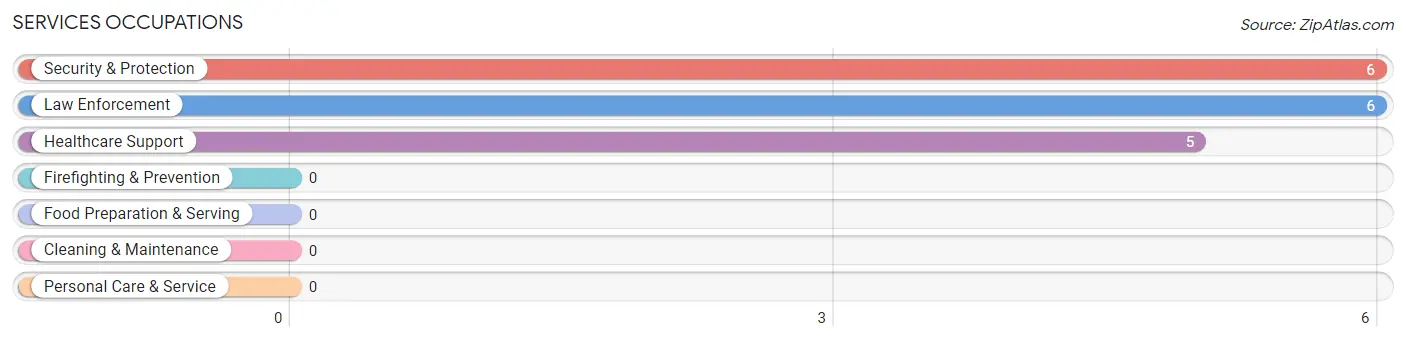
Services Occupations
The most common Services occupations in Lytle Creek are Security & Protection (6 | 2.7%), Law Enforcement (6 | 2.7%), and Healthcare Support (5 | 2.3%).
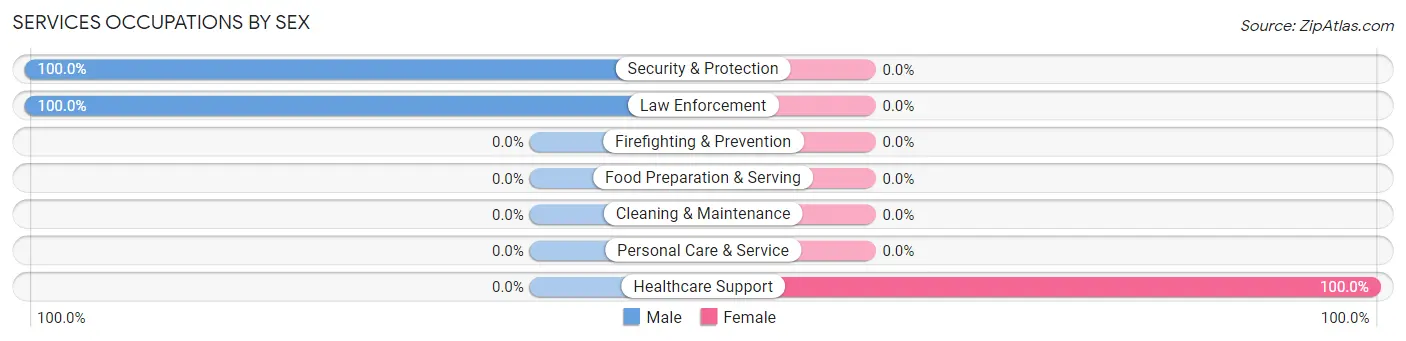
Services Occupations by Sex
| Occupation | Male | Female |
| Healthcare Support | 0 (0.0%) | 5 (100.0%) |
| Security & Protection | 6 (100.0%) | 0 (0.0%) |
| Firefighting & Prevention | 0 (0.0%) | 0 (0.0%) |
| Law Enforcement | 6 (100.0%) | 0 (0.0%) |
| Food Preparation & Serving | 0 (0.0%) | 0 (0.0%) |
| Cleaning & Maintenance | 0 (0.0%) | 0 (0.0%) |
| Personal Care & Service | 0 (0.0%) | 0 (0.0%) |
| Total (Category) | 6 (54.5%) | 5 (45.5%) |
| Total (Overall) | 107 (48.4%) | 114 (51.6%) |
Sales and Office Occupations
The most common Sales and Office occupations in Lytle Creek are Sales & Related (38 | 17.2%), and Office & Administration (33 | 14.9%).
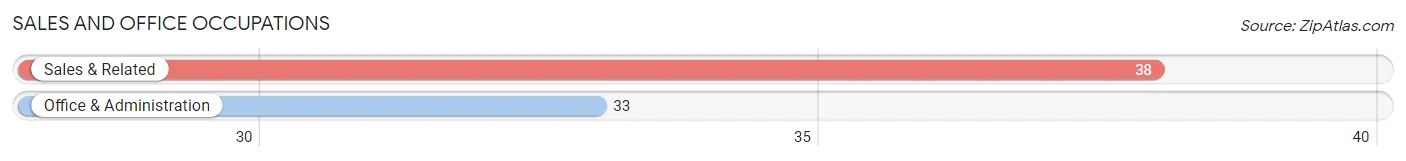
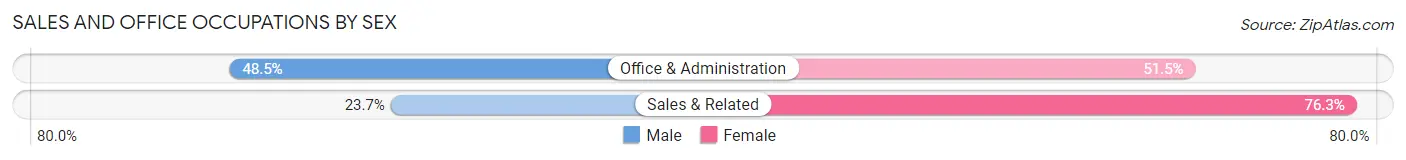
Sales and Office Occupations by Sex
| Occupation | Male | Female |
| Sales & Related | 9 (23.7%) | 29 (76.3%) |
| Office & Administration | 16 (48.5%) | 17 (51.5%) |
| Total (Category) | 25 (35.2%) | 46 (64.8%) |
| Total (Overall) | 107 (48.4%) | 114 (51.6%) |
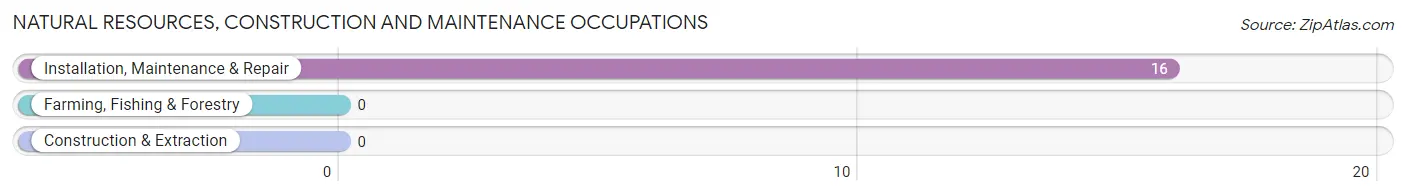
Natural Resources, Construction and Maintenance Occupations
The most common Natural Resources, Construction and Maintenance occupations in Lytle Creek are , and Installation, Maintenance & Repair (16 | 7.2%).
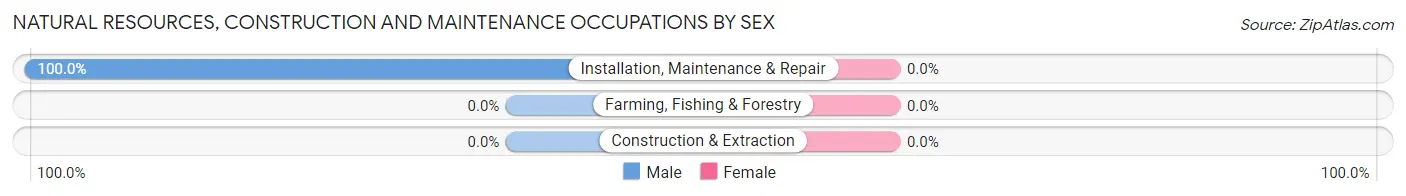
Natural Resources, Construction and Maintenance Occupations by Sex
| Occupation | Male | Female |
| Farming, Fishing & Forestry | 0 (0.0%) | 0 (0.0%) |
| Construction & Extraction | 0 (0.0%) | 0 (0.0%) |
| Installation, Maintenance & Repair | 16 (100.0%) | 0 (0.0%) |
| Total (Category) | 16 (100.0%) | 0 (0.0%) |
| Total (Overall) | 107 (48.4%) | 114 (51.6%) |
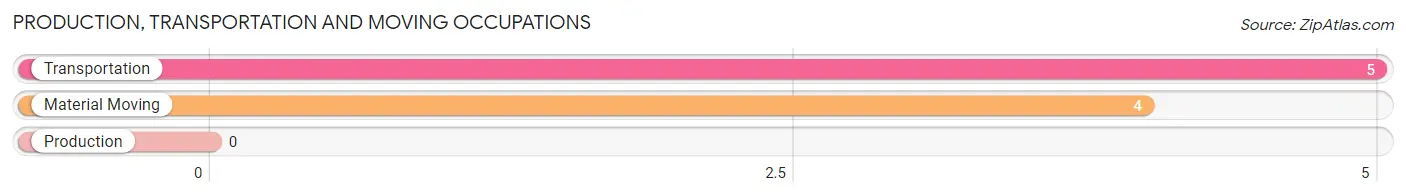
Production, Transportation and Moving Occupations
The most common Production, Transportation and Moving occupations in Lytle Creek are Transportation (5 | 2.3%), and Material Moving (4 | 1.8%).
Production, Transportation and Moving Occupations by Sex
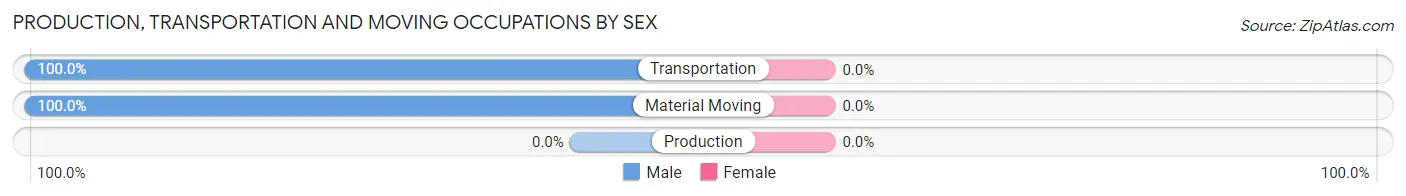
| Occupation | Male | Female |
| Production | 0 (0.0%) | 0 (0.0%) |
| Transportation | 5 (100.0%) | 0 (0.0%) |
| Material Moving | 4 (100.0%) | 0 (0.0%) |
| Total (Category) | 9 (100.0%) | 0 (0.0%) |
| Total (Overall) | 107 (48.4%) | 114 (51.6%) |
Employment Industries by Sex in Lytle Creek
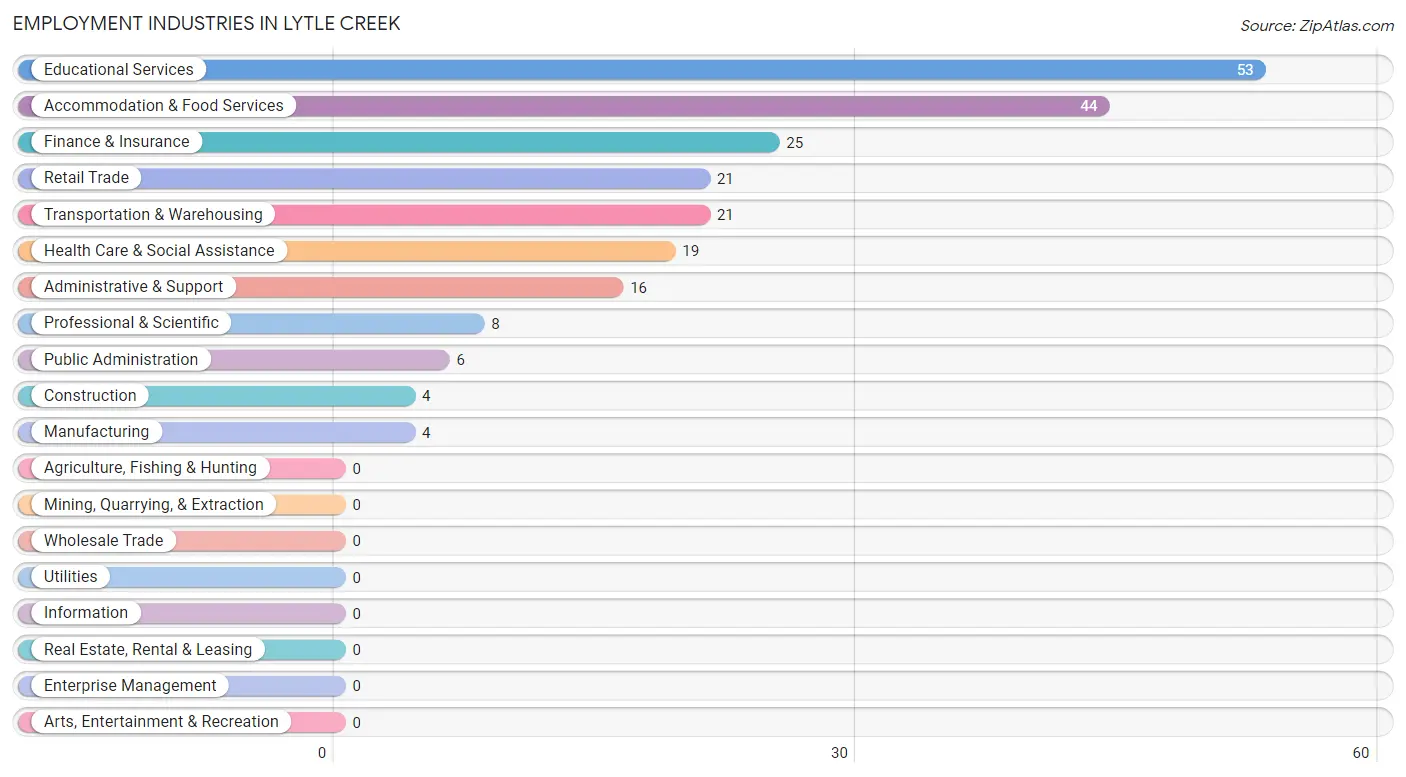
Employment Industries in Lytle Creek
The major employment industries in Lytle Creek include Educational Services (53 | 24.0%), Accommodation & Food Services (44 | 19.9%), Finance & Insurance (25 | 11.3%), Retail Trade (21 | 9.5%), and Transportation & Warehousing (21 | 9.5%).
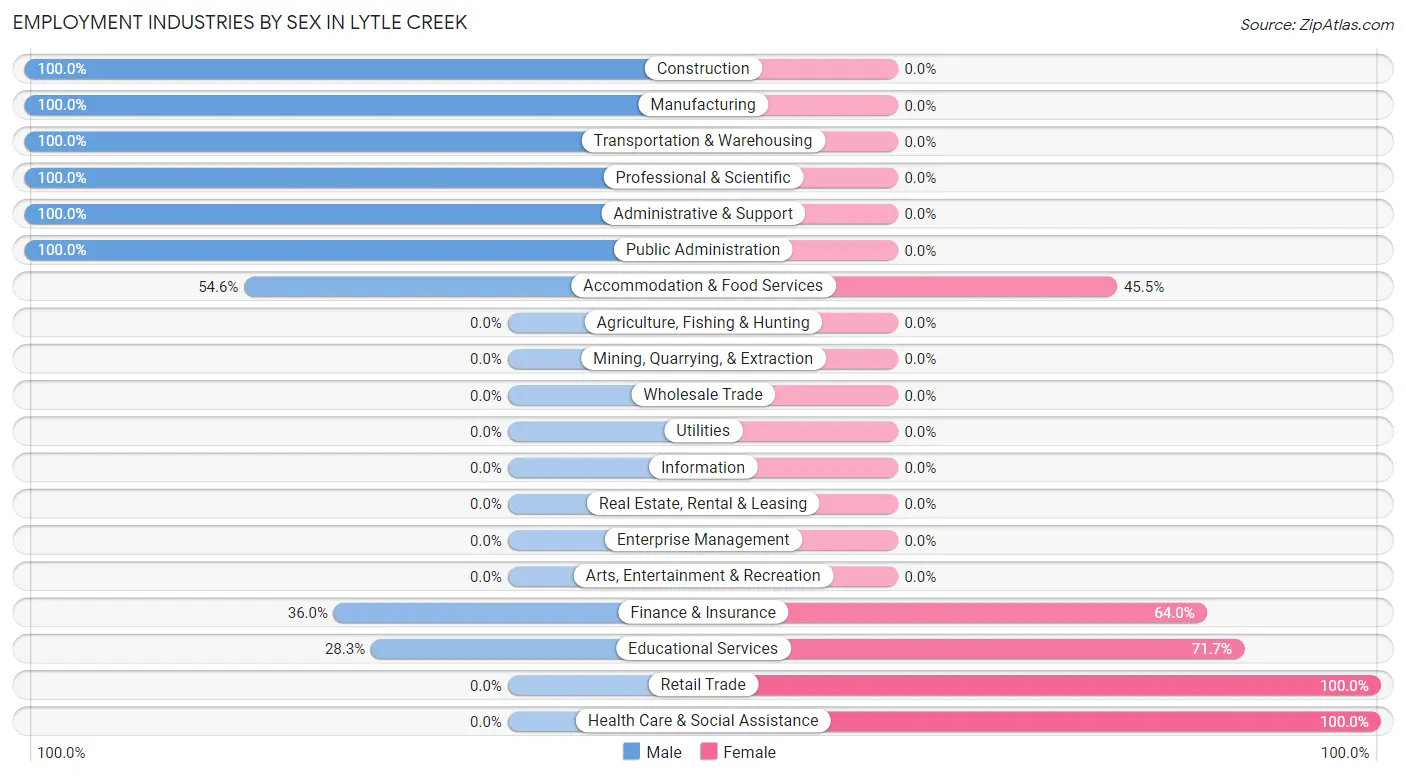
Employment Industries by Sex in Lytle Creek
The Lytle Creek industries that see more men than women are Construction (100.0%), Manufacturing (100.0%), and Transportation & Warehousing (100.0%), whereas the industries that tend to have a higher number of women are Retail Trade (100.0%), Health Care & Social Assistance (100.0%), and Educational Services (71.7%).
| Industry | Male | Female |
| Agriculture, Fishing & Hunting | 0 (0.0%) | 0 (0.0%) |
| Mining, Quarrying, & Extraction | 0 (0.0%) | 0 (0.0%) |
| Construction | 4 (100.0%) | 0 (0.0%) |
| Manufacturing | 4 (100.0%) | 0 (0.0%) |
| Wholesale Trade | 0 (0.0%) | 0 (0.0%) |
| Retail Trade | 0 (0.0%) | 21 (100.0%) |
| Transportation & Warehousing | 21 (100.0%) | 0 (0.0%) |
| Utilities | 0 (0.0%) | 0 (0.0%) |
| Information | 0 (0.0%) | 0 (0.0%) |
| Finance & Insurance | 9 (36.0%) | 16 (64.0%) |
| Real Estate, Rental & Leasing | 0 (0.0%) | 0 (0.0%) |
| Professional & Scientific | 8 (100.0%) | 0 (0.0%) |
| Enterprise Management | 0 (0.0%) | 0 (0.0%) |
| Administrative & Support | 16 (100.0%) | 0 (0.0%) |
| Educational Services | 15 (28.3%) | 38 (71.7%) |
| Health Care & Social Assistance | 0 (0.0%) | 19 (100.0%) |
| Arts, Entertainment & Recreation | 0 (0.0%) | 0 (0.0%) |
| Accommodation & Food Services | 24 (54.5%) | 20 (45.5%) |
| Public Administration | 6 (100.0%) | 0 (0.0%) |
| Total | 107 (48.4%) | 114 (51.6%) |
Education in Lytle Creek
School Enrollment in Lytle Creek
The most common levels of schooling among the 47 students in Lytle Creek are middle school (35 | 74.5%), high school (7 | 14.9%), and college / undergraduate (5 | 10.6%).
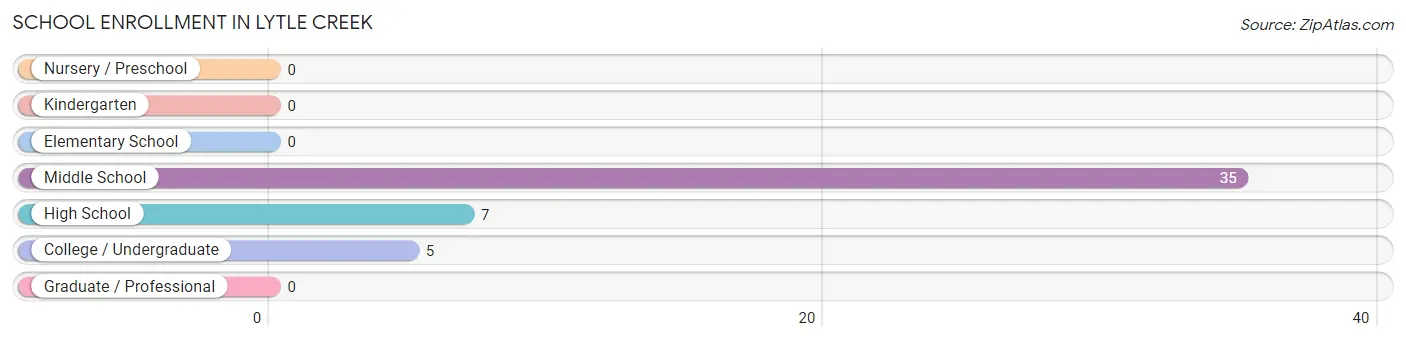
| School Level | # Students | % Students |
| Nursery / Preschool | 0 | 0.0% |
| Kindergarten | 0 | 0.0% |
| Elementary School | 0 | 0.0% |
| Middle School | 35 | 74.5% |
| High School | 7 | 14.9% |
| College / Undergraduate | 5 | 10.6% |
| Graduate / Professional | 0 | 0.0% |
| Total | 47 | 100.0% |
School Enrollment by Age by Funding Source in Lytle Creek
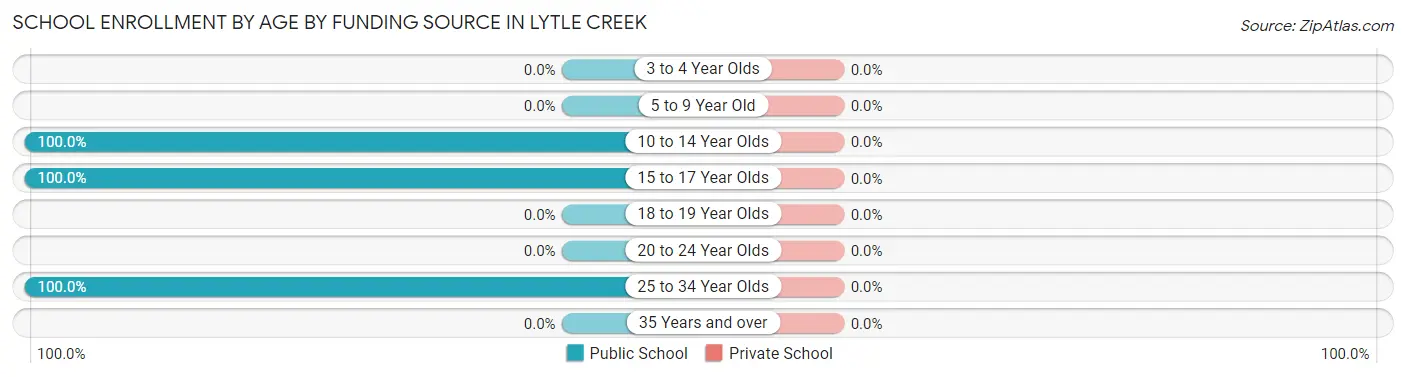
| Age Bracket | Public School | Private School |
| 3 to 4 Year Olds | 0 (0.0%) | 0 (0.0%) |
| 5 to 9 Year Old | 0 (0.0%) | 0 (0.0%) |
| 10 to 14 Year Olds | 35 (100.0%) | 0 (0.0%) |
| 15 to 17 Year Olds | 7 (100.0%) | 0 (0.0%) |
| 18 to 19 Year Olds | 0 (0.0%) | 0 (0.0%) |
| 20 to 24 Year Olds | 0 (0.0%) | 0 (0.0%) |
| 25 to 34 Year Olds | 5 (100.0%) | 0 (0.0%) |
| 35 Years and over | 0 (0.0%) | 0 (0.0%) |
| Total | 47 (100.0%) | 0 (0.0%) |
Educational Attainment by Field of Study in Lytle Creek
Social sciences (27 | 32.1%), business (19 | 22.6%), education (12 | 14.3%), bio, nature & agricultural (11 | 13.1%), and visual & performing arts (10 | 11.9%) are the most common fields of study among 84 individuals in Lytle Creek who have obtained a bachelor's degree or higher.
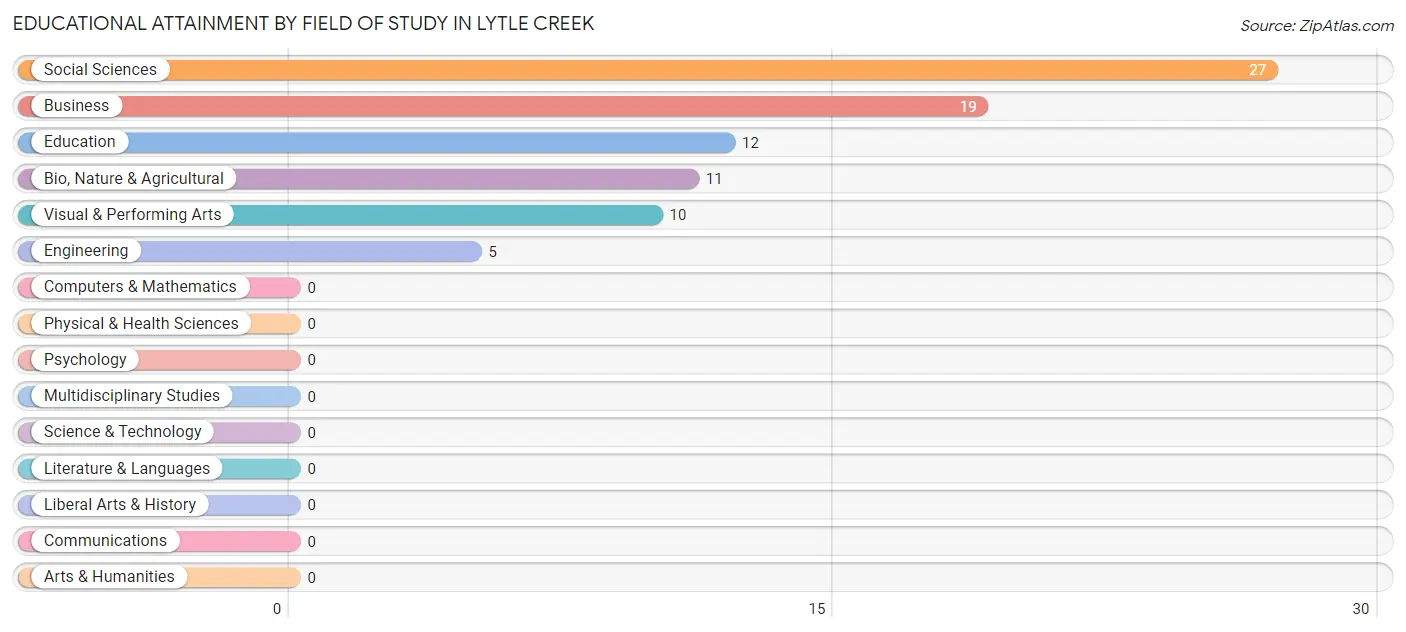
| Field of Study | # Graduates | % Graduates |
| Computers & Mathematics | 0 | 0.0% |
| Bio, Nature & Agricultural | 11 | 13.1% |
| Physical & Health Sciences | 0 | 0.0% |
| Psychology | 0 | 0.0% |
| Social Sciences | 27 | 32.1% |
| Engineering | 5 | 5.9% |
| Multidisciplinary Studies | 0 | 0.0% |
| Science & Technology | 0 | 0.0% |
| Business | 19 | 22.6% |
| Education | 12 | 14.3% |
| Literature & Languages | 0 | 0.0% |
| Liberal Arts & History | 0 | 0.0% |
| Visual & Performing Arts | 10 | 11.9% |
| Communications | 0 | 0.0% |
| Arts & Humanities | 0 | 0.0% |
| Total | 84 | 100.0% |
Transportation & Commute in Lytle Creek
Vehicle Availability by Sex in Lytle Creek
The most prevalent vehicle ownership categories in Lytle Creek are males with 3 vehicles (35, accounting for 32.7%) and females with 3 vehicles (54, making up 30.7%).
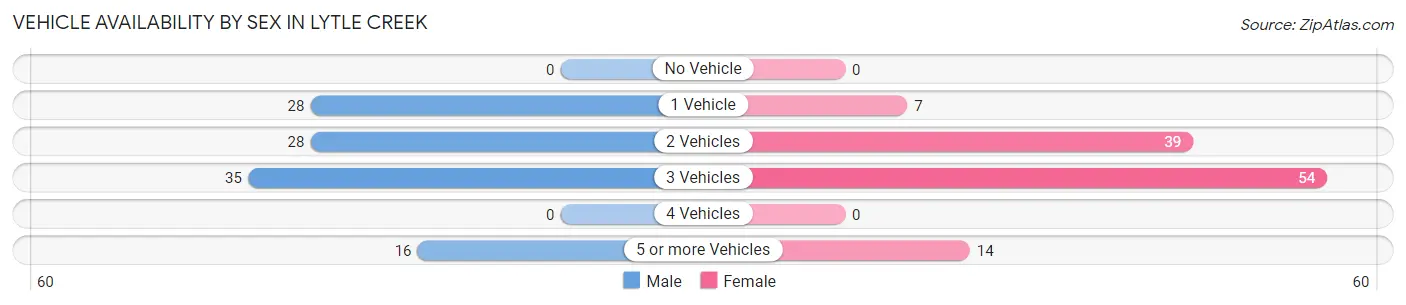
| Vehicles Available | Male | Female |
| No Vehicle | 0 (0.0%) | 0 (0.0%) |
| 1 Vehicle | 28 (26.2%) | 7 (6.1%) |
| 2 Vehicles | 28 (26.2%) | 39 (34.2%) |
| 3 Vehicles | 35 (32.7%) | 54 (47.4%) |
| 4 Vehicles | 0 (0.0%) | 0 (0.0%) |
| 5 or more Vehicles | 16 (14.9%) | 14 (12.3%) |
| Total | 107 (100.0%) | 114 (100.0%) |
Commute Time in Lytle Creek
The most frequently occuring commute durations in Lytle Creek are 45 to 59 minutes (46 commuters, 20.8%), 30 to 34 minutes (43 commuters, 19.5%), and 90 or more minutes (39 commuters, 17.6%).
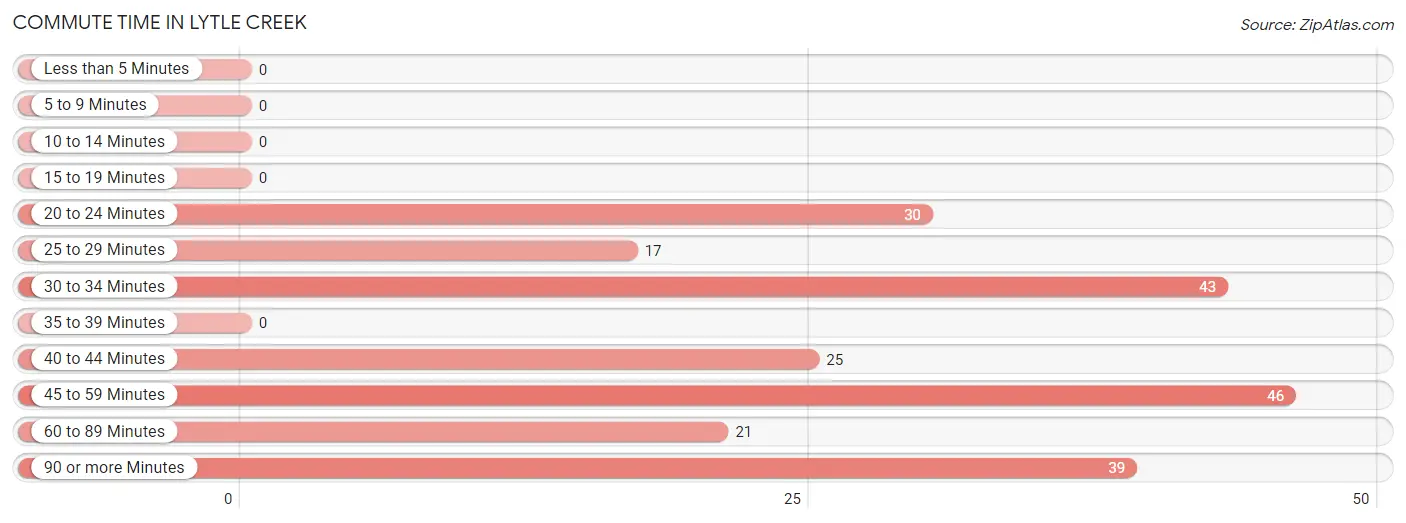
| Commute Time | # Commuters | % Commuters |
| Less than 5 Minutes | 0 | 0.0% |
| 5 to 9 Minutes | 0 | 0.0% |
| 10 to 14 Minutes | 0 | 0.0% |
| 15 to 19 Minutes | 0 | 0.0% |
| 20 to 24 Minutes | 30 | 13.6% |
| 25 to 29 Minutes | 17 | 7.7% |
| 30 to 34 Minutes | 43 | 19.5% |
| 35 to 39 Minutes | 0 | 0.0% |
| 40 to 44 Minutes | 25 | 11.3% |
| 45 to 59 Minutes | 46 | 20.8% |
| 60 to 89 Minutes | 21 | 9.5% |
| 90 or more Minutes | 39 | 17.6% |
Commute Time by Sex in Lytle Creek
The most common commute times in Lytle Creek are 30 to 34 minutes (27 commuters, 25.2%) for males and 45 to 59 minutes (46 commuters, 40.4%) for females.
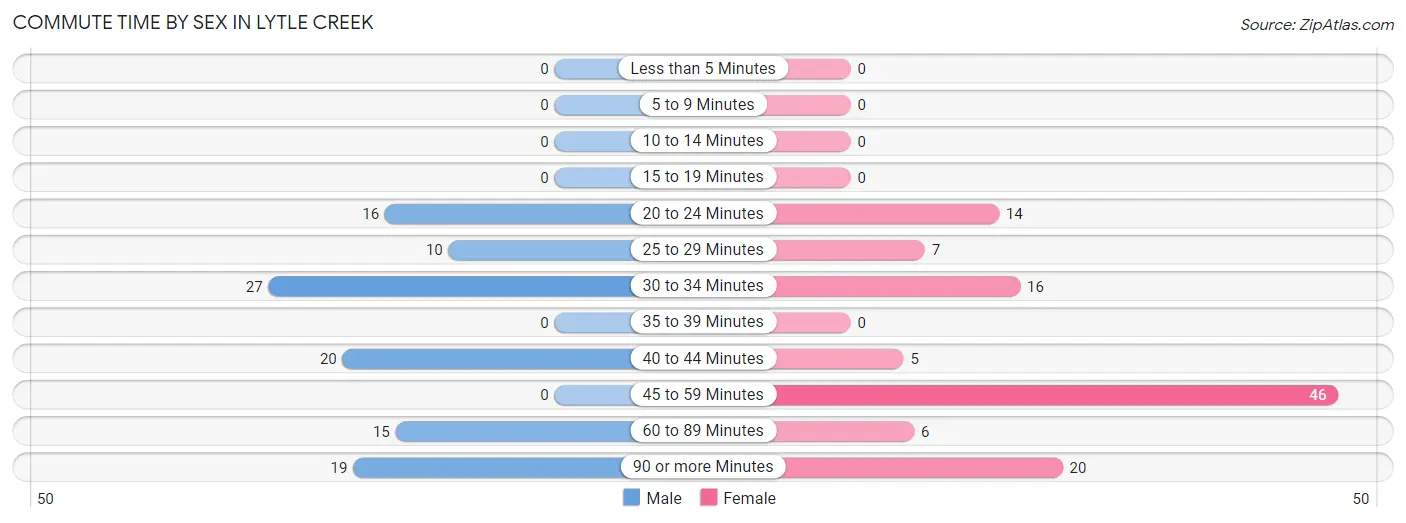
| Commute Time | Male | Female |
| Less than 5 Minutes | 0 (0.0%) | 0 (0.0%) |
| 5 to 9 Minutes | 0 (0.0%) | 0 (0.0%) |
| 10 to 14 Minutes | 0 (0.0%) | 0 (0.0%) |
| 15 to 19 Minutes | 0 (0.0%) | 0 (0.0%) |
| 20 to 24 Minutes | 16 (14.9%) | 14 (12.3%) |
| 25 to 29 Minutes | 10 (9.3%) | 7 (6.1%) |
| 30 to 34 Minutes | 27 (25.2%) | 16 (14.0%) |
| 35 to 39 Minutes | 0 (0.0%) | 0 (0.0%) |
| 40 to 44 Minutes | 20 (18.7%) | 5 (4.4%) |
| 45 to 59 Minutes | 0 (0.0%) | 46 (40.4%) |
| 60 to 89 Minutes | 15 (14.0%) | 6 (5.3%) |
| 90 or more Minutes | 19 (17.8%) | 20 (17.5%) |
Time of Departure to Work by Sex in Lytle Creek
The most frequent times of departure to work in Lytle Creek are 7:00 AM to 7:29 AM (20, 18.7%) for males and 7:30 AM to 7:59 AM (28, 24.6%) for females.
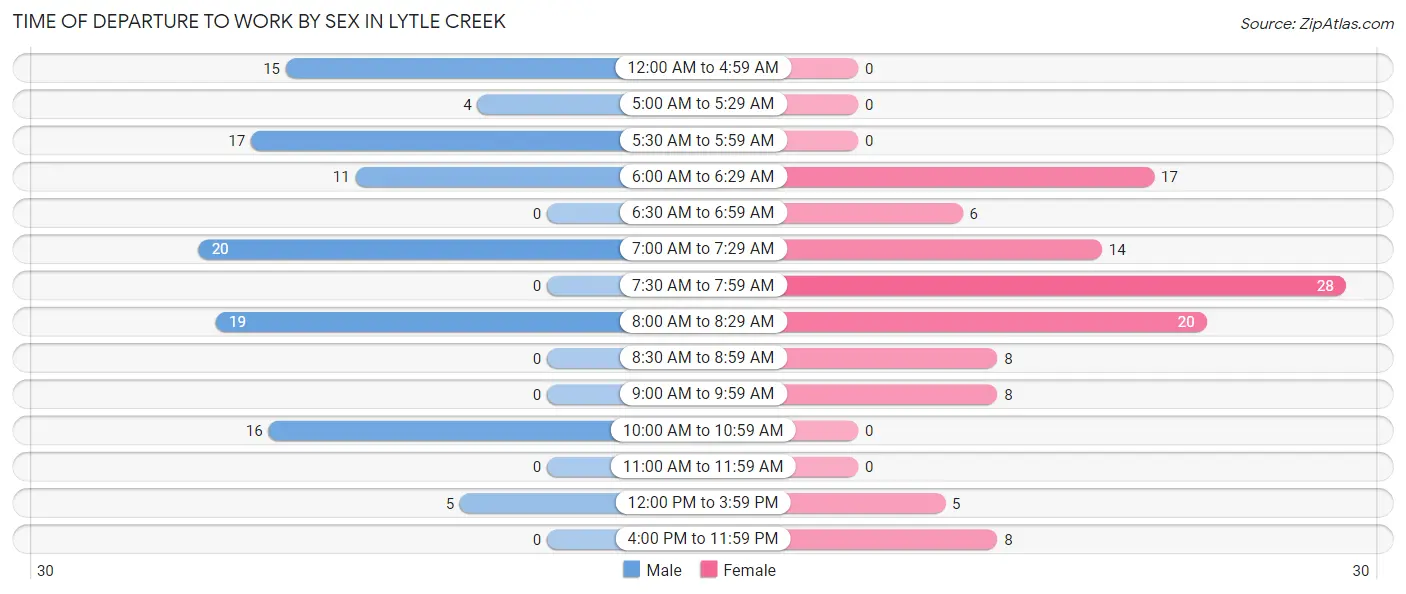
| Time of Departure | Male | Female |
| 12:00 AM to 4:59 AM | 15 (14.0%) | 0 (0.0%) |
| 5:00 AM to 5:29 AM | 4 (3.7%) | 0 (0.0%) |
| 5:30 AM to 5:59 AM | 17 (15.9%) | 0 (0.0%) |
| 6:00 AM to 6:29 AM | 11 (10.3%) | 17 (14.9%) |
| 6:30 AM to 6:59 AM | 0 (0.0%) | 6 (5.3%) |
| 7:00 AM to 7:29 AM | 20 (18.7%) | 14 (12.3%) |
| 7:30 AM to 7:59 AM | 0 (0.0%) | 28 (24.6%) |
| 8:00 AM to 8:29 AM | 19 (17.8%) | 20 (17.5%) |
| 8:30 AM to 8:59 AM | 0 (0.0%) | 8 (7.0%) |
| 9:00 AM to 9:59 AM | 0 (0.0%) | 8 (7.0%) |
| 10:00 AM to 10:59 AM | 16 (14.9%) | 0 (0.0%) |
| 11:00 AM to 11:59 AM | 0 (0.0%) | 0 (0.0%) |
| 12:00 PM to 3:59 PM | 5 (4.7%) | 5 (4.4%) |
| 4:00 PM to 11:59 PM | 0 (0.0%) | 8 (7.0%) |
| Total | 107 (100.0%) | 114 (100.0%) |
Housing Occupancy in Lytle Creek
Occupancy by Ownership in Lytle Creek
Of the total 269 dwellings in Lytle Creek, owner-occupied units account for 219 (81.4%), while renter-occupied units make up 50 (18.6%).
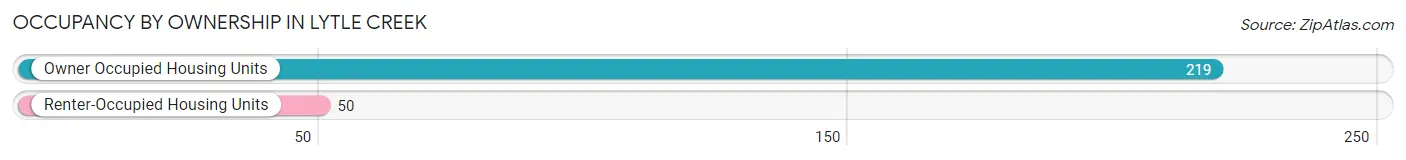
| Occupancy | # Housing Units | % Housing Units |
| Owner Occupied Housing Units | 219 | 81.4% |
| Renter-Occupied Housing Units | 50 | 18.6% |
| Total Occupied Housing Units | 269 | 100.0% |
Occupancy by Household Size in Lytle Creek
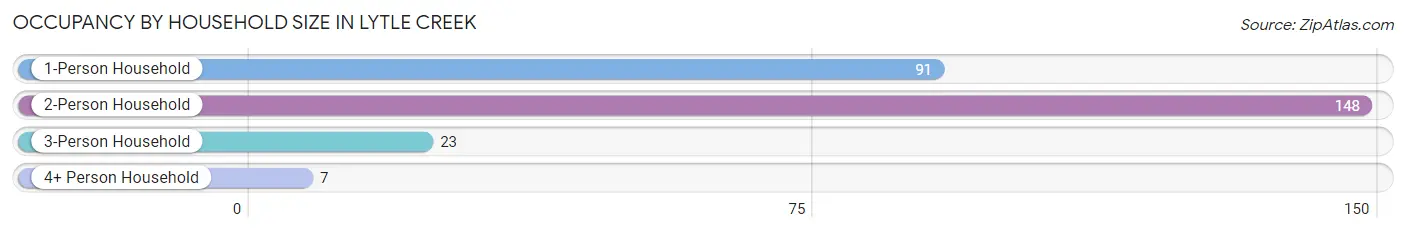
| Household Size | # Housing Units | % Housing Units |
| 1-Person Household | 91 | 33.8% |
| 2-Person Household | 148 | 55.0% |
| 3-Person Household | 23 | 8.6% |
| 4+ Person Household | 7 | 2.6% |
| Total Housing Units | 269 | 100.0% |
Occupancy by Ownership by Household Size in Lytle Creek
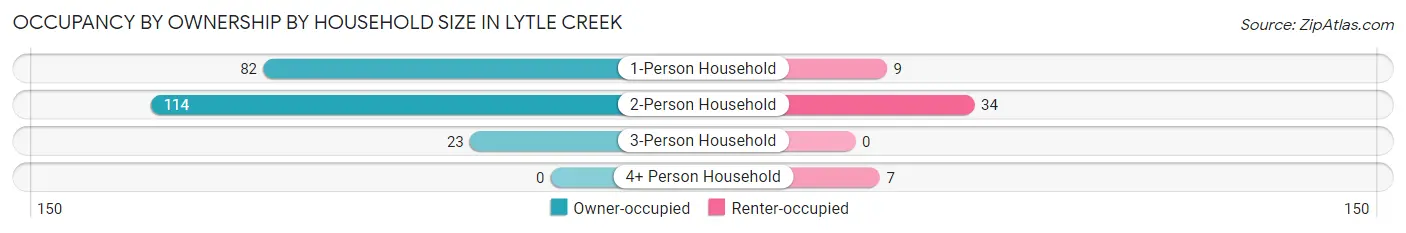
| Household Size | Owner-occupied | Renter-occupied |
| 1-Person Household | 82 (90.1%) | 9 (9.9%) |
| 2-Person Household | 114 (77.0%) | 34 (23.0%) |
| 3-Person Household | 23 (100.0%) | 0 (0.0%) |
| 4+ Person Household | 0 (0.0%) | 7 (100.0%) |
| Total Housing Units | 219 (81.4%) | 50 (18.6%) |
Occupancy by Educational Attainment in Lytle Creek
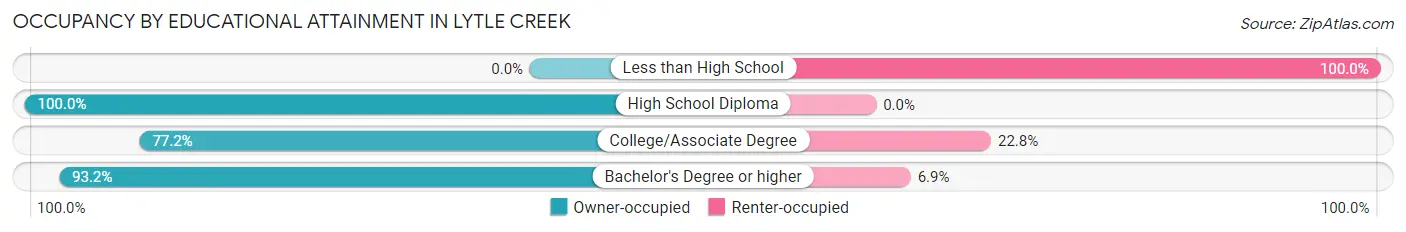
| Household Size | Owner-occupied | Renter-occupied |
| Less than High School | 0 (0.0%) | 9 (100.0%) |
| High School Diploma | 29 (100.0%) | 0 (0.0%) |
| College/Associate Degree | 122 (77.2%) | 36 (22.8%) |
| Bachelor's Degree or higher | 68 (93.1%) | 5 (6.9%) |
Occupancy by Age of Householder in Lytle Creek
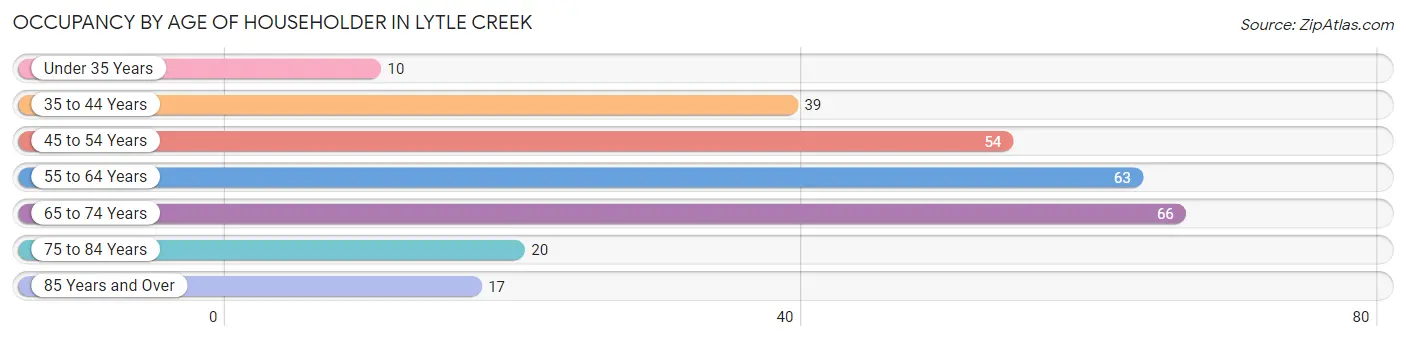
| Age Bracket | # Households | % Households |
| Under 35 Years | 10 | 3.7% |
| 35 to 44 Years | 39 | 14.5% |
| 45 to 54 Years | 54 | 20.1% |
| 55 to 64 Years | 63 | 23.4% |
| 65 to 74 Years | 66 | 24.5% |
| 75 to 84 Years | 20 | 7.4% |
| 85 Years and Over | 17 | 6.3% |
| Total | 269 | 100.0% |
Housing Finances in Lytle Creek
Median Income by Occupancy in Lytle Creek

| Occupancy Type | # Households | Median Income |
| Owner-Occupied | 219 (81.4%) | $62,303 |
| Renter-Occupied | 50 (18.6%) | $47,619 |
| Average | 269 (100.0%) | $56,607 |
Occupancy by Householder Income Bracket in Lytle Creek
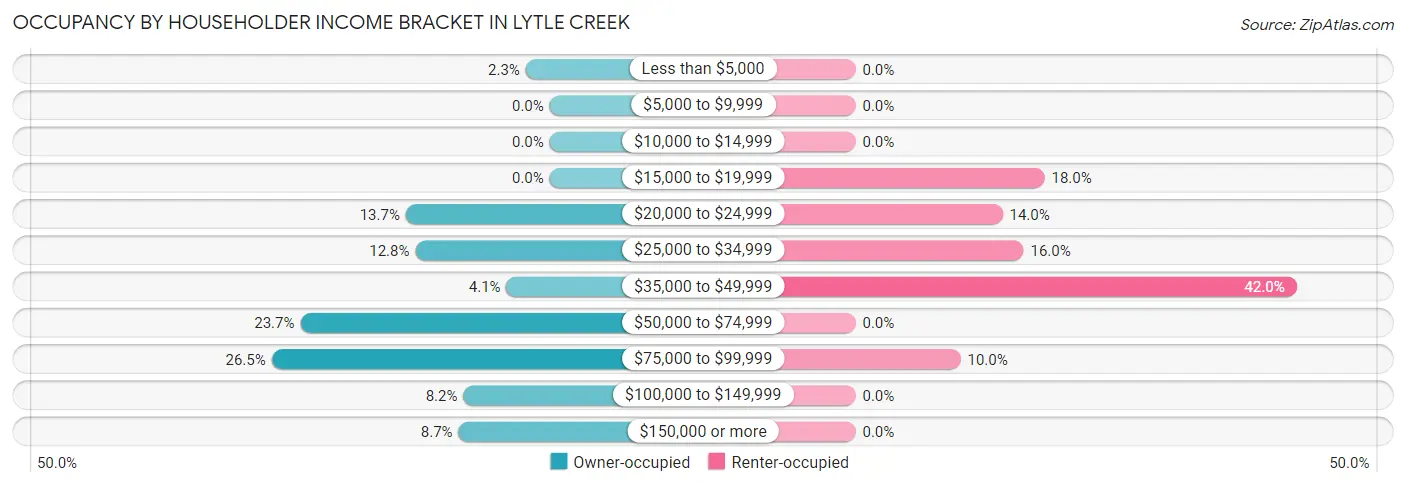
| Income Bracket | Owner-occupied | Renter-occupied |
| Less than $5,000 | 5 (2.3%) | 0 (0.0%) |
| $5,000 to $9,999 | 0 (0.0%) | 0 (0.0%) |
| $10,000 to $14,999 | 0 (0.0%) | 0 (0.0%) |
| $15,000 to $19,999 | 0 (0.0%) | 9 (18.0%) |
| $20,000 to $24,999 | 30 (13.7%) | 7 (14.0%) |
| $25,000 to $34,999 | 28 (12.8%) | 8 (16.0%) |
| $35,000 to $49,999 | 9 (4.1%) | 21 (42.0%) |
| $50,000 to $74,999 | 52 (23.7%) | 0 (0.0%) |
| $75,000 to $99,999 | 58 (26.5%) | 5 (10.0%) |
| $100,000 to $149,999 | 18 (8.2%) | 0 (0.0%) |
| $150,000 or more | 19 (8.7%) | 0 (0.0%) |
| Total | 219 (100.0%) | 50 (100.0%) |
Monthly Housing Cost Tiers in Lytle Creek
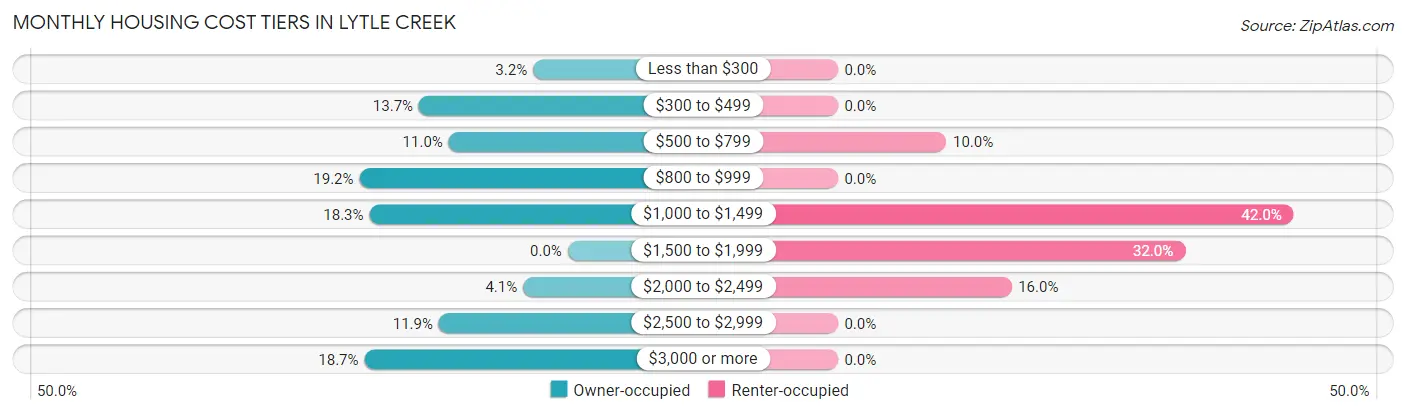
| Monthly Cost | Owner-occupied | Renter-occupied |
| Less than $300 | 7 (3.2%) | 0 (0.0%) |
| $300 to $499 | 30 (13.7%) | 0 (0.0%) |
| $500 to $799 | 24 (11.0%) | 5 (10.0%) |
| $800 to $999 | 42 (19.2%) | 0 (0.0%) |
| $1,000 to $1,499 | 40 (18.3%) | 21 (42.0%) |
| $1,500 to $1,999 | 0 (0.0%) | 16 (32.0%) |
| $2,000 to $2,499 | 9 (4.1%) | 8 (16.0%) |
| $2,500 to $2,999 | 26 (11.9%) | 0 (0.0%) |
| $3,000 or more | 41 (18.7%) | 0 (0.0%) |
| Total | 219 (100.0%) | 50 (100.0%) |
Physical Housing Characteristics in Lytle Creek
Housing Structures in Lytle Creek
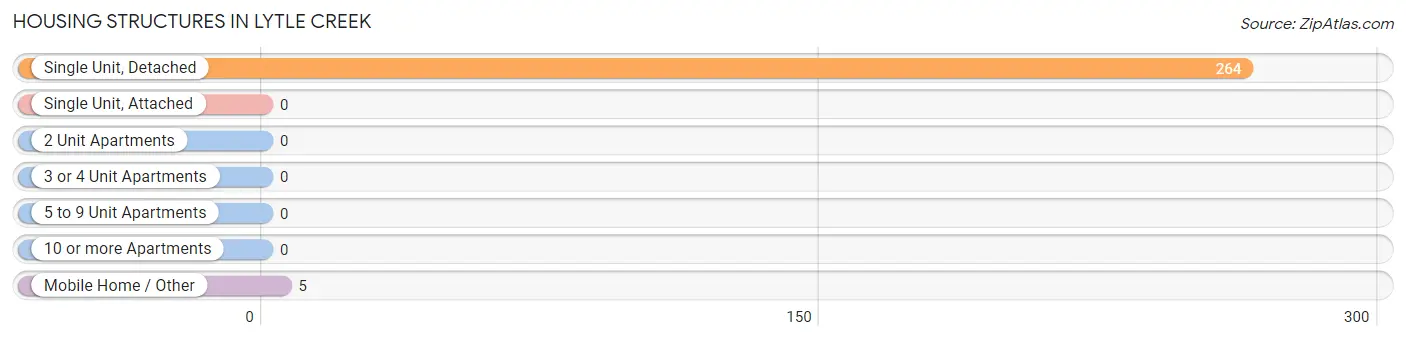
| Structure Type | # Housing Units | % Housing Units |
| Single Unit, Detached | 264 | 98.1% |
| Single Unit, Attached | 0 | 0.0% |
| 2 Unit Apartments | 0 | 0.0% |
| 3 or 4 Unit Apartments | 0 | 0.0% |
| 5 to 9 Unit Apartments | 0 | 0.0% |
| 10 or more Apartments | 0 | 0.0% |
| Mobile Home / Other | 5 | 1.9% |
| Total | 269 | 100.0% |
Housing Structures by Occupancy in Lytle Creek
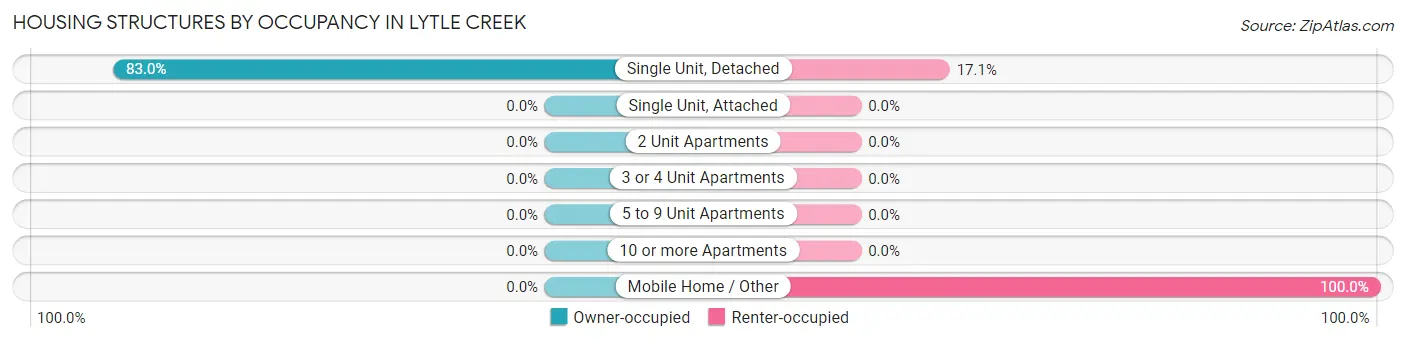
| Structure Type | Owner-occupied | Renter-occupied |
| Single Unit, Detached | 219 (83.0%) | 45 (17.1%) |
| Single Unit, Attached | 0 (0.0%) | 0 (0.0%) |
| 2 Unit Apartments | 0 (0.0%) | 0 (0.0%) |
| 3 or 4 Unit Apartments | 0 (0.0%) | 0 (0.0%) |
| 5 to 9 Unit Apartments | 0 (0.0%) | 0 (0.0%) |
| 10 or more Apartments | 0 (0.0%) | 0 (0.0%) |
| Mobile Home / Other | 0 (0.0%) | 5 (100.0%) |
| Total | 219 (81.4%) | 50 (18.6%) |
Housing Structures by Number of Rooms in Lytle Creek
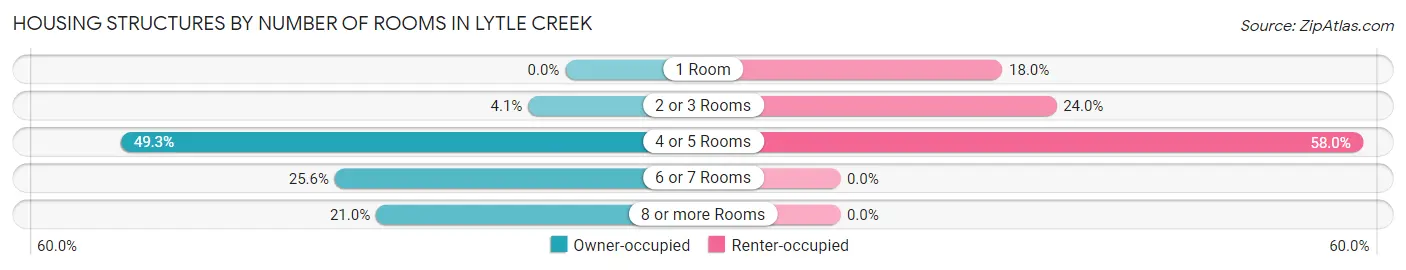
| Number of Rooms | Owner-occupied | Renter-occupied |
| 1 Room | 0 (0.0%) | 9 (18.0%) |
| 2 or 3 Rooms | 9 (4.1%) | 12 (24.0%) |
| 4 or 5 Rooms | 108 (49.3%) | 29 (58.0%) |
| 6 or 7 Rooms | 56 (25.6%) | 0 (0.0%) |
| 8 or more Rooms | 46 (21.0%) | 0 (0.0%) |
| Total | 219 (100.0%) | 50 (100.0%) |
Housing Structure by Heating Type in Lytle Creek
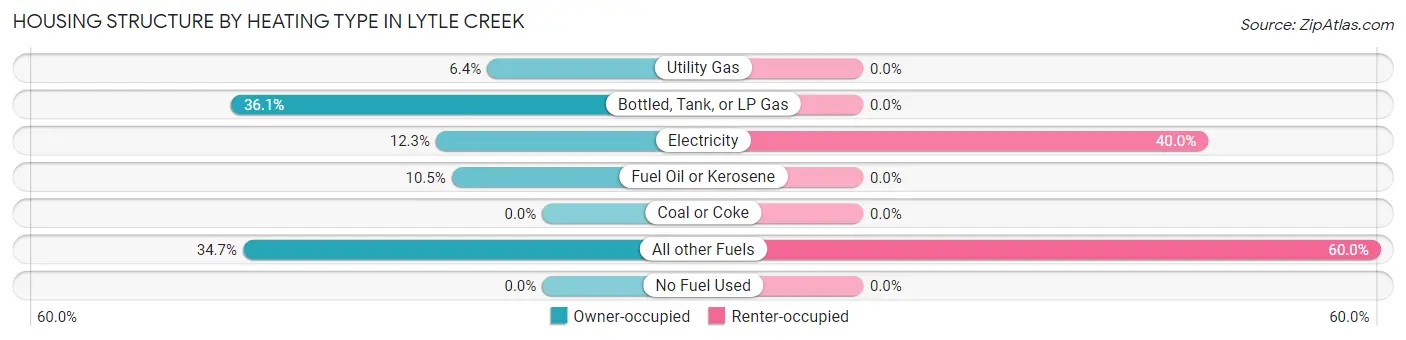
| Heating Type | Owner-occupied | Renter-occupied |
| Utility Gas | 14 (6.4%) | 0 (0.0%) |
| Bottled, Tank, or LP Gas | 79 (36.1%) | 0 (0.0%) |
| Electricity | 27 (12.3%) | 20 (40.0%) |
| Fuel Oil or Kerosene | 23 (10.5%) | 0 (0.0%) |
| Coal or Coke | 0 (0.0%) | 0 (0.0%) |
| All other Fuels | 76 (34.7%) | 30 (60.0%) |
| No Fuel Used | 0 (0.0%) | 0 (0.0%) |
| Total | 219 (100.0%) | 50 (100.0%) |
Household Vehicle Usage in Lytle Creek
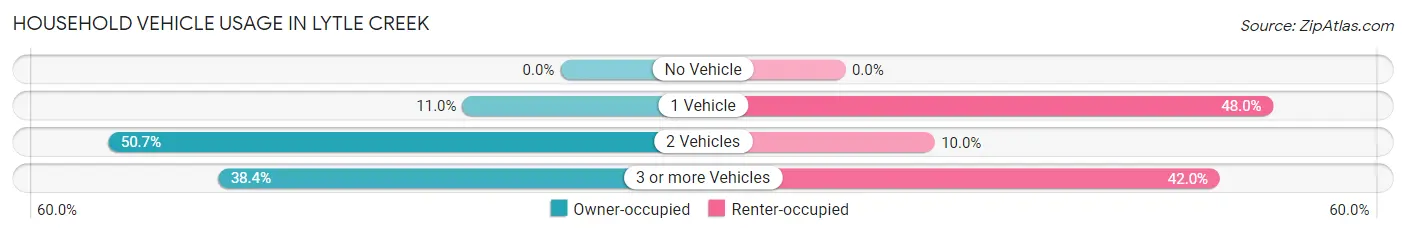
| Vehicles per Household | Owner-occupied | Renter-occupied |
| No Vehicle | 0 (0.0%) | 0 (0.0%) |
| 1 Vehicle | 24 (11.0%) | 24 (48.0%) |
| 2 Vehicles | 111 (50.7%) | 5 (10.0%) |
| 3 or more Vehicles | 84 (38.4%) | 21 (42.0%) |
| Total | 219 (100.0%) | 50 (100.0%) |
Real Estate & Mortgages in Lytle Creek
Real Estate and Mortgage Overview in Lytle Creek
| Characteristic | Without Mortgage | With Mortgage |
| Housing Units | 117 | 102 |
| Median Property Value | $450,000 | $461,900 |
| Median Household Income | $53,558 | $14 |
| Monthly Housing Costs | $650 | $41 |
| Real Estate Taxes | $2,664 | $0 |
Property Value by Mortgage Status in Lytle Creek
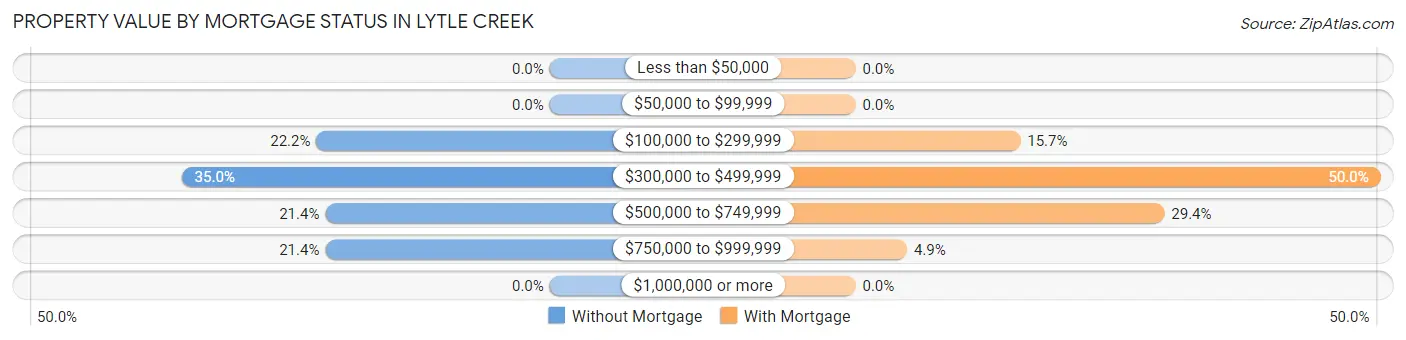
| Property Value | Without Mortgage | With Mortgage |
| Less than $50,000 | 0 (0.0%) | 0 (0.0%) |
| $50,000 to $99,999 | 0 (0.0%) | 0 (0.0%) |
| $100,000 to $299,999 | 26 (22.2%) | 16 (15.7%) |
| $300,000 to $499,999 | 41 (35.0%) | 51 (50.0%) |
| $500,000 to $749,999 | 25 (21.4%) | 30 (29.4%) |
| $750,000 to $999,999 | 25 (21.4%) | 5 (4.9%) |
| $1,000,000 or more | 0 (0.0%) | 0 (0.0%) |
| Total | 117 (100.0%) | 102 (100.0%) |
Household Income by Mortgage Status in Lytle Creek
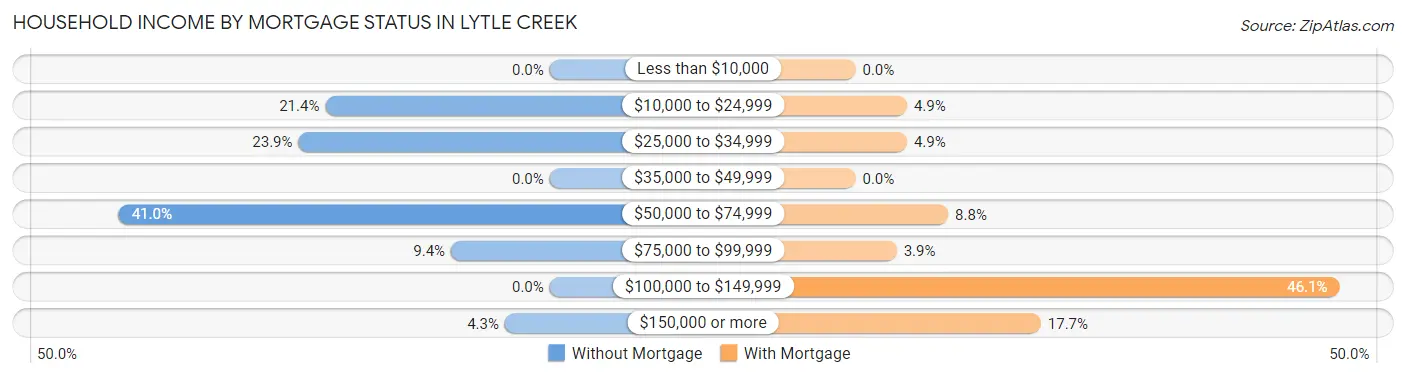
| Household Income | Without Mortgage | With Mortgage |
| Less than $10,000 | 0 (0.0%) | 0 (0.0%) |
| $10,000 to $24,999 | 25 (21.4%) | 5 (4.9%) |
| $25,000 to $34,999 | 28 (23.9%) | 5 (4.9%) |
| $35,000 to $49,999 | 0 (0.0%) | 0 (0.0%) |
| $50,000 to $74,999 | 48 (41.0%) | 9 (8.8%) |
| $75,000 to $99,999 | 11 (9.4%) | 4 (3.9%) |
| $100,000 to $149,999 | 0 (0.0%) | 47 (46.1%) |
| $150,000 or more | 5 (4.3%) | 18 (17.6%) |
| Total | 117 (100.0%) | 102 (100.0%) |
Property Value to Household Income Ratio in Lytle Creek
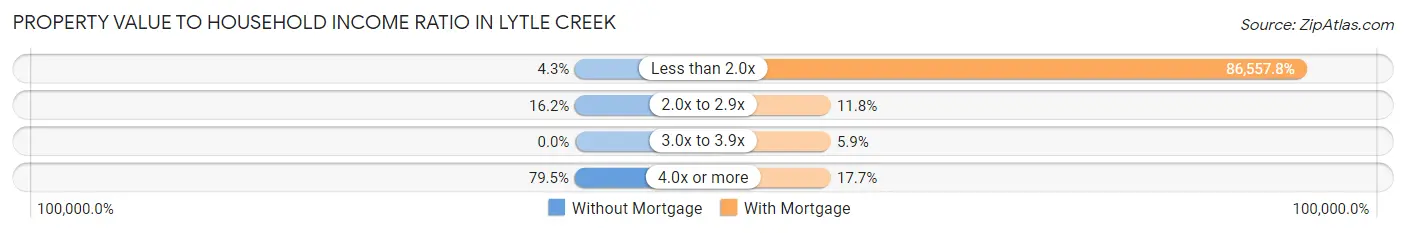
| Value-to-Income Ratio | Without Mortgage | With Mortgage |
| Less than 2.0x | 5 (4.3%) | 88,289 (86,557.8%) |
| 2.0x to 2.9x | 19 (16.2%) | 12 (11.8%) |
| 3.0x to 3.9x | 0 (0.0%) | 6 (5.9%) |
| 4.0x or more | 93 (79.5%) | 18 (17.6%) |
| Total | 117 (100.0%) | 102 (100.0%) |
Real Estate Taxes by Mortgage Status in Lytle Creek
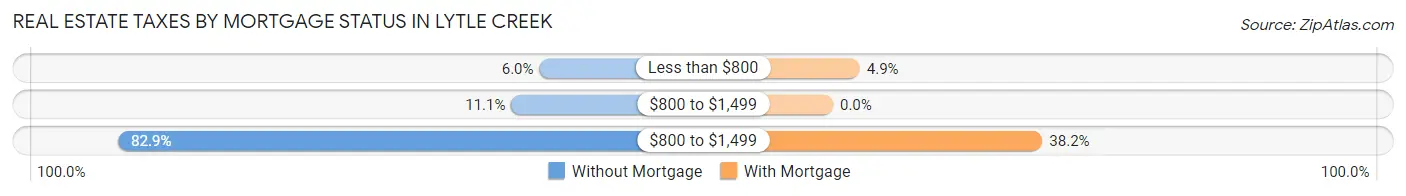
| Property Taxes | Without Mortgage | With Mortgage |
| Less than $800 | 7 (6.0%) | 5 (4.9%) |
| $800 to $1,499 | 13 (11.1%) | 0 (0.0%) |
| $800 to $1,499 | 97 (82.9%) | 39 (38.2%) |
| Total | 117 (100.0%) | 102 (100.0%) |
Health & Disability in Lytle Creek
Health Insurance Coverage by Age in Lytle Creek
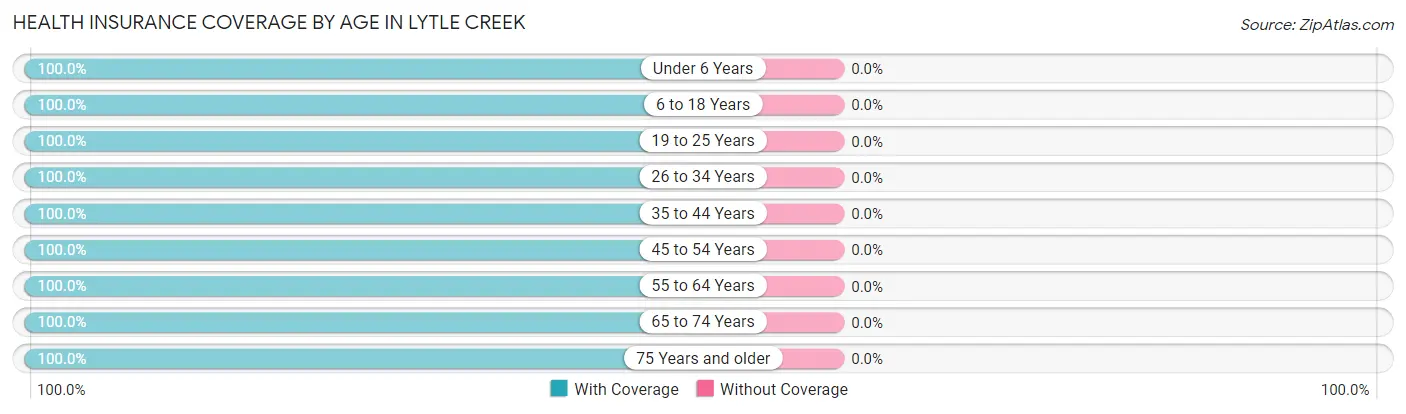
| Age Bracket | With Coverage | Without Coverage |
| Under 6 Years | 7 (100.0%) | 0 (0.0%) |
| 6 to 18 Years | 42 (100.0%) | 0 (0.0%) |
| 19 to 25 Years | 16 (100.0%) | 0 (0.0%) |
| 26 to 34 Years | 25 (100.0%) | 0 (0.0%) |
| 35 to 44 Years | 91 (100.0%) | 0 (0.0%) |
| 45 to 54 Years | 93 (100.0%) | 0 (0.0%) |
| 55 to 64 Years | 116 (100.0%) | 0 (0.0%) |
| 65 to 74 Years | 89 (100.0%) | 0 (0.0%) |
| 75 Years and older | 49 (100.0%) | 0 (0.0%) |
| Total | 528 (100.0%) | 0 (0.0%) |
Health Insurance Coverage by Citizenship Status in Lytle Creek
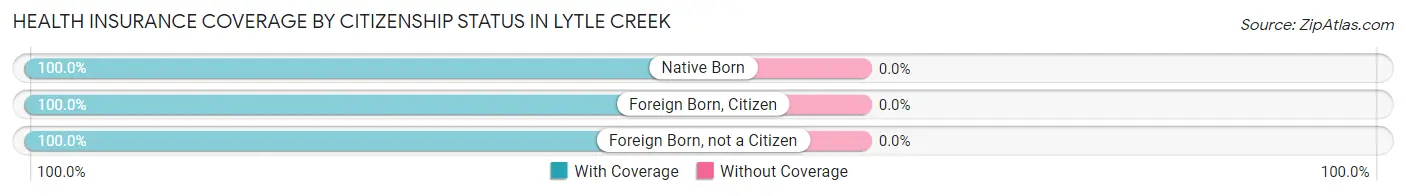
| Citizenship Status | With Coverage | Without Coverage |
| Native Born | 7 (100.0%) | 0 (0.0%) |
| Foreign Born, Citizen | 42 (100.0%) | 0 (0.0%) |
| Foreign Born, not a Citizen | 16 (100.0%) | 0 (0.0%) |
Health Insurance Coverage by Household Income in Lytle Creek
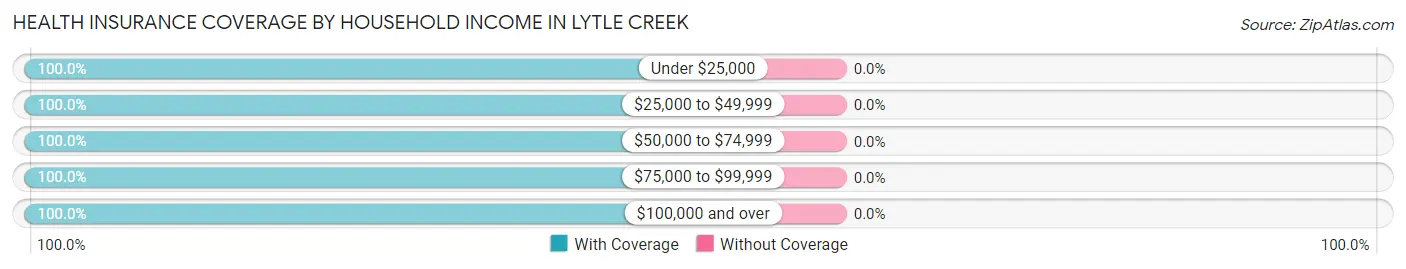
| Household Income | With Coverage | Without Coverage |
| Under $25,000 | 85 (100.0%) | 0 (0.0%) |
| $25,000 to $49,999 | 104 (100.0%) | 0 (0.0%) |
| $50,000 to $74,999 | 104 (100.0%) | 0 (0.0%) |
| $75,000 to $99,999 | 120 (100.0%) | 0 (0.0%) |
| $100,000 and over | 83 (100.0%) | 0 (0.0%) |
Public vs Private Health Insurance Coverage by Age in Lytle Creek
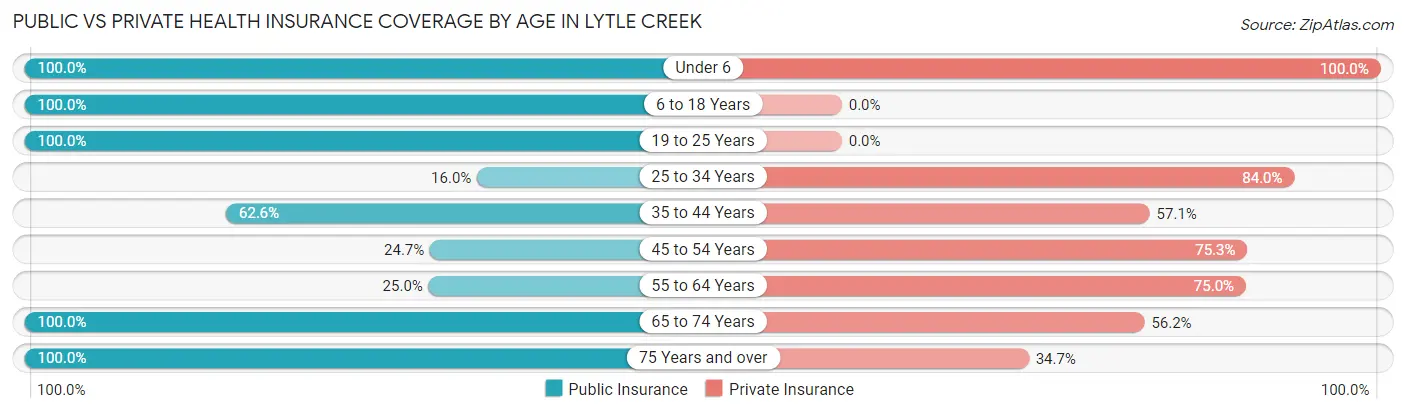
| Age Bracket | Public Insurance | Private Insurance |
| Under 6 | 7 (100.0%) | 7 (100.0%) |
| 6 to 18 Years | 42 (100.0%) | 0 (0.0%) |
| 19 to 25 Years | 16 (100.0%) | 0 (0.0%) |
| 25 to 34 Years | 4 (16.0%) | 21 (84.0%) |
| 35 to 44 Years | 57 (62.6%) | 52 (57.1%) |
| 45 to 54 Years | 23 (24.7%) | 70 (75.3%) |
| 55 to 64 Years | 29 (25.0%) | 87 (75.0%) |
| 65 to 74 Years | 89 (100.0%) | 50 (56.2%) |
| 75 Years and over | 49 (100.0%) | 17 (34.7%) |
| Total | 316 (59.9%) | 304 (57.6%) |
Disability Status by Sex by Age in Lytle Creek
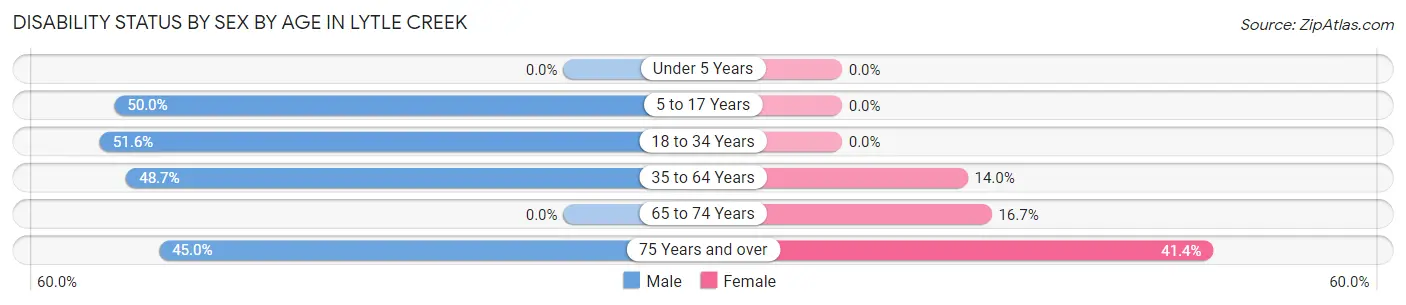
| Age Bracket | Male | Female |
| Under 5 Years | 0 (0.0%) | 0 (0.0%) |
| 5 to 17 Years | 21 (50.0%) | 0 (0.0%) |
| 18 to 34 Years | 16 (51.6%) | 0 (0.0%) |
| 35 to 64 Years | 73 (48.7%) | 21 (14.0%) |
| 65 to 74 Years | 0 (0.0%) | 7 (16.7%) |
| 75 Years and over | 9 (45.0%) | 12 (41.4%) |
Disability Class by Sex by Age in Lytle Creek
Disability Class: Hearing Difficulty
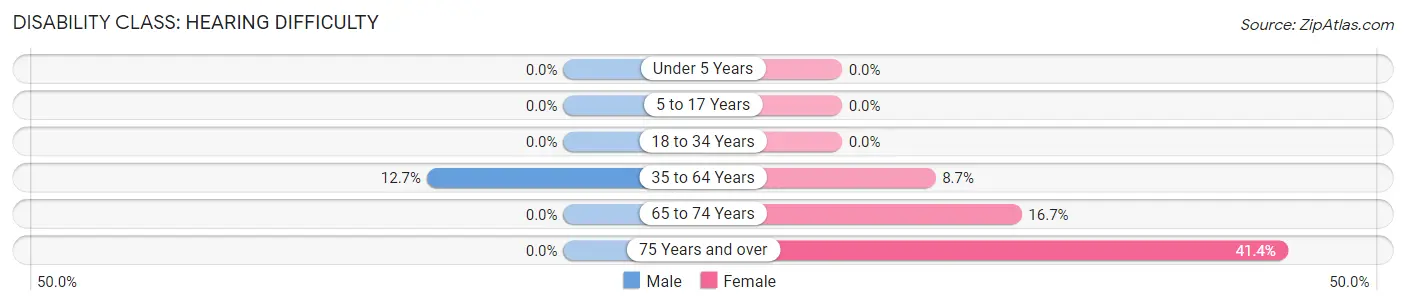
| Age Bracket | Male | Female |
| Under 5 Years | 0 (0.0%) | 0 (0.0%) |
| 5 to 17 Years | 0 (0.0%) | 0 (0.0%) |
| 18 to 34 Years | 0 (0.0%) | 0 (0.0%) |
| 35 to 64 Years | 19 (12.7%) | 13 (8.7%) |
| 65 to 74 Years | 0 (0.0%) | 7 (16.7%) |
| 75 Years and over | 0 (0.0%) | 12 (41.4%) |
Disability Class: Vision Difficulty
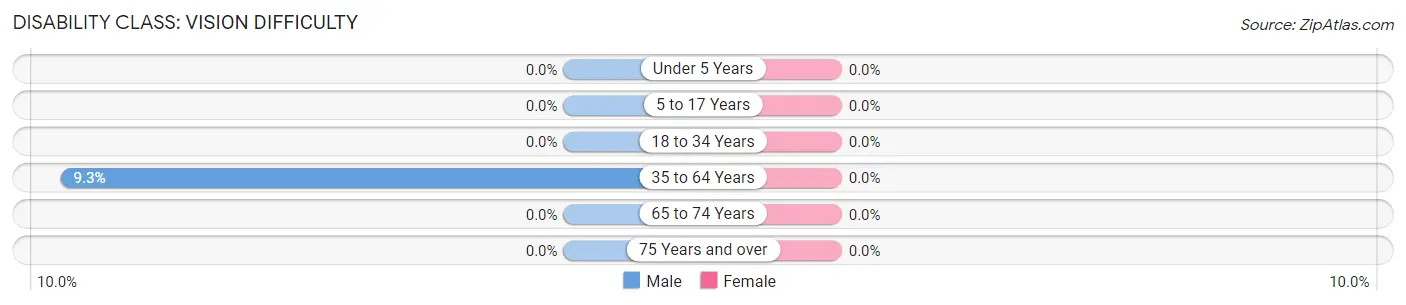
| Age Bracket | Male | Female |
| Under 5 Years | 0 (0.0%) | 0 (0.0%) |
| 5 to 17 Years | 0 (0.0%) | 0 (0.0%) |
| 18 to 34 Years | 0 (0.0%) | 0 (0.0%) |
| 35 to 64 Years | 14 (9.3%) | 0 (0.0%) |
| 65 to 74 Years | 0 (0.0%) | 0 (0.0%) |
| 75 Years and over | 0 (0.0%) | 0 (0.0%) |
Disability Class: Cognitive Difficulty
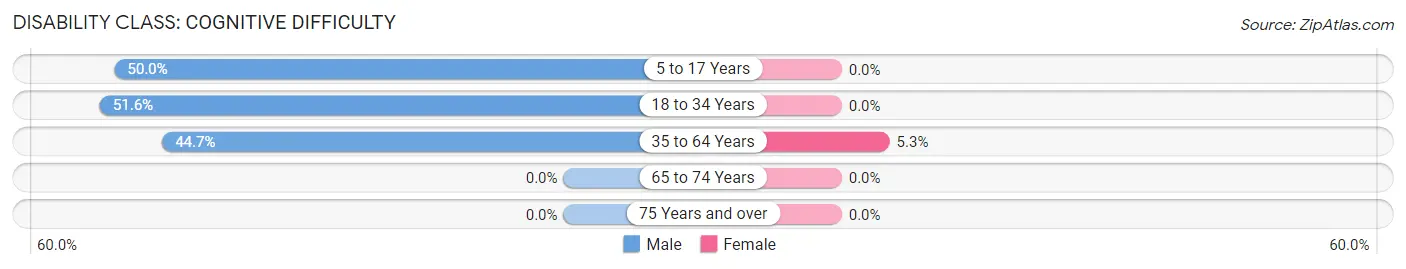
| Age Bracket | Male | Female |
| 5 to 17 Years | 21 (50.0%) | 0 (0.0%) |
| 18 to 34 Years | 16 (51.6%) | 0 (0.0%) |
| 35 to 64 Years | 67 (44.7%) | 8 (5.3%) |
| 65 to 74 Years | 0 (0.0%) | 0 (0.0%) |
| 75 Years and over | 0 (0.0%) | 0 (0.0%) |
Disability Class: Ambulatory Difficulty
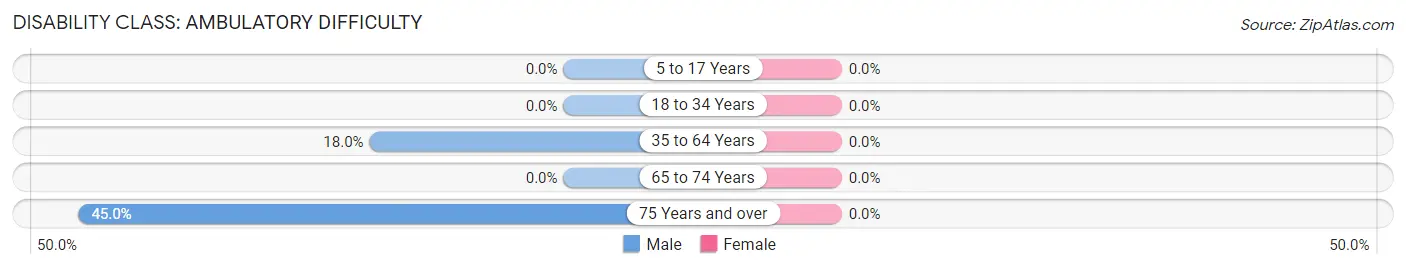
| Age Bracket | Male | Female |
| 5 to 17 Years | 0 (0.0%) | 0 (0.0%) |
| 18 to 34 Years | 0 (0.0%) | 0 (0.0%) |
| 35 to 64 Years | 27 (18.0%) | 0 (0.0%) |
| 65 to 74 Years | 0 (0.0%) | 0 (0.0%) |
| 75 Years and over | 9 (45.0%) | 0 (0.0%) |
Disability Class: Self-Care Difficulty
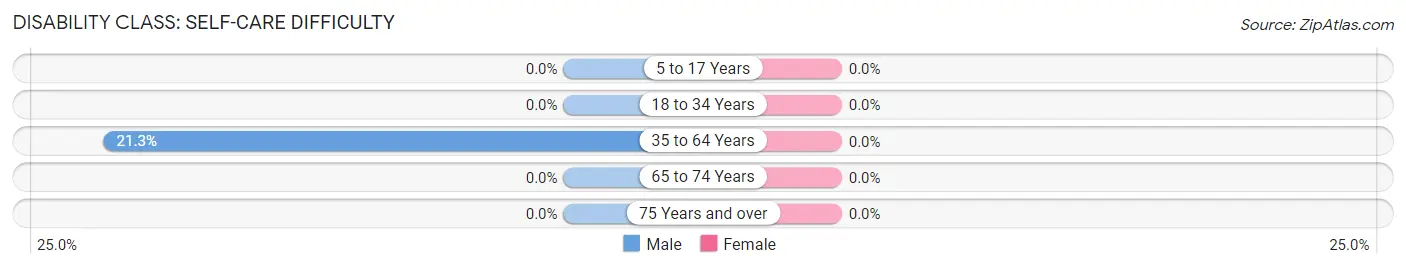
| Age Bracket | Male | Female |
| 5 to 17 Years | 0 (0.0%) | 0 (0.0%) |
| 18 to 34 Years | 0 (0.0%) | 0 (0.0%) |
| 35 to 64 Years | 32 (21.3%) | 0 (0.0%) |
| 65 to 74 Years | 0 (0.0%) | 0 (0.0%) |
| 75 Years and over | 0 (0.0%) | 0 (0.0%) |
Technology Access in Lytle Creek
Computing Device Access in Lytle Creek
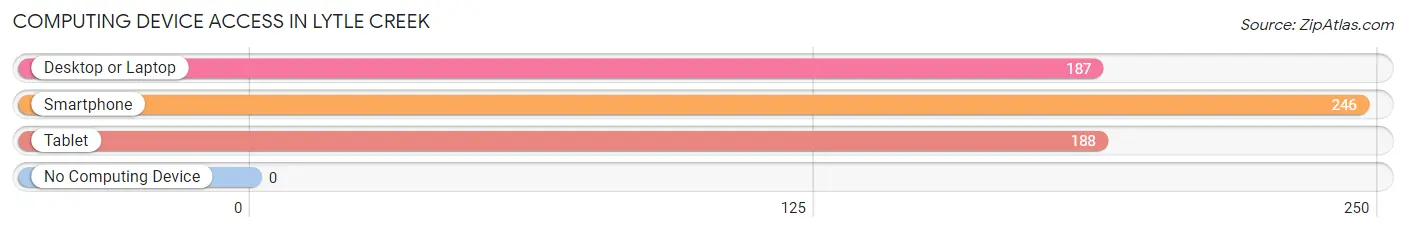
| Device Type | # Households | % Households |
| Desktop or Laptop | 187 | 69.5% |
| Smartphone | 246 | 91.4% |
| Tablet | 188 | 69.9% |
| No Computing Device | 0 | 0.0% |
| Total | 269 | 100.0% |
Internet Access in Lytle Creek
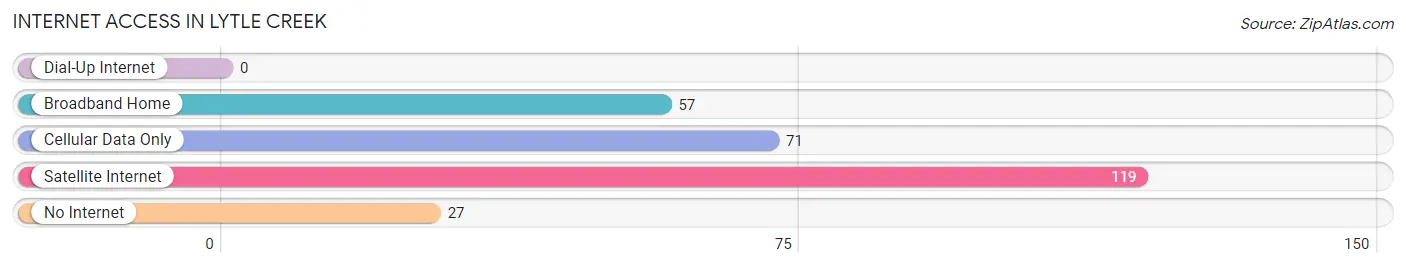
| Internet Type | # Households | % Households |
| Dial-Up Internet | 0 | 0.0% |
| Broadband Home | 57 | 21.2% |
| Cellular Data Only | 71 | 26.4% |
| Satellite Internet | 119 | 44.2% |
| No Internet | 27 | 10.0% |
| Total | 269 | 100.0% |
Lytle Creek Summary
Lytle Creek is a small unincorporated community located in the San Bernardino Mountains of San Bernardino County, California. It is situated in the foothills of the San Gabriel Mountains, approximately 25 miles east of San Bernardino. The community is located along Lytle Creek, a tributary of the Santa Ana River.
History
The area now known as Lytle Creek was originally inhabited by the Serrano Indians. The first Europeans to settle in the area were Spanish missionaries, who established a mission in the area in 1810. The area was later settled by American settlers in the mid-1800s. The first post office in the area was established in 1887.
The community was named after William Lytle, who was a prominent rancher in the area. He owned a large ranch in the area and was a major contributor to the development of the community.
Geography
Lytle Creek is located in the San Bernardino Mountains of San Bernardino County, California. It is situated in the foothills of the San Gabriel Mountains, approximately 25 miles east of San Bernardino. The community is located along Lytle Creek, a tributary of the Santa Ana River.
The area is characterized by steep terrain, with elevations ranging from 1,500 to 4,000 feet. The climate is semi-arid, with hot summers and mild winters. The average annual precipitation is approximately 15 inches.
Economy
The economy of Lytle Creek is largely based on tourism and recreation. The area is home to several campgrounds, hiking trails, and other outdoor recreational activities. The area is also home to several small businesses, including restaurants, stores, and other services.
Demographics
As of the 2010 census, the population of Lytle Creek was 1,845. The racial makeup of the community was 79.3% White, 0.7% African American, 0.7% Native American, 0.7% Asian, 0.2% Pacific Islander, and 17.2% from other races. The median household income was $41,250, and the median family income was $45,000.
Conclusion
Lytle Creek is a small unincorporated community located in the San Bernardino Mountains of San Bernardino County, California. It is situated in the foothills of the San Gabriel Mountains, approximately 25 miles east of San Bernardino. The community is located along Lytle Creek, a tributary of the Santa Ana River. The economy of Lytle Creek is largely based on tourism and recreation, and the area is home to several campgrounds, hiking trails, and other outdoor recreational activities. As of the 2010 census, the population of Lytle Creek was 1,845. The racial makeup of the community was 79.3% White, 0.7% African American, 0.7% Native American, 0.7% Asian, 0.2% Pacific Islander, and 17.2% from other races. The median household income was $41,250, and the median family income was $45,000.
Common Questions
What is Per Capita Income in Lytle Creek?
Per Capita income in Lytle Creek is $34,607.
What is the Median Family Income in Lytle Creek?
Median Family Income in Lytle Creek is $62,039.
What is the Median Household income in Lytle Creek?
Median Household Income in Lytle Creek is $56,607.
What is Inequality or Gini Index in Lytle Creek?
Inequality or Gini Index in Lytle Creek is 0.36.
What is the Total Population of Lytle Creek?
Total Population of Lytle Creek is 528.
What is the Total Male Population of Lytle Creek?
Total Male Population of Lytle Creek is 290.
What is the Total Female Population of Lytle Creek?
Total Female Population of Lytle Creek is 238.
What is the Ratio of Males per 100 Females in Lytle Creek?
There are 121.85 Males per 100 Females in Lytle Creek.
What is the Ratio of Females per 100 Males in Lytle Creek?
There are 82.07 Females per 100 Males in Lytle Creek.
What is the Median Population Age in Lytle Creek?
Median Population Age in Lytle Creek is 53.6 Years.
What is the Average Family Size in Lytle Creek
Average Family Size in Lytle Creek is 2.4 People.
What is the Average Household Size in Lytle Creek
Average Household Size in Lytle Creek is 1.8 People.
How Large is the Labor Force in Lytle Creek?
There are 252 People in the Labor Forcein in Lytle Creek.
What is the Percentage of People in the Labor Force in Lytle Creek?
51.9% of People are in the Labor Force in Lytle Creek.
What is the Unemployment Rate in Lytle Creek?
Unemployment Rate in Lytle Creek is 12.3%.