Cities with the Highest Percentage of Population Employed in Accommodation & Food Services in Indiana
RELATED REPORTS & OPTIONS
Accommodation & Food Services
Indiana
Compare Cities
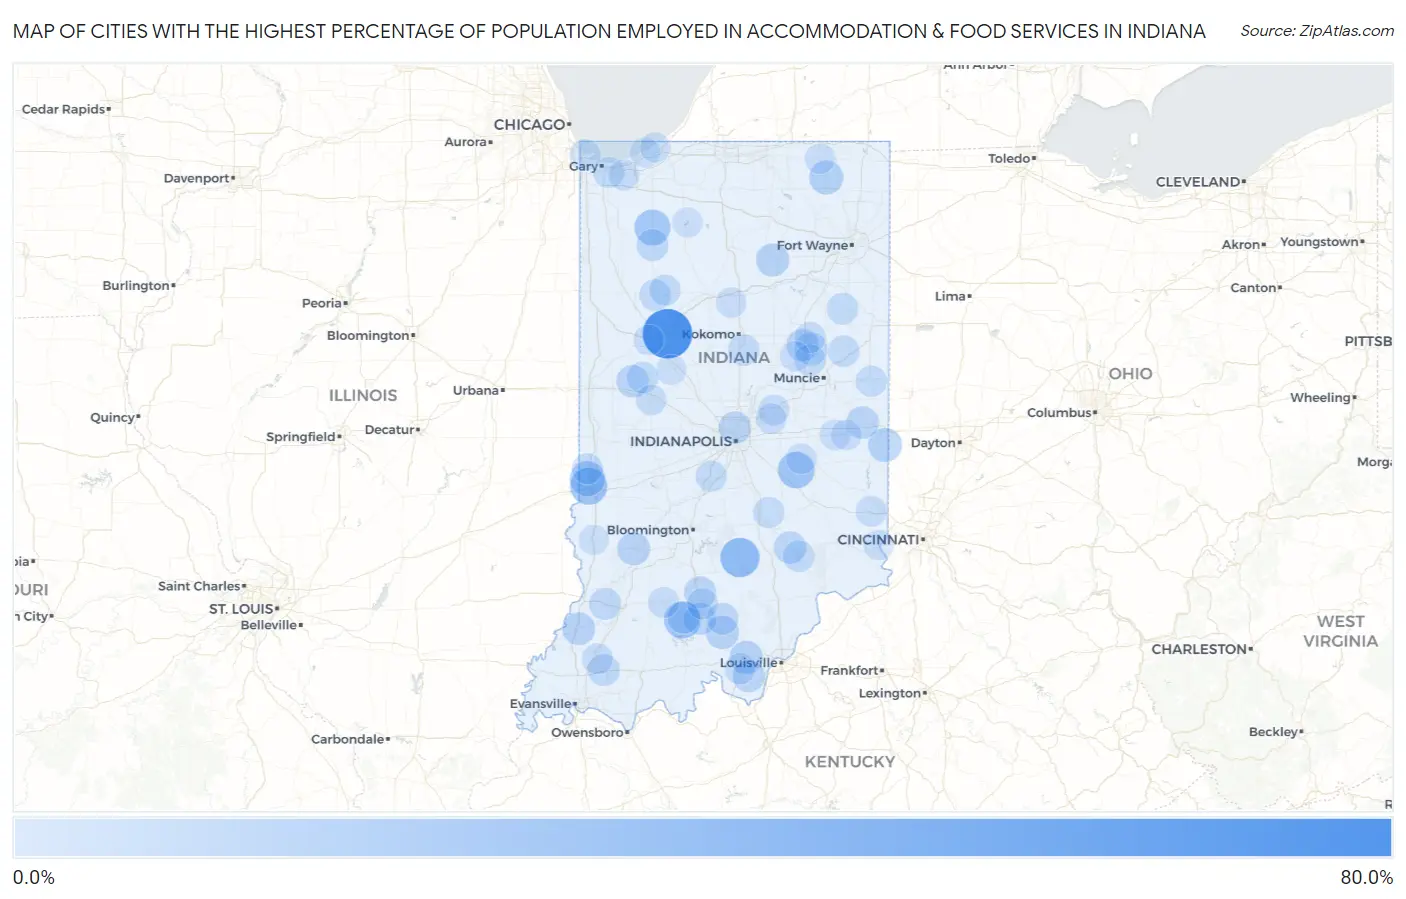
Map of Cities with the Highest Percentage of Population Employed in Accommodation & Food Services in Indiana
0.0%
80.0%
Cities with the Highest Percentage of Population Employed in Accommodation & Food Services in Indiana
| City | % Employed | vs State | vs National | |
| 1. | Buck Creek | 61.4% | 6.4%(+55.0)#1 | 6.9%(+54.5)#86 |
| 2. | Amity | 56.2% | 6.4%(+49.8)#2 | 6.9%(+49.3)#113 |
| 3. | Billtown | 49.2% | 6.4%(+42.7)#3 | 6.9%(+42.3)#174 |
| 4. | Eminence | 49.0% | 6.4%(+42.5)#4 | 6.9%(+42.1)#176 |
| 5. | Maxwell | 44.7% | 6.4%(+38.3)#5 | 6.9%(+37.9)#213 |
| 6. | Foster | 42.0% | 6.4%(+35.6)#6 | 6.9%(+35.2)#244 |
| 7. | Keystone | 39.5% | 6.4%(+33.0)#7 | 6.9%(+32.6)#276 |
| 8. | Freetown | 34.5% | 6.4%(+28.0)#8 | 6.9%(+27.6)#364 |
| 9. | Servia | 33.2% | 6.4%(+26.7)#9 | 6.9%(+26.3)#395 |
| 10. | Pittsburg | 31.0% | 6.4%(+24.5)#10 | 6.9%(+24.1)#453 |
| 11. | Arthur | 30.5% | 6.4%(+24.0)#11 | 6.9%(+23.6)#470 |
| 12. | St. Anthony | 30.4% | 6.4%(+23.9)#12 | 6.9%(+23.5)#473 |
| 13. | West Terre Haute | 28.8% | 6.4%(+22.4)#13 | 6.9%(+21.9)#518 |
| 14. | French Lick | 28.6% | 6.4%(+22.1)#14 | 6.9%(+21.7)#533 |
| 15. | New Lisbon | 28.6% | 6.4%(+22.1)#15 | 6.9%(+21.7)#540 |
| 16. | Manilla | 27.8% | 6.4%(+21.4)#16 | 6.9%(+20.9)#573 |
| 17. | Anoka | 27.3% | 6.4%(+20.8)#17 | 6.9%(+20.4)#595 |
| 18. | Cross Plains | 27.0% | 6.4%(+20.6)#18 | 6.9%(+20.1)#611 |
| 19. | San Pierre | 26.1% | 6.4%(+19.6)#19 | 6.9%(+19.2)#666 |
| 20. | Holiday Woods | 25.9% | 6.4%(+19.5)#20 | 6.9%(+19.0)#680 |
| 21. | Scott | 25.3% | 6.4%(+18.8)#21 | 6.9%(+18.4)#713 |
| 22. | Stone Bluff | 24.5% | 6.4%(+18.0)#22 | 6.9%(+17.6)#774 |
| 23. | St Mary Of The Woods | 24.2% | 6.4%(+17.7)#23 | 6.9%(+17.3)#800 |
| 24. | Saugany Lake | 23.4% | 6.4%(+16.9)#24 | 6.9%(+16.5)#870 |
| 25. | Mays | 21.4% | 6.4%(+15.0)#25 | 6.9%(+14.5)#1,062 |
| 26. | Libertyville | 21.3% | 6.4%(+14.9)#26 | 6.9%(+14.5)#1,076 |
| 27. | Wolcottville | 21.3% | 6.4%(+14.9)#27 | 6.9%(+14.4)#1,081 |
| 28. | Boston | 21.2% | 6.4%(+14.7)#28 | 6.9%(+14.3)#1,102 |
| 29. | Bennetts Switch | 20.3% | 6.4%(+13.9)#29 | 6.9%(+13.4)#1,205 |
| 30. | Perkinsville | 19.7% | 6.4%(+13.3)#30 | 6.9%(+12.9)#1,294 |
| 31. | Belleville | 19.6% | 6.4%(+13.2)#31 | 6.9%(+12.7)#1,309 |
| 32. | Centerton | 19.6% | 6.4%(+13.1)#32 | 6.9%(+12.7)#1,314 |
| 33. | Crandall | 19.3% | 6.4%(+12.9)#33 | 6.9%(+12.4)#1,364 |
| 34. | Deer Creek | 19.3% | 6.4%(+12.9)#34 | 6.9%(+12.4)#1,370 |
| 35. | Laketon | 19.2% | 6.4%(+12.7)#35 | 6.9%(+12.3)#1,394 |
| 36. | Hardinsburg | 19.1% | 6.4%(+12.7)#36 | 6.9%(+12.3)#1,399 |
| 37. | Marietta | 18.3% | 6.4%(+11.8)#37 | 6.9%(+11.4)#1,569 |
| 38. | Switz City | 18.2% | 6.4%(+11.8)#38 | 6.9%(+11.4)#1,572 |
| 39. | Lake Holiday Hideaway | 18.2% | 6.4%(+11.7)#39 | 6.9%(+11.3)#1,585 |
| 40. | Hazleton | 18.2% | 6.4%(+11.7)#40 | 6.9%(+11.3)#1,587 |
| 41. | Matthews | 18.0% | 6.4%(+11.5)#41 | 6.9%(+11.1)#1,633 |
| 42. | Greens Fork | 17.9% | 6.4%(+11.5)#42 | 6.9%(+11.0)#1,639 |
| 43. | Wingate | 17.5% | 6.4%(+11.0)#43 | 6.9%(+10.6)#1,716 |
| 44. | Fowlerton | 17.3% | 6.4%(+10.8)#44 | 6.9%(+10.4)#1,765 |
| 45. | Paoli | 17.3% | 6.4%(+10.8)#45 | 6.9%(+10.4)#1,770 |
| 46. | Crows Nest | 17.2% | 6.4%(+10.8)#46 | 6.9%(+10.4)#1,779 |
| 47. | Country Squire Lakes | 17.2% | 6.4%(+10.8)#47 | 6.9%(+10.3)#1,784 |
| 48. | West Baden Springs | 17.1% | 6.4%(+10.6)#48 | 6.9%(+10.2)#1,817 |
| 49. | Mitchell | 17.0% | 6.4%(+10.5)#49 | 6.9%(+10.1)#1,846 |
| 50. | New Middletown | 16.7% | 6.4%(+10.2)#50 | 6.9%(+9.79)#1,914 |
| 51. | Medaryville | 16.2% | 6.4%(+9.76)#51 | 6.9%(+9.31)#2,030 |
| 52. | Tyner | 16.1% | 6.4%(+9.66)#52 | 6.9%(+9.22)#2,071 |
| 53. | Wheatland | 16.0% | 6.4%(+9.60)#53 | 6.9%(+9.16)#2,089 |
| 54. | Lynnville | 15.9% | 6.4%(+9.46)#54 | 6.9%(+9.02)#2,138 |
| 55. | Livonia | 15.6% | 6.4%(+9.12)#55 | 6.9%(+8.67)#2,260 |
| 56. | Thayer | 15.5% | 6.4%(+9.05)#56 | 6.9%(+8.61)#2,274 |
| 57. | Dunkirk | 15.3% | 6.4%(+8.89)#57 | 6.9%(+8.45)#2,324 |
| 58. | Lake Everett | 15.2% | 6.4%(+8.71)#58 | 6.9%(+8.27)#2,378 |
| 59. | Poneto | 15.1% | 6.4%(+8.68)#59 | 6.9%(+8.24)#2,393 |
| 60. | Reynolds | 15.1% | 6.4%(+8.66)#60 | 6.9%(+8.21)#2,401 |
| 61. | Vernon | 15.0% | 6.4%(+8.60)#61 | 6.9%(+8.16)#2,431 |
| 62. | New Richmond | 15.0% | 6.4%(+8.53)#62 | 6.9%(+8.09)#2,456 |
| 63. | Sharpsville | 14.9% | 6.4%(+8.46)#63 | 6.9%(+8.02)#2,486 |
| 64. | Gaston | 14.6% | 6.4%(+8.20)#64 | 6.9%(+7.75)#2,578 |
| 65. | Clifford | 14.6% | 6.4%(+8.14)#65 | 6.9%(+7.70)#2,603 |
| 66. | Winchester | 14.6% | 6.4%(+8.13)#66 | 6.9%(+7.68)#2,614 |
| 67. | New Chicago | 14.4% | 6.4%(+7.97)#67 | 6.9%(+7.52)#2,677 |
| 68. | Bethany | 14.3% | 6.4%(+7.85)#68 | 6.9%(+7.40)#2,744 |
| 69. | Whiting | 14.3% | 6.4%(+7.83)#69 | 6.9%(+7.39)#2,751 |
| 70. | Orleans | 14.0% | 6.4%(+7.57)#70 | 6.9%(+7.12)#2,850 |
| 71. | Norway | 14.0% | 6.4%(+7.56)#71 | 6.9%(+7.12)#2,853 |
| 72. | New Goshen | 13.9% | 6.4%(+7.51)#72 | 6.9%(+7.07)#2,869 |
| 73. | Upland | 13.8% | 6.4%(+7.35)#73 | 6.9%(+6.91)#2,951 |
| 74. | Shoals | 13.8% | 6.4%(+7.33)#74 | 6.9%(+6.89)#2,961 |
| 75. | St Leon | 13.6% | 6.4%(+7.20)#75 | 6.9%(+6.76)#3,028 |
| 76. | Corydon | 13.6% | 6.4%(+7.19)#76 | 6.9%(+6.75)#3,046 |
| 77. | Helmsburg | 13.4% | 6.4%(+6.96)#77 | 6.9%(+6.52)#3,159 |
| 78. | Somerville | 13.4% | 6.4%(+6.96)#78 | 6.9%(+6.52)#3,160 |
| 79. | Lake Eliza | 13.4% | 6.4%(+6.96)#79 | 6.9%(+6.51)#3,165 |
| 80. | Ingalls | 13.4% | 6.4%(+6.94)#80 | 6.9%(+6.50)#3,169 |
| 81. | Crawfordsville | 13.2% | 6.4%(+6.76)#81 | 6.9%(+6.32)#3,256 |
| 82. | South Haven | 13.1% | 6.4%(+6.70)#82 | 6.9%(+6.26)#3,286 |
| 83. | Straughn | 13.0% | 6.4%(+6.57)#83 | 6.9%(+6.13)#3,367 |
| 84. | Chain-O-Lakes | 13.0% | 6.4%(+6.55)#84 | 6.9%(+6.11)#3,374 |
| 85. | Poland | 13.0% | 6.4%(+6.55)#85 | 6.9%(+6.11)#3,376 |
| 86. | Mount Auburn | 12.8% | 6.4%(+6.33)#86 | 6.9%(+5.88)#3,506 |
| 87. | Arlington | 12.6% | 6.4%(+6.20)#87 | 6.9%(+5.76)#3,587 |
| 88. | Fortville | 12.6% | 6.4%(+6.19)#88 | 6.9%(+5.75)#3,591 |
| 89. | West Lafayette | 12.6% | 6.4%(+6.16)#89 | 6.9%(+5.71)#3,617 |
| 90. | Lagrange | 12.4% | 6.4%(+5.93)#90 | 6.9%(+5.49)#3,769 |
| 91. | Onward | 12.3% | 6.4%(+5.89)#91 | 6.9%(+5.45)#3,793 |
| 92. | Summitville | 12.3% | 6.4%(+5.88)#92 | 6.9%(+5.44)#3,798 |
| 93. | Bethel | 12.3% | 6.4%(+5.86)#93 | 6.9%(+5.42)#3,806 |
| 94. | Aurora | 12.3% | 6.4%(+5.84)#94 | 6.9%(+5.40)#3,830 |
| 95. | Clarks Hill | 12.1% | 6.4%(+5.64)#95 | 6.9%(+5.19)#3,951 |
| 96. | Bass Lake | 12.1% | 6.4%(+5.63)#96 | 6.9%(+5.19)#3,953 |
| 97. | Town Of Pines | 12.0% | 6.4%(+5.60)#97 | 6.9%(+5.16)#3,978 |
| 98. | Pottawattamie Park | 11.9% | 6.4%(+5.45)#98 | 6.9%(+5.01)#4,089 |
| 99. | Sullivan | 11.8% | 6.4%(+5.37)#99 | 6.9%(+4.93)#4,143 |
| 100. | Prospect | 11.8% | 6.4%(+5.36)#100 | 6.9%(+4.91)#4,154 |
Common Questions
What are the Top 10 Cities with the Highest Percentage of Population Employed in Accommodation & Food Services in Indiana?
Top 10 Cities with the Highest Percentage of Population Employed in Accommodation & Food Services in Indiana are:
#1
61.4%
#2
34.5%
#3
28.8%
#4
28.6%
#5
27.8%
#6
26.1%
#7
24.2%
#8
21.3%
#9
21.2%
#10
19.3%
What city has the Highest Percentage of Population Employed in Accommodation & Food Services in Indiana?
Buck Creek has the Highest Percentage of Population Employed in Accommodation & Food Services in Indiana with 61.4%.
What is the Percentage of Population Employed in Accommodation & Food Services in the State of Indiana?
Percentage of Population Employed in Accommodation & Food Services in Indiana is 6.4%.
What is the Percentage of Population Employed in Accommodation & Food Services in the United States?
Percentage of Population Employed in Accommodation & Food Services in the United States is 6.9%.