States with the Highest Percentage of Population Employed in Accommodation & Food Services
RELATED REPORTS & OPTIONS
Accommodation & Food Services
United States
Compare States
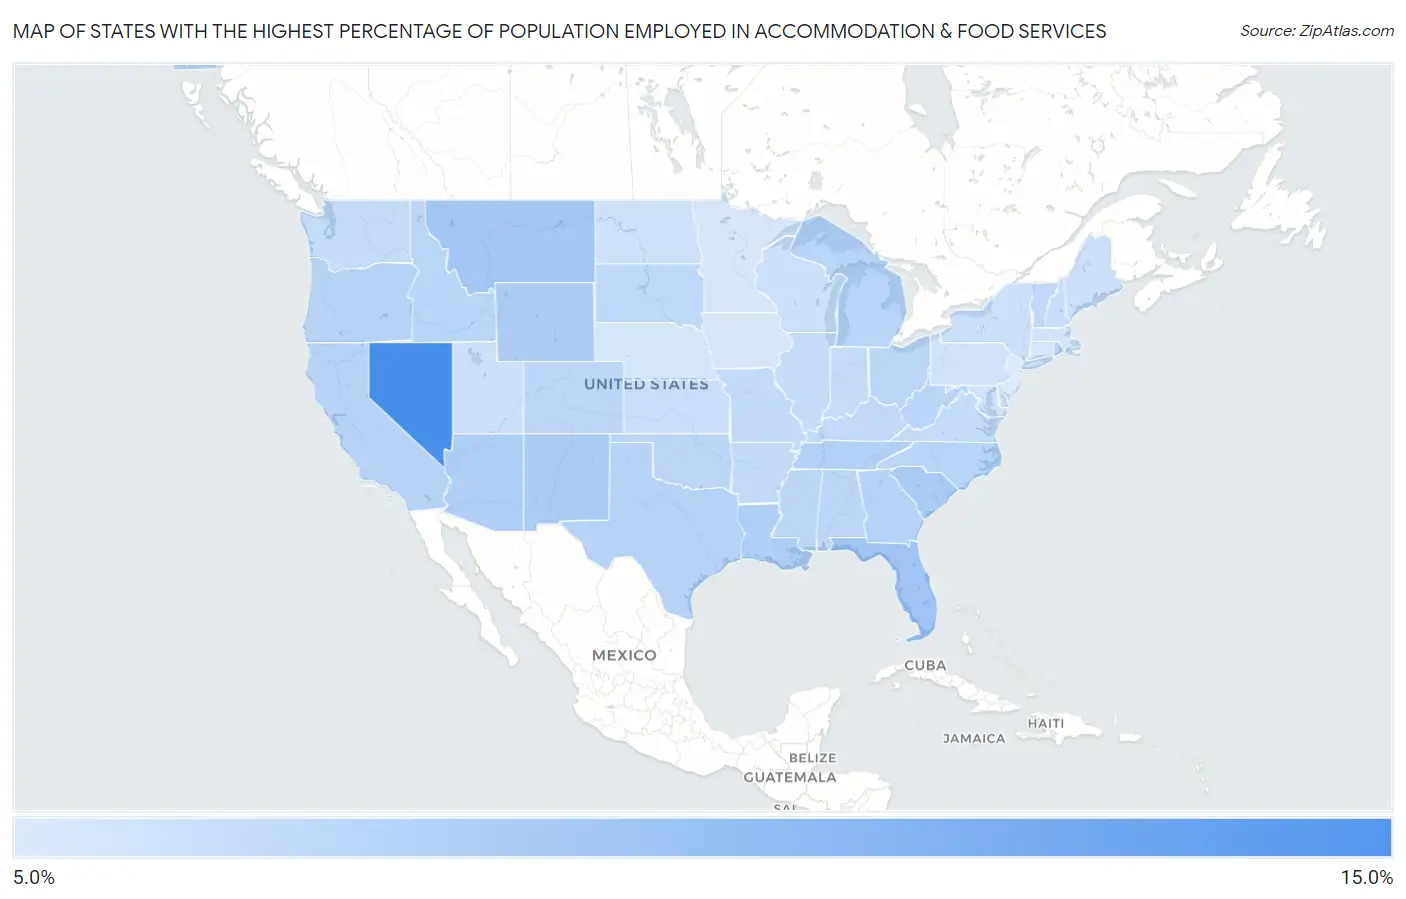
Map of States with the Highest Percentage of Population Employed in Accommodation & Food Services
5.0%
15.0%
States with the Highest Percentage of Population Employed in Accommodation & Food Services in the United States
| State | % Employed | vs State Median | vs National | |
| 1. | Nevada | 13.3% | 6.8% (+6.44) | 6.9%(+6.39) |
| 2. | Hawaii | 13.0% | 6.8% (+6.14) | 6.9%(+6.08) |
| 3. | Florida | 8.4% | 6.8% (+1.54) | 6.9%(+1.49) |
| 4. | Montana | 8.3% | 6.8% (+1.44) | 6.9%(+1.39) |
| 5. | South Carolina | 8.0% | 6.8% (+1.14) | 6.9%(+1.09) |
| 6. | New Mexico | 7.9% | 6.8% (+1.11) | 6.9%(+1.05) |
| 7. | Wyoming | 7.8% | 6.8% (+0.998) | 6.9%(+0.946) |
| 8. | Louisiana | 7.6% | 6.8% (+0.782) | 6.9%(+0.729) |
| 9. | Arizona | 7.6% | 6.8% (+0.726) | 6.9%(+0.673) |
| 10. | Tennessee | 7.4% | 6.8% (+0.563) | 6.9%(+0.510) |
| 11. | Oregon | 7.2% | 6.8% (+0.397) | 6.9%(+0.345) |
| 12. | Georgia | 7.2% | 6.8% (+0.378) | 6.9%(+0.325) |
| 13. | Texas | 7.2% | 6.8% (+0.377) | 6.9%(+0.325) |
| 14. | California | 7.2% | 6.8% (+0.343) | 6.9%(+0.290) |
| 15. | Idaho | 7.1% | 6.8% (+0.289) | 6.9%(+0.236) |
| 16. | Michigan | 7.1% | 6.8% (+0.255) | 6.9%(+0.203) |
| 17. | West Virginia | 7.1% | 6.8% (+0.249) | 6.9%(+0.197) |
| 18. | North Carolina | 7.0% | 6.8% (+0.221) | 6.9%(+0.168) |
| 19. | Rhode Island | 7.0% | 6.8% (+0.182) | 6.9%(+0.130) |
| 20. | Ohio | 7.0% | 6.8% (+0.180) | 6.9%(+0.128) |
| 21. | Oklahoma | 7.0% | 6.8% (+0.161) | 6.9%(+0.108) |
| 22. | Mississippi | 6.9% | 6.8% (+0.080) | 6.9%(+0.027) |
| 23. | Colorado | 6.9% | 6.8% (+0.073) | 6.9%(+0.020) |
| 24. | Alabama | 6.9% | 6.8% (+0.066) | 6.9%(+0.014) |
| 25. | South Dakota | 6.8% | 6.8% (+0.004) | 6.9%(-0.049) |
| 26. | Alaska | 6.8% | 6.8% (-0.004) | 6.9%(-0.056) |
| 27. | Vermont | 6.7% | 6.8% (-0.145) | 6.9%(-0.198) |
| 28. | Kentucky | 6.7% | 6.8% (-0.159) | 6.9%(-0.211) |
| 29. | Arkansas | 6.6% | 6.8% (-0.189) | 6.9%(-0.242) |
| 30. | Missouri | 6.6% | 6.8% (-0.254) | 6.9%(-0.307) |
| 31. | Illinois | 6.5% | 6.8% (-0.359) | 6.9%(-0.411) |
| 32. | Washington | 6.5% | 6.8% (-0.366) | 6.9%(-0.418) |
| 33. | Virginia | 6.4% | 6.8% (-0.387) | 6.9%(-0.440) |
| 34. | Indiana | 6.4% | 6.8% (-0.390) | 6.9%(-0.442) |
| 35. | Delaware | 6.3% | 6.8% (-0.505) | 6.9%(-0.558) |
| 36. | New Hampshire | 6.3% | 6.8% (-0.525) | 6.9%(-0.578) |
| 37. | Kansas | 6.2% | 6.8% (-0.604) | 6.9%(-0.657) |
| 38. | New York | 6.2% | 6.8% (-0.664) | 6.9%(-0.717) |
| 39. | Utah | 6.1% | 6.8% (-0.709) | 6.9%(-0.761) |
| 40. | Maine | 6.1% | 6.8% (-0.724) | 6.9%(-0.777) |
| 41. | Wisconsin | 6.1% | 6.8% (-0.728) | 6.9%(-0.781) |
| 42. | North Dakota | 6.0% | 6.8% (-0.804) | 6.9%(-0.857) |
| 43. | Pennsylvania | 5.9% | 6.8% (-0.939) | 6.9%(-0.992) |
| 44. | Maryland | 5.8% | 6.8% (-0.981) | 6.9%(-1.03) |
| 45. | Massachusetts | 5.8% | 6.8% (-1.07) | 6.9%(-1.12) |
| 46. | Nebraska | 5.7% | 6.8% (-1.14) | 6.9%(-1.19) |
| 47. | Connecticut | 5.6% | 6.8% (-1.19) | 6.9%(-1.25) |
| 48. | Minnesota | 5.5% | 6.8% (-1.31) | 6.9%(-1.37) |
| 49. | Iowa | 5.5% | 6.8% (-1.33) | 6.9%(-1.39) |
| 50. | New Jersey | 5.3% | 6.8% (-1.55) | 6.9%(-1.60) |
1
Common Questions
What are the Top 10 States with the Highest Percentage of Population Employed in Accommodation & Food Services in the United States?
Top 10 States with the Highest Percentage of Population Employed in Accommodation & Food Services in the United States are:
#1
13.3%
#2
13.0%
#3
8.4%
#4
8.3%
#5
8.0%
#6
7.9%
#7
7.8%
#8
7.6%
#9
7.6%
#10
7.4%
What state has the Highest Percentage of Population Employed in Accommodation & Food Services in the United States?
Nevada has the Highest Percentage of Population Employed in Accommodation & Food Services in the United States with 13.3%.
What is the Percentage of Population Employed in Accommodation & Food Services in the United States?
Percentage of Population Employed in Accommodation & Food Services in the United States is 6.9%.