Cities with the Highest Percentage of Population Employed in Accommodation & Food Services in Minnesota
RELATED REPORTS & OPTIONS
Accommodation & Food Services
Minnesota
Compare Cities
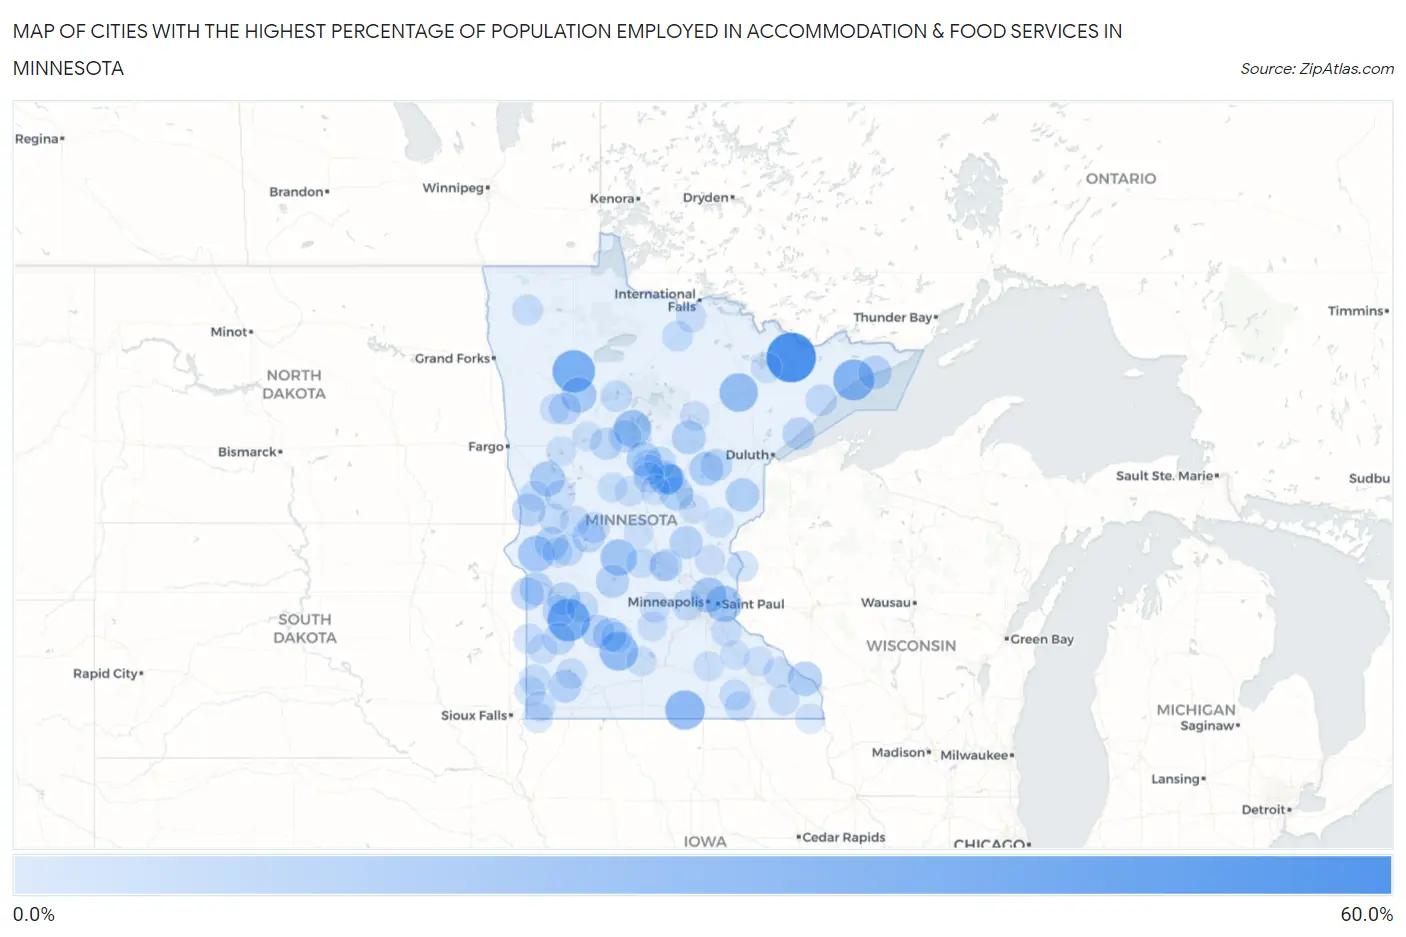
Map of Cities with the Highest Percentage of Population Employed in Accommodation & Food Services in Minnesota
0.0%
60.0%
Cities with the Highest Percentage of Population Employed in Accommodation & Food Services in Minnesota
| City | % Employed | vs State | vs National | |
| 1. | Winton | 52.6% | 5.5%(+47.1)#1 | 6.9%(+45.8)#134 |
| 2. | Hubbard | 44.4% | 5.5%(+38.9)#2 | 6.9%(+37.6)#219 |
| 3. | Hazel Run | 37.0% | 5.5%(+31.5)#3 | 6.9%(+30.2)#312 |
| 4. | Gully | 36.7% | 5.5%(+31.2)#4 | 6.9%(+29.8)#322 |
| 5. | Lutsen | 33.6% | 5.5%(+28.1)#5 | 6.9%(+26.7)#374 |
| 6. | Walters | 30.0% | 5.5%(+24.5)#6 | 6.9%(+23.1)#484 |
| 7. | Evan | 28.2% | 5.5%(+22.7)#7 | 6.9%(+21.3)#552 |
| 8. | Kinney | 28.0% | 5.5%(+22.5)#8 | 6.9%(+21.1)#566 |
| 9. | Walker | 25.1% | 5.5%(+19.6)#9 | 6.9%(+18.3)#720 |
| 10. | Spring Hill | 23.4% | 5.5%(+17.9)#10 | 6.9%(+16.6)#863 |
| 11. | Landfall | 23.3% | 5.5%(+17.7)#11 | 6.9%(+16.4)#883 |
| 12. | Johnson | 23.1% | 5.5%(+17.6)#12 | 6.9%(+16.2)#899 |
| 13. | Ebro | 21.4% | 5.5%(+15.9)#13 | 6.9%(+14.5)#1,065 |
| 14. | Hilltop | 21.2% | 5.5%(+15.6)#14 | 6.9%(+14.3)#1,099 |
| 15. | Erhard | 20.0% | 5.5%(+14.5)#15 | 6.9%(+13.1)#1,248 |
| 16. | Homer | 19.0% | 5.5%(+13.5)#16 | 6.9%(+12.2)#1,412 |
| 17. | Pine River | 18.4% | 5.5%(+12.9)#17 | 6.9%(+11.5)#1,533 |
| 18. | Mcgregor | 18.3% | 5.5%(+12.8)#18 | 6.9%(+11.4)#1,546 |
| 19. | Hill City | 18.0% | 5.5%(+12.5)#19 | 6.9%(+11.1)#1,624 |
| 20. | Garrison | 17.9% | 5.5%(+12.3)#20 | 6.9%(+11.0)#1,648 |
| 21. | Morton | 17.8% | 5.5%(+12.3)#21 | 6.9%(+10.9)#1,656 |
| 22. | Trommald | 17.8% | 5.5%(+12.3)#22 | 6.9%(+10.9)#1,663 |
| 23. | Bruno | 17.6% | 5.5%(+12.1)#23 | 6.9%(+10.8)#1,694 |
| 24. | Grand Marais | 17.3% | 5.5%(+11.8)#24 | 6.9%(+10.5)#1,750 |
| 25. | Donnelly | 17.3% | 5.5%(+11.8)#25 | 6.9%(+10.4)#1,754 |
| 26. | Ironton | 16.9% | 5.5%(+11.4)#26 | 6.9%(+10.0)#1,857 |
| 27. | Bellingham | 16.7% | 5.5%(+11.2)#27 | 6.9%(+9.79)#1,904 |
| 28. | Delhi | 16.7% | 5.5%(+11.2)#28 | 6.9%(+9.79)#1,917 |
| 29. | Spicer | 16.5% | 5.5%(+11.0)#29 | 6.9%(+9.60)#1,961 |
| 30. | Pease | 16.2% | 5.5%(+10.7)#30 | 6.9%(+9.36)#2,022 |
| 31. | Watson | 16.1% | 5.5%(+10.6)#31 | 6.9%(+9.25)#2,060 |
| 32. | Campbell | 16.1% | 5.5%(+10.6)#32 | 6.9%(+9.25)#2,061 |
| 33. | Iona | 16.1% | 5.5%(+10.6)#33 | 6.9%(+9.19)#2,082 |
| 34. | Nassau | 15.8% | 5.5%(+10.3)#34 | 6.9%(+8.91)#2,174 |
| 35. | Boyd | 15.4% | 5.5%(+9.87)#35 | 6.9%(+8.50)#2,303 |
| 36. | Forada | 15.4% | 5.5%(+9.87)#36 | 6.9%(+8.50)#2,305 |
| 37. | Two Harbors | 15.4% | 5.5%(+9.86)#37 | 6.9%(+8.50)#2,311 |
| 38. | Akeley | 15.1% | 5.5%(+9.61)#38 | 6.9%(+8.25)#2,390 |
| 39. | Ghent | 14.9% | 5.5%(+9.40)#39 | 6.9%(+8.04)#2,478 |
| 40. | St. John's University | 14.6% | 5.5%(+9.13)#40 | 6.9%(+7.76)#2,575 |
| 41. | Park Rapids | 14.5% | 5.5%(+9.02)#41 | 6.9%(+7.66)#2,623 |
| 42. | Tamarack | 14.3% | 5.5%(+8.77)#42 | 6.9%(+7.40)#2,737 |
| 43. | Midway | 14.3% | 5.5%(+8.77)#43 | 6.9%(+7.40)#2,746 |
| 44. | Crown College | 14.0% | 5.5%(+8.45)#44 | 6.9%(+7.08)#2,864 |
| 45. | Clear Lake | 13.9% | 5.5%(+8.43)#45 | 6.9%(+7.06)#2,871 |
| 46. | Cyrus | 13.8% | 5.5%(+8.28)#46 | 6.9%(+6.91)#2,945 |
| 47. | Finland | 13.6% | 5.5%(+8.12)#47 | 6.9%(+6.76)#3,034 |
| 48. | Jenkins | 13.3% | 5.5%(+7.74)#48 | 6.9%(+6.37)#3,234 |
| 49. | Crosslake | 13.2% | 5.5%(+7.67)#49 | 6.9%(+6.31)#3,260 |
| 50. | Bemidji | 13.1% | 5.5%(+7.59)#50 | 6.9%(+6.22)#3,315 |
| 51. | Nelson | 13.0% | 5.5%(+7.45)#51 | 6.9%(+6.08)#3,387 |
| 52. | Spring Park | 13.0% | 5.5%(+7.44)#52 | 6.9%(+6.07)#3,390 |
| 53. | Maynard | 12.8% | 5.5%(+7.30)#53 | 6.9%(+5.94)#3,474 |
| 54. | Sargeant | 12.5% | 5.5%(+6.98)#54 | 6.9%(+5.62)#3,693 |
| 55. | Franklin | 12.4% | 5.5%(+6.88)#55 | 6.9%(+5.52)#3,743 |
| 56. | Pipestone | 12.4% | 5.5%(+6.84)#56 | 6.9%(+5.47)#3,781 |
| 57. | Foxhome | 12.3% | 5.5%(+6.77)#57 | 6.9%(+5.40)#3,826 |
| 58. | Taylors Falls | 12.2% | 5.5%(+6.66)#58 | 6.9%(+5.30)#3,887 |
| 59. | Deerwood | 12.0% | 5.5%(+6.53)#59 | 6.9%(+5.17)#3,970 |
| 60. | Pequot Lakes | 12.0% | 5.5%(+6.48)#60 | 6.9%(+5.12)#4,003 |
| 61. | Cold Spring | 11.9% | 5.5%(+6.42)#61 | 6.9%(+5.06)#4,048 |
| 62. | Big Falls | 11.8% | 5.5%(+6.33)#62 | 6.9%(+4.96)#4,124 |
| 63. | Currie | 11.8% | 5.5%(+6.25)#63 | 6.9%(+4.88)#4,181 |
| 64. | Elba | 11.8% | 5.5%(+6.25)#64 | 6.9%(+4.88)#4,186 |
| 65. | Strandquist | 11.6% | 5.5%(+6.11)#65 | 6.9%(+4.75)#4,282 |
| 66. | Crosby | 11.5% | 5.5%(+6.02)#66 | 6.9%(+4.66)#4,333 |
| 67. | Soudan | 11.5% | 5.5%(+6.00)#67 | 6.9%(+4.64)#4,350 |
| 68. | Brandon | 11.5% | 5.5%(+5.96)#68 | 6.9%(+4.59)#4,381 |
| 69. | Nisswa | 11.4% | 5.5%(+5.92)#69 | 6.9%(+4.55)#4,421 |
| 70. | New Trier | 11.4% | 5.5%(+5.85)#70 | 6.9%(+4.48)#4,463 |
| 71. | Steen | 11.3% | 5.5%(+5.81)#71 | 6.9%(+4.44)#4,506 |
| 72. | Jasper | 11.3% | 5.5%(+5.79)#72 | 6.9%(+4.43)#4,516 |
| 73. | Elbow Lake | 11.3% | 5.5%(+5.74)#73 | 6.9%(+4.37)#4,566 |
| 74. | Luverne | 11.2% | 5.5%(+5.68)#74 | 6.9%(+4.32)#4,620 |
| 75. | Silver Lake | 11.2% | 5.5%(+5.67)#75 | 6.9%(+4.31)#4,626 |
| 76. | Whalan | 11.1% | 5.5%(+5.60)#76 | 6.9%(+4.23)#4,699 |
| 77. | Hendricks | 11.1% | 5.5%(+5.55)#77 | 6.9%(+4.19)#4,725 |
| 78. | Motley | 11.0% | 5.5%(+5.52)#78 | 6.9%(+4.16)#4,748 |
| 79. | Riverland | 11.0% | 5.5%(+5.44)#79 | 6.9%(+4.08)#4,813 |
| 80. | Elkton | 11.0% | 5.5%(+5.44)#80 | 6.9%(+4.08)#4,814 |
| 81. | Littlefork | 10.9% | 5.5%(+5.39)#81 | 6.9%(+4.02)#4,862 |
| 82. | Morris | 10.9% | 5.5%(+5.38)#82 | 6.9%(+4.01)#4,869 |
| 83. | Isanti | 10.7% | 5.5%(+5.22)#83 | 6.9%(+3.86)#5,007 |
| 84. | Underwood | 10.7% | 5.5%(+5.22)#84 | 6.9%(+3.85)#5,015 |
| 85. | Aldrich | 10.5% | 5.5%(+5.01)#85 | 6.9%(+3.65)#5,199 |
| 86. | Brook Park | 10.4% | 5.5%(+4.93)#86 | 6.9%(+3.57)#5,274 |
| 87. | La Prairie | 10.4% | 5.5%(+4.92)#87 | 6.9%(+3.55)#5,288 |
| 88. | Pine Point | 10.3% | 5.5%(+4.83)#88 | 6.9%(+3.46)#5,390 |
| 89. | Searles | 10.3% | 5.5%(+4.74)#89 | 6.9%(+3.38)#5,503 |
| 90. | Hammond | 10.2% | 5.5%(+4.71)#90 | 6.9%(+3.35)#5,529 |
| 91. | Medford | 10.2% | 5.5%(+4.71)#91 | 6.9%(+3.34)#5,533 |
| 92. | Detroit Lakes | 10.2% | 5.5%(+4.67)#92 | 6.9%(+3.30)#5,584 |
| 93. | Brainerd | 10.2% | 5.5%(+4.64)#93 | 6.9%(+3.28)#5,615 |
| 94. | New Auburn | 10.2% | 5.5%(+4.64)#94 | 6.9%(+3.28)#5,616 |
| 95. | Elmdale | 10.1% | 5.5%(+4.60)#95 | 6.9%(+3.24)#5,657 |
| 96. | Eitzen | 10.1% | 5.5%(+4.56)#96 | 6.9%(+3.20)#5,695 |
| 97. | Clearwater | 10.0% | 5.5%(+4.52)#97 | 6.9%(+3.15)#5,735 |
| 98. | Wanamingo | 10.0% | 5.5%(+4.50)#98 | 6.9%(+3.14)#5,754 |
| 99. | Wahkon | 10.0% | 5.5%(+4.48)#99 | 6.9%(+3.12)#5,773 |
| 100. | Arco | 10.0% | 5.5%(+4.48)#100 | 6.9%(+3.12)#5,793 |
Common Questions
What are the Top 10 Cities with the Highest Percentage of Population Employed in Accommodation & Food Services in Minnesota?
Top 10 Cities with the Highest Percentage of Population Employed in Accommodation & Food Services in Minnesota are:
What city has the Highest Percentage of Population Employed in Accommodation & Food Services in Minnesota?
Winton has the Highest Percentage of Population Employed in Accommodation & Food Services in Minnesota with 52.6%.
What is the Percentage of Population Employed in Accommodation & Food Services in the State of Minnesota?
Percentage of Population Employed in Accommodation & Food Services in Minnesota is 5.5%.
What is the Percentage of Population Employed in Accommodation & Food Services in the United States?
Percentage of Population Employed in Accommodation & Food Services in the United States is 6.9%.