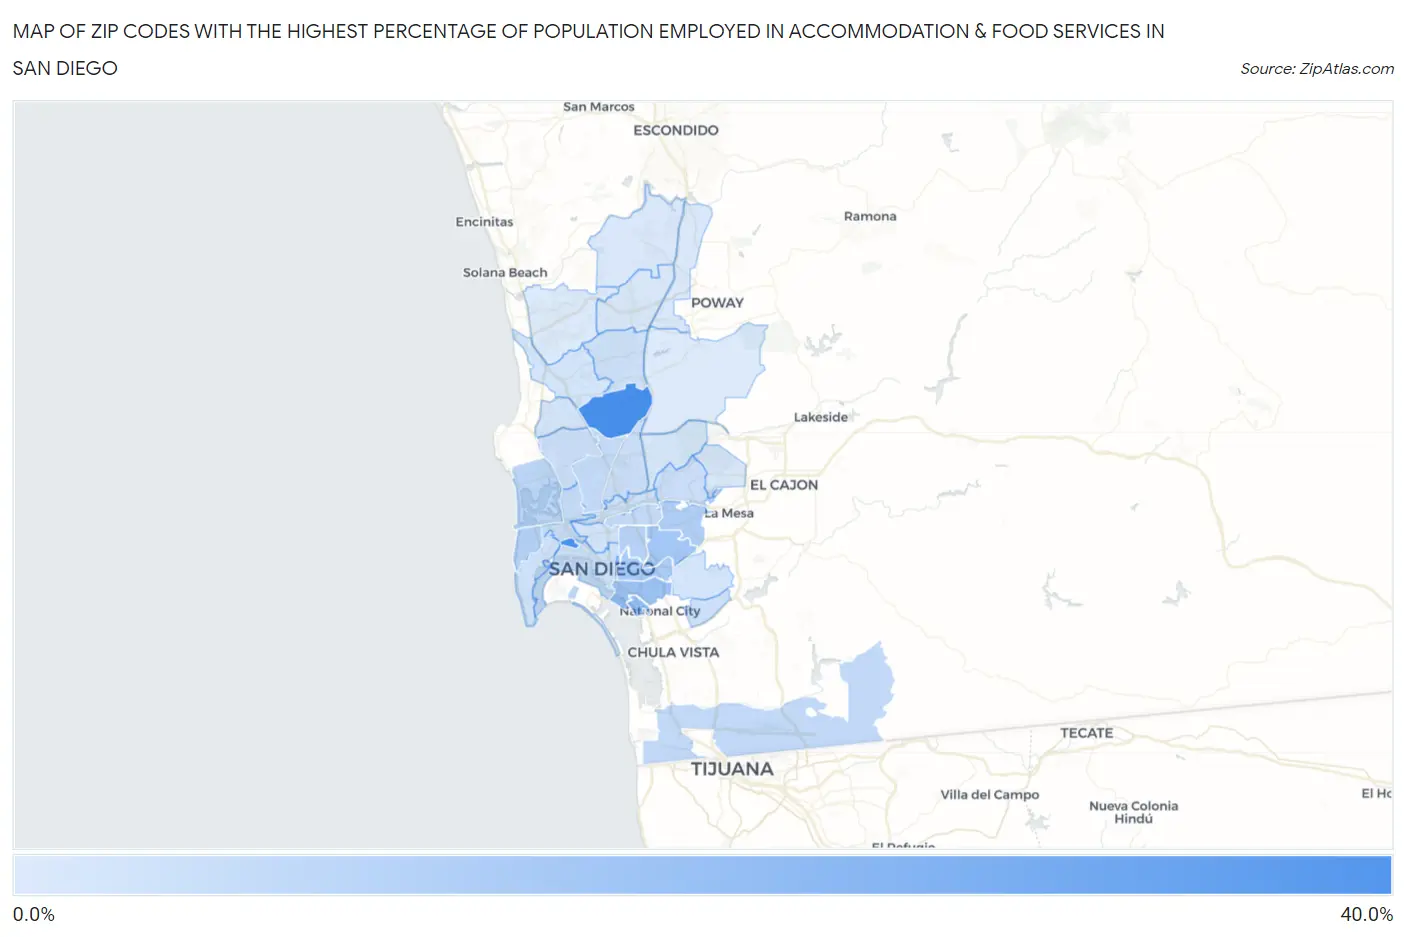
Zip Codes with the Highest Percentage of Population Employed in Accommodation & Food Services in San Diego, CA
RELATED REPORTS & OPTIONS
Accommodation & Food Services
San Diego
Compare Zip Codes
Map of Zip Codes with the Highest Percentage of Population Employed in Accommodation & Food Services in San Diego
4.1%
34.5%
Zip Codes with the Highest Percentage of Population Employed in Accommodation & Food Services in San Diego, CA
| Zip Code | % Employed | vs State | vs National | |
| 1. | 92145 | 34.5% | 7.2%(+27.3)#23 | 6.9%(+27.6)#232 |
| 2. | 92140 | 34.4% | 7.2%(+27.2)#24 | 6.9%(+27.5)#235 |
| 3. | 92136 | 17.6% | 7.2%(+10.4)#81 | 6.9%(+10.7)#1,166 |
| 4. | 92113 | 16.7% | 7.2%(+9.49)#97 | 6.9%(+9.78)#1,321 |
| 5. | 92105 | 14.9% | 7.2%(+7.75)#115 | 6.9%(+8.04)#1,690 |
| 6. | 92102 | 13.6% | 7.2%(+6.40)#139 | 6.9%(+6.69)#2,107 |
| 7. | 92115 | 12.6% | 7.2%(+5.47)#160 | 6.9%(+5.76)#2,508 |
| 8. | 92107 | 11.3% | 7.2%(+4.11)#211 | 6.9%(+4.40)#3,334 |
| 9. | 92104 | 10.7% | 7.2%(+3.53)#243 | 6.9%(+3.82)#3,800 |
| 10. | 92135 | 10.5% | 7.2%(+3.36)#257 | 6.9%(+3.65)#3,965 |
| 11. | 92109 | 9.8% | 7.2%(+2.67)#309 | 6.9%(+2.96)#4,734 |
| 12. | 92154 | 9.3% | 7.2%(+2.16)#365 | 6.9%(+2.45)#5,457 |
| 13. | 92116 | 9.0% | 7.2%(+1.82)#398 | 6.9%(+2.11)#5,977 |
| 14. | 92111 | 8.9% | 7.2%(+1.74)#405 | 6.9%(+2.03)#6,108 |
| 15. | 92110 | 8.5% | 7.2%(+1.29)#458 | 6.9%(+1.58)#6,890 |
| 16. | 92117 | 7.6% | 7.2%(+0.380)#603 | 6.9%(+0.670)#8,860 |
| 17. | 92120 | 7.5% | 7.2%(+0.346)#611 | 6.9%(+0.636)#8,957 |
| 18. | 92123 | 7.3% | 7.2%(+0.095)#662 | 6.9%(+0.385)#9,631 |
| 19. | 92139 | 7.2% | 7.2%(+0.041)#678 | 6.9%(+0.331)#9,776 |
| 20. | 92108 | 7.0% | 7.2%(-0.155)#710 | 6.9%(+0.135)#10,258 |
| 21. | 92126 | 7.0% | 7.2%(-0.212)#724 | 6.9%(+0.078)#10,449 |
| 22. | 92101 | 6.6% | 7.2%(-0.527)#790 | 6.9%(-0.237)#11,380 |
| 23. | 92106 | 6.6% | 7.2%(-0.574)#804 | 6.9%(-0.284)#11,531 |
| 24. | 92103 | 6.3% | 7.2%(-0.872)#876 | 6.9%(-0.582)#12,488 |
| 25. | 92114 | 5.8% | 7.2%(-1.35)#955 | 6.9%(-1.06)#14,026 |
| 26. | 92121 | 5.7% | 7.2%(-1.48)#981 | 6.9%(-1.19)#14,421 |
| 27. | 92122 | 5.6% | 7.2%(-1.57)#1,003 | 6.9%(-1.28)#14,702 |
| 28. | 92124 | 5.3% | 7.2%(-1.84)#1,055 | 6.9%(-1.55)#15,657 |
| 29. | 92119 | 4.9% | 7.2%(-2.24)#1,130 | 6.9%(-1.95)#17,041 |
| 30. | 92129 | 4.9% | 7.2%(-2.27)#1,139 | 6.9%(-1.98)#17,159 |
| 31. | 92127 | 4.6% | 7.2%(-2.55)#1,189 | 6.9%(-2.26)#18,086 |
| 32. | 92128 | 4.5% | 7.2%(-2.67)#1,213 | 6.9%(-2.38)#18,505 |
| 33. | 92131 | 4.3% | 7.2%(-2.88)#1,248 | 6.9%(-2.59)#19,228 |
| 34. | 92130 | 4.1% | 7.2%(-3.07)#1,273 | 6.9%(-2.78)#19,810 |
1
Common Questions
What are the Top 10 Zip Codes with the Highest Percentage of Population Employed in Accommodation & Food Services in San Diego, CA?
Top 10 Zip Codes with the Highest Percentage of Population Employed in Accommodation & Food Services in San Diego, CA are:
What zip code has the Highest Percentage of Population Employed in Accommodation & Food Services in San Diego, CA?
92145 has the Highest Percentage of Population Employed in Accommodation & Food Services in San Diego, CA with 34.5%.
What is the Percentage of Population Employed in Accommodation & Food Services in San Diego, CA?
Percentage of Population Employed in Accommodation & Food Services in San Diego is 8.2%.
What is the Percentage of Population Employed in Accommodation & Food Services in California?
Percentage of Population Employed in Accommodation & Food Services in California is 7.2%.
What is the Percentage of Population Employed in Accommodation & Food Services in the United States?
Percentage of Population Employed in Accommodation & Food Services in the United States is 6.9%.