Zip Codes with the Highest Percentage of Population Employed in Accommodation & Food Services in San Francisco, CA
RELATED REPORTS & OPTIONS
Accommodation & Food Services
San Francisco
Compare Zip Codes
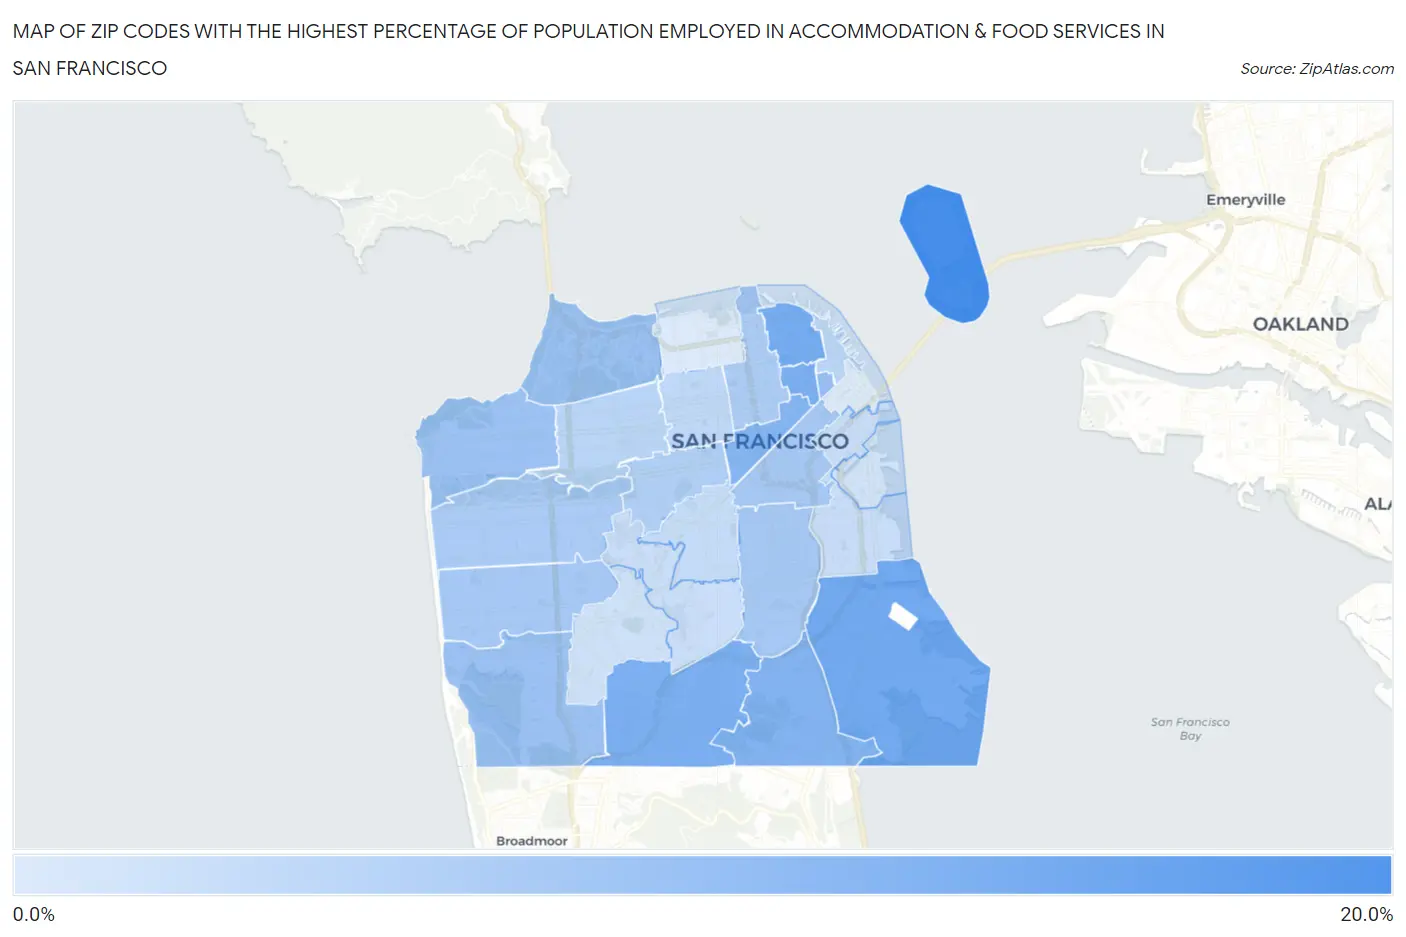
Map of Zip Codes with the Highest Percentage of Population Employed in Accommodation & Food Services in San Francisco
1.3%
16.5%
Zip Codes with the Highest Percentage of Population Employed in Accommodation & Food Services in San Francisco, CA
| Zip Code | % Employed | vs State | vs National | |
| 1. | 94130 | 16.5% | 7.2%(+9.35)#101 | 6.9%(+9.64)#1,347 |
| 2. | 94124 | 11.9% | 7.2%(+4.73)#183 | 6.9%(+5.02)#2,905 |
| 3. | 94133 | 11.5% | 7.2%(+4.33)#203 | 6.9%(+4.62)#3,156 |
| 4. | 94112 | 10.9% | 7.2%(+3.77)#225 | 6.9%(+4.06)#3,604 |
| 5. | 94108 | 10.9% | 7.2%(+3.75)#227 | 6.9%(+4.04)#3,615 |
| 6. | 94134 | 10.1% | 7.2%(+2.93)#281 | 6.9%(+3.22)#4,414 |
| 7. | 94102 | 9.8% | 7.2%(+2.65)#311 | 6.9%(+2.94)#4,756 |
| 8. | 94104 | 8.4% | 7.2%(+1.20)#476 | 6.9%(+1.49)#7,054 |
| 9. | 94121 | 7.9% | 7.2%(+0.724)#539 | 6.9%(+1.01)#8,037 |
| 10. | 94132 | 7.7% | 7.2%(+0.524)#583 | 6.9%(+0.814)#8,506 |
| 11. | 94129 | 7.6% | 7.2%(+0.440)#594 | 6.9%(+0.730)#8,729 |
| 12. | 94103 | 6.7% | 7.2%(-0.456)#769 | 6.9%(-0.166)#11,159 |
| 13. | 94110 | 6.7% | 7.2%(-0.459)#772 | 6.9%(-0.169)#11,171 |
| 14. | 94116 | 6.6% | 7.2%(-0.526)#789 | 6.9%(-0.236)#11,376 |
| 15. | 94122 | 6.3% | 7.2%(-0.911)#881 | 6.9%(-0.621)#12,604 |
| 16. | 94109 | 6.0% | 7.2%(-1.12)#922 | 6.9%(-0.834)#13,312 |
| 17. | 94117 | 5.4% | 7.2%(-1.74)#1,033 | 6.9%(-1.45)#15,282 |
| 18. | 94118 | 4.7% | 7.2%(-2.45)#1,168 | 6.9%(-2.16)#17,754 |
| 19. | 94111 | 4.6% | 7.2%(-2.57)#1,191 | 6.9%(-2.28)#18,164 |
| 20. | 94115 | 4.2% | 7.2%(-3.01)#1,268 | 6.9%(-2.72)#19,637 |
| 21. | 94114 | 3.6% | 7.2%(-3.60)#1,344 | 6.9%(-3.31)#21,571 |
| 22. | 94107 | 3.3% | 7.2%(-3.89)#1,381 | 6.9%(-3.60)#22,461 |
| 23. | 94131 | 3.0% | 7.2%(-4.21)#1,412 | 6.9%(-3.92)#23,311 |
| 24. | 94127 | 2.6% | 7.2%(-4.61)#1,448 | 6.9%(-4.32)#24,338 |
| 25. | 94158 | 2.4% | 7.2%(-4.81)#1,461 | 6.9%(-4.52)#24,796 |
| 26. | 94123 | 1.3% | 7.2%(-5.84)#1,514 | 6.9%(-5.55)#26,770 |
| 27. | 94105 | 1.3% | 7.2%(-5.88)#1,516 | 6.9%(-5.59)#26,823 |
1
Common Questions
What are the Top 10 Zip Codes with the Highest Percentage of Population Employed in Accommodation & Food Services in San Francisco, CA?
Top 10 Zip Codes with the Highest Percentage of Population Employed in Accommodation & Food Services in San Francisco, CA are:
What zip code has the Highest Percentage of Population Employed in Accommodation & Food Services in San Francisco, CA?
94130 has the Highest Percentage of Population Employed in Accommodation & Food Services in San Francisco, CA with 16.5%.
What is the Percentage of Population Employed in Accommodation & Food Services in San Francisco, CA?
Percentage of Population Employed in Accommodation & Food Services in San Francisco is 6.6%.
What is the Percentage of Population Employed in Accommodation & Food Services in California?
Percentage of Population Employed in Accommodation & Food Services in California is 7.2%.
What is the Percentage of Population Employed in Accommodation & Food Services in the United States?
Percentage of Population Employed in Accommodation & Food Services in the United States is 6.9%.