Cities with the Highest Percentage of Population Employed in Accommodation & Food Services in North Dakota
RELATED REPORTS & OPTIONS
Accommodation & Food Services
North Dakota
Compare Cities
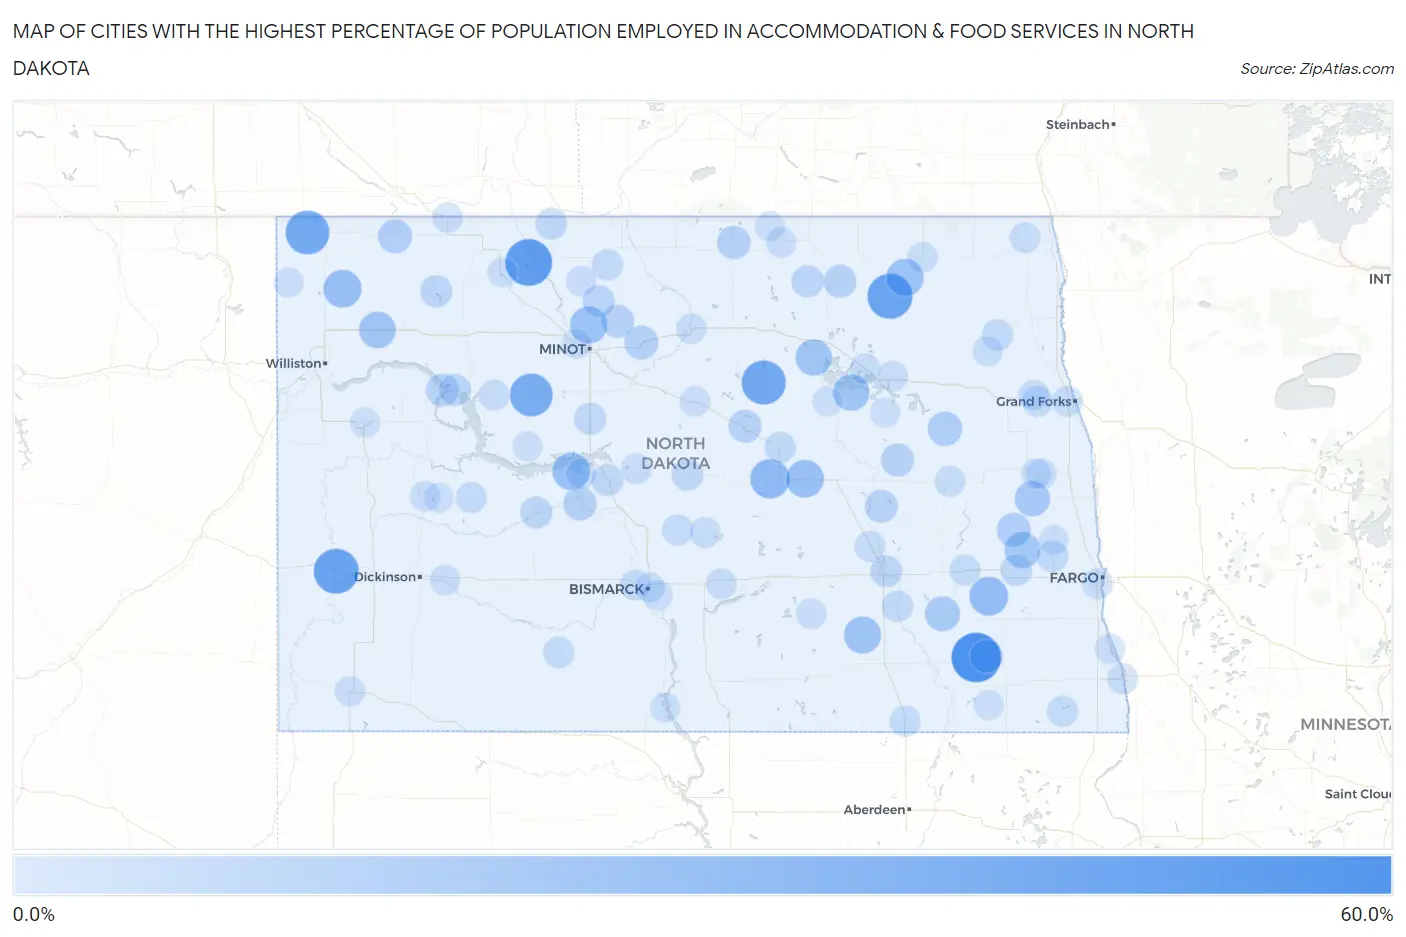
Map of Cities with the Highest Percentage of Population Employed in Accommodation & Food Services in North Dakota
0.0%
60.0%
Cities with the Highest Percentage of Population Employed in Accommodation & Food Services in North Dakota
| City | % Employed | vs State | vs National | |
| 1. | Englevale | 57.5% | 6.0%(+51.5)#1 | 6.9%(+50.6)#104 |
| 2. | Tolley | 50.0% | 6.0%(+44.0)#2 | 6.9%(+43.1)#168 |
| 3. | Hampden | 45.5% | 6.0%(+39.4)#3 | 6.9%(+38.6)#208 |
| 4. | Medora | 45.3% | 6.0%(+39.3)#4 | 6.9%(+38.5)#210 |
| 5. | Esmond | 42.9% | 6.0%(+36.8)#5 | 6.9%(+36.0)#237 |
| 6. | Fortuna | 41.7% | 6.0%(+35.6)#6 | 6.9%(+34.8)#246 |
| 7. | Makoti | 39.4% | 6.0%(+33.4)#7 | 6.9%(+32.5)#280 |
| 8. | Bowdon | 30.2% | 6.0%(+24.2)#8 | 6.9%(+23.4)#477 |
| 9. | Fingal | 28.2% | 6.0%(+22.1)#9 | 6.9%(+21.3)#555 |
| 10. | Alamo | 26.5% | 6.0%(+20.4)#10 | 6.9%(+19.6)#643 |
| 11. | Sykeston | 26.0% | 6.0%(+20.0)#11 | 6.9%(+19.1)#671 |
| 12. | Pick City | 25.6% | 6.0%(+19.6)#12 | 6.9%(+18.7)#696 |
| 13. | Loma | 25.0% | 6.0%(+19.0)#13 | 6.9%(+18.1)#744 |
| 14. | Ruthville | 24.6% | 6.0%(+18.6)#14 | 6.9%(+17.8)#766 |
| 15. | Jud | 23.8% | 6.0%(+17.8)#15 | 6.9%(+16.9)#835 |
| 16. | Ray | 23.2% | 6.0%(+17.2)#16 | 6.9%(+16.4)#885 |
| 17. | Fort Totten | 22.4% | 6.0%(+16.3)#17 | 6.9%(+15.5)#960 |
| 18. | Brinsmade | 22.2% | 6.0%(+16.2)#18 | 6.9%(+15.3)#990 |
| 19. | Ayr | 21.4% | 6.0%(+15.4)#19 | 6.9%(+14.5)#1,070 |
| 20. | Clifford | 20.0% | 6.0%(+14.0)#20 | 6.9%(+13.1)#1,253 |
| 21. | Litchville | 18.9% | 6.0%(+12.8)#21 | 6.9%(+12.0)#1,444 |
| 22. | Mcville | 17.3% | 6.0%(+11.3)#22 | 6.9%(+10.5)#1,751 |
| 23. | Page | 16.2% | 6.0%(+10.2)#23 | 6.9%(+9.31)#2,032 |
| 24. | Noonan | 16.1% | 6.0%(+10.1)#24 | 6.9%(+9.25)#2,062 |
| 25. | Granville | 16.0% | 6.0%(+9.95)#25 | 6.9%(+9.09)#2,108 |
| 26. | Stanton | 14.5% | 6.0%(+8.52)#26 | 6.9%(+7.66)#2,622 |
| 27. | East Dunseith | 14.5% | 6.0%(+8.44)#27 | 6.9%(+7.58)#2,651 |
| 28. | Deering | 14.3% | 6.0%(+8.26)#28 | 6.9%(+7.40)#2,735 |
| 29. | Mchenry | 14.3% | 6.0%(+8.26)#29 | 6.9%(+7.40)#2,739 |
| 30. | Kensal | 13.7% | 6.0%(+7.64)#30 | 6.9%(+6.79)#3,013 |
| 31. | Harvey | 13.7% | 6.0%(+7.63)#31 | 6.9%(+6.78)#3,016 |
| 32. | Elliott | 13.6% | 6.0%(+7.61)#32 | 6.9%(+6.76)#3,042 |
| 33. | Egeland | 13.5% | 6.0%(+7.49)#33 | 6.9%(+6.63)#3,112 |
| 34. | Four Bears Village | 13.3% | 6.0%(+7.31)#34 | 6.9%(+6.45)#3,194 |
| 35. | Glenburn | 11.7% | 6.0%(+5.63)#35 | 6.9%(+4.77)#4,261 |
| 36. | Bisbee | 11.5% | 6.0%(+5.51)#36 | 6.9%(+4.66)#4,340 |
| 37. | Beulah | 11.3% | 6.0%(+5.32)#37 | 6.9%(+4.46)#4,477 |
| 38. | Powers Lake | 11.3% | 6.0%(+5.28)#38 | 6.9%(+4.42)#4,519 |
| 39. | Jamestown | 11.3% | 6.0%(+5.25)#39 | 6.9%(+4.39)#4,547 |
| 40. | New Town | 11.1% | 6.0%(+5.08)#40 | 6.9%(+4.22)#4,703 |
| 41. | Max | 10.8% | 6.0%(+4.82)#41 | 6.9%(+3.96)#4,916 |
| 42. | Underwood | 10.8% | 6.0%(+4.80)#42 | 6.9%(+3.95)#4,929 |
| 43. | Buffalo | 10.8% | 6.0%(+4.75)#43 | 6.9%(+3.89)#4,978 |
| 44. | Sherwood | 10.4% | 6.0%(+4.39)#44 | 6.9%(+3.54)#5,303 |
| 45. | Mcclusky | 10.2% | 6.0%(+4.22)#45 | 6.9%(+3.36)#5,519 |
| 46. | Amenia | 10.0% | 6.0%(+3.98)#46 | 6.9%(+3.12)#5,782 |
| 47. | Carson | 9.8% | 6.0%(+3.77)#47 | 6.9%(+2.91)#6,022 |
| 48. | Maxbass | 9.4% | 6.0%(+3.41)#48 | 6.9%(+2.55)#6,478 |
| 49. | Fessenden | 9.4% | 6.0%(+3.37)#49 | 6.9%(+2.51)#6,520 |
| 50. | Pisek | 9.3% | 6.0%(+3.28)#50 | 6.9%(+2.42)#6,649 |
| 51. | Montpelier | 9.3% | 6.0%(+3.24)#51 | 6.9%(+2.38)#6,713 |
| 52. | Ellendale | 9.1% | 6.0%(+3.12)#52 | 6.9%(+2.27)#6,862 |
| 53. | Valley City | 9.1% | 6.0%(+3.06)#53 | 6.9%(+2.20)#6,988 |
| 54. | Halliday | 9.0% | 6.0%(+2.96)#54 | 6.9%(+2.11)#7,113 |
| 55. | Regan | 8.9% | 6.0%(+2.86)#55 | 6.9%(+2.01)#7,285 |
| 56. | Lidgerwood | 8.8% | 6.0%(+2.83)#56 | 6.9%(+1.97)#7,339 |
| 57. | Emerado | 8.7% | 6.0%(+2.63)#57 | 6.9%(+1.77)#7,620 |
| 58. | Buchanan | 8.3% | 6.0%(+2.31)#58 | 6.9%(+1.45)#8,185 |
| 59. | Grand Forks | 8.3% | 6.0%(+2.26)#59 | 6.9%(+1.40)#8,264 |
| 60. | Cooperstown | 8.3% | 6.0%(+2.24)#60 | 6.9%(+1.38)#8,295 |
| 61. | Wahpeton | 8.2% | 6.0%(+2.17)#61 | 6.9%(+1.32)#8,413 |
| 62. | Parshall | 8.1% | 6.0%(+2.04)#62 | 6.9%(+1.19)#8,623 |
| 63. | Driscoll | 8.0% | 6.0%(+1.98)#63 | 6.9%(+1.12)#8,760 |
| 64. | Bathgate | 8.0% | 6.0%(+1.98)#64 | 6.9%(+1.12)#8,761 |
| 65. | Fargo | 7.8% | 6.0%(+1.76)#65 | 6.9%(+0.902)#9,147 |
| 66. | Wing | 7.8% | 6.0%(+1.73)#66 | 6.9%(+0.878)#9,205 |
| 67. | Mandan | 7.7% | 6.0%(+1.69)#67 | 6.9%(+0.838)#9,274 |
| 68. | Devils Lake | 7.7% | 6.0%(+1.65)#68 | 6.9%(+0.791)#9,386 |
| 69. | Portal | 7.6% | 6.0%(+1.55)#69 | 6.9%(+0.695)#9,599 |
| 70. | Towner | 7.5% | 6.0%(+1.48)#70 | 6.9%(+0.619)#9,758 |
| 71. | Turtle Lake | 7.5% | 6.0%(+1.43)#71 | 6.9%(+0.575)#9,854 |
| 72. | Killdeer | 7.4% | 6.0%(+1.39)#72 | 6.9%(+0.537)#9,940 |
| 73. | Drake | 7.4% | 6.0%(+1.38)#73 | 6.9%(+0.526)#9,973 |
| 74. | Langdon | 7.3% | 6.0%(+1.32)#74 | 6.9%(+0.461)#10,106 |
| 75. | Streeter | 7.3% | 6.0%(+1.29)#75 | 6.9%(+0.436)#10,163 |
| 76. | Riverdale | 7.3% | 6.0%(+1.27)#76 | 6.9%(+0.411)#10,201 |
| 77. | Crary | 7.3% | 6.0%(+1.25)#77 | 6.9%(+0.392)#10,233 |
| 78. | Rolla | 7.2% | 6.0%(+1.13)#78 | 6.9%(+0.278)#10,453 |
| 79. | Mayville | 7.1% | 6.0%(+1.05)#79 | 6.9%(+0.197)#10,627 |
| 80. | Grand Forks Afb | 7.0% | 6.0%(+0.985)#80 | 6.9%(+0.128)#10,783 |
| 81. | Lansford | 7.0% | 6.0%(+0.976)#81 | 6.9%(+0.119)#10,804 |
| 82. | Fordville | 6.9% | 6.0%(+0.899)#82 | 6.9%(+0.042)#10,979 |
| 83. | Portland | 6.9% | 6.0%(+0.885)#83 | 6.9%(+0.028)#11,012 |
| 84. | Bowman | 6.9% | 6.0%(+0.860)#84 | 6.9%(+0.003)#11,065 |
| 85. | Gladstone | 6.8% | 6.0%(+0.825)#85 | 6.9%(-0.032)#11,150 |
| 86. | Abercrombie | 6.8% | 6.0%(+0.813)#86 | 6.9%(-0.043)#11,189 |
| 87. | Kenmare | 6.8% | 6.0%(+0.781)#87 | 6.9%(-0.076)#11,269 |
| 88. | Lincoln | 6.8% | 6.0%(+0.775)#88 | 6.9%(-0.082)#11,285 |
| 89. | Dunn Center | 6.7% | 6.0%(+0.643)#89 | 6.9%(-0.214)#11,589 |
| 90. | St John | 6.7% | 6.0%(+0.643)#90 | 6.9%(-0.214)#11,598 |
| 91. | Fort Yates | 6.7% | 6.0%(+0.643)#91 | 6.9%(-0.214)#11,607 |
| 92. | Oberon | 6.7% | 6.0%(+0.643)#92 | 6.9%(-0.214)#11,616 |
| 93. | Burlington | 6.5% | 6.0%(+0.481)#93 | 6.9%(-0.376)#11,985 |
| 94. | Arthur | 6.5% | 6.0%(+0.427)#94 | 6.9%(-0.429)#12,114 |
| 95. | Grenora | 6.5% | 6.0%(+0.427)#95 | 6.9%(-0.429)#12,115 |
| 96. | Cogswell | 6.5% | 6.0%(+0.427)#96 | 6.9%(-0.429)#12,124 |
| 97. | Bismarck | 6.4% | 6.0%(+0.364)#97 | 6.9%(-0.493)#12,261 |
| 98. | White Shield | 6.4% | 6.0%(+0.359)#98 | 6.9%(-0.498)#12,284 |
| 99. | Watford City | 6.4% | 6.0%(+0.356)#99 | 6.9%(-0.501)#12,294 |
| 100. | Warwick | 6.2% | 6.0%(+0.226)#100 | 6.9%(-0.631)#12,611 |
Common Questions
What are the Top 10 Cities with the Highest Percentage of Population Employed in Accommodation & Food Services in North Dakota?
Top 10 Cities with the Highest Percentage of Population Employed in Accommodation & Food Services in North Dakota are:
What city has the Highest Percentage of Population Employed in Accommodation & Food Services in North Dakota?
Englevale has the Highest Percentage of Population Employed in Accommodation & Food Services in North Dakota with 57.5%.
What is the Percentage of Population Employed in Accommodation & Food Services in the State of North Dakota?
Percentage of Population Employed in Accommodation & Food Services in North Dakota is 6.0%.
What is the Percentage of Population Employed in Accommodation & Food Services in the United States?
Percentage of Population Employed in Accommodation & Food Services in the United States is 6.9%.