Zip Codes with the Highest Percentage of Population Employed in Accommodation & Food Services in Malibu, CA
RELATED REPORTS & OPTIONS
Accommodation & Food Services
Malibu
Compare Zip Codes
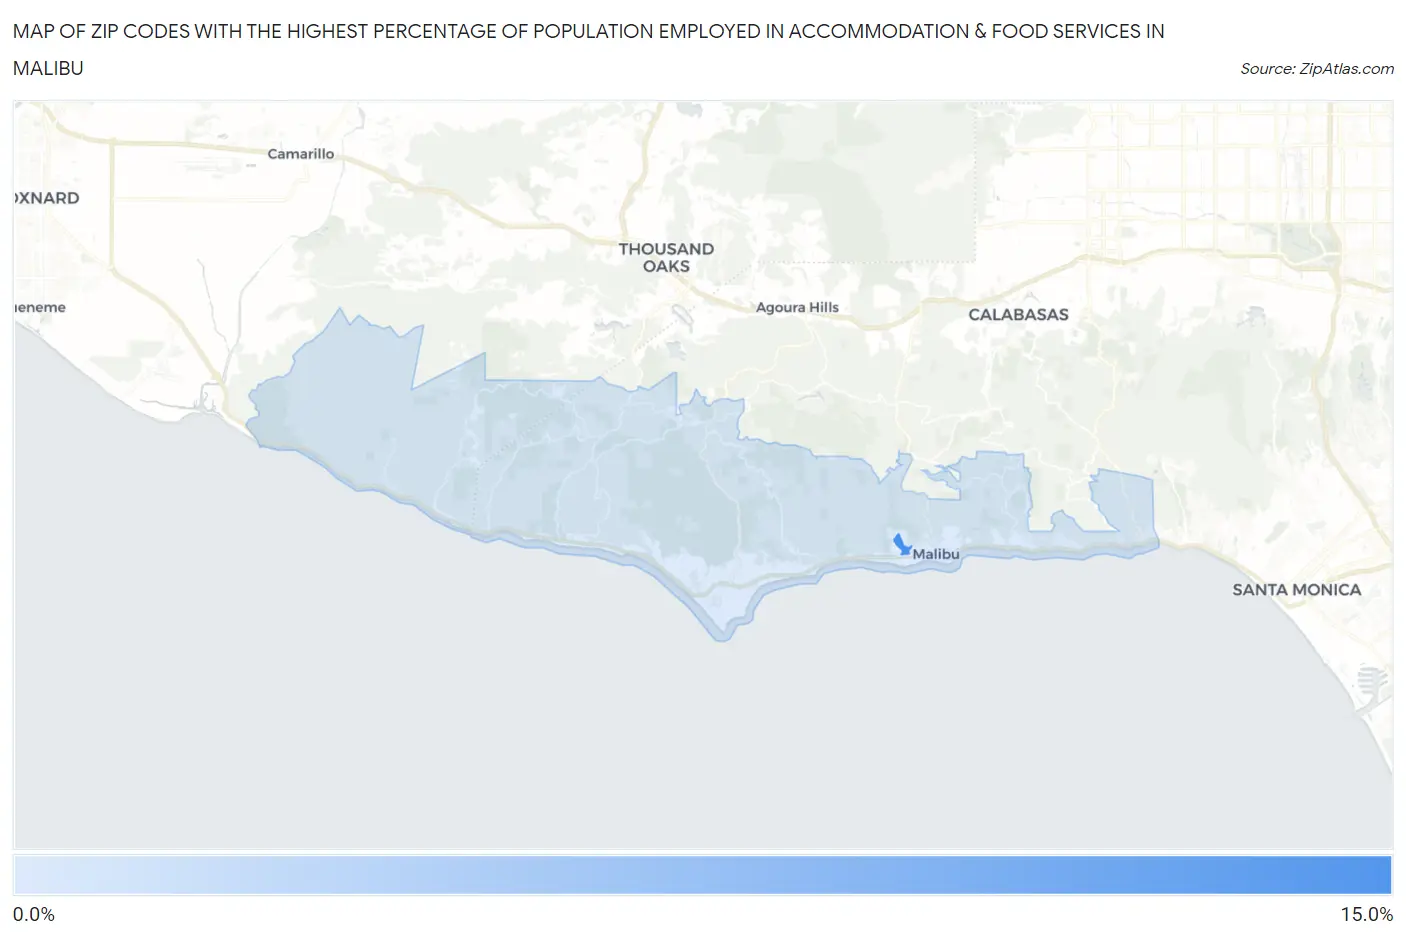
Map of Zip Codes with the Highest Percentage of Population Employed in Accommodation & Food Services in Malibu
1.8%
14.7%
Zip Codes with the Highest Percentage of Population Employed in Accommodation & Food Services in Malibu, CA
| Zip Code | % Employed | vs State | vs National | |
| 1. | 90263 | 14.7% | 7.2%(+7.56)#118 | 6.9%(+7.85)#1,751 |
| 2. | 90265 | 1.8% | 7.2%(-5.38)#1,495 | 6.9%(-5.09)#25,972 |
1
Common Questions
What are the Top Zip Codes with the Highest Percentage of Population Employed in Accommodation & Food Services in Malibu, CA?
Top Zip Codes with the Highest Percentage of Population Employed in Accommodation & Food Services in Malibu, CA are:
What zip code has the Highest Percentage of Population Employed in Accommodation & Food Services in Malibu, CA?
90263 has the Highest Percentage of Population Employed in Accommodation & Food Services in Malibu, CA with 14.7%.
What is the Percentage of Population Employed in Accommodation & Food Services in Malibu, CA?
Percentage of Population Employed in Accommodation & Food Services in Malibu is 1.5%.
What is the Percentage of Population Employed in Accommodation & Food Services in California?
Percentage of Population Employed in Accommodation & Food Services in California is 7.2%.
What is the Percentage of Population Employed in Accommodation & Food Services in the United States?
Percentage of Population Employed in Accommodation & Food Services in the United States is 6.9%.