Cities with the Highest Percentage of Population Employed in Accommodation & Food Services in Tennessee
RELATED REPORTS & OPTIONS
Accommodation & Food Services
Tennessee
Compare Cities
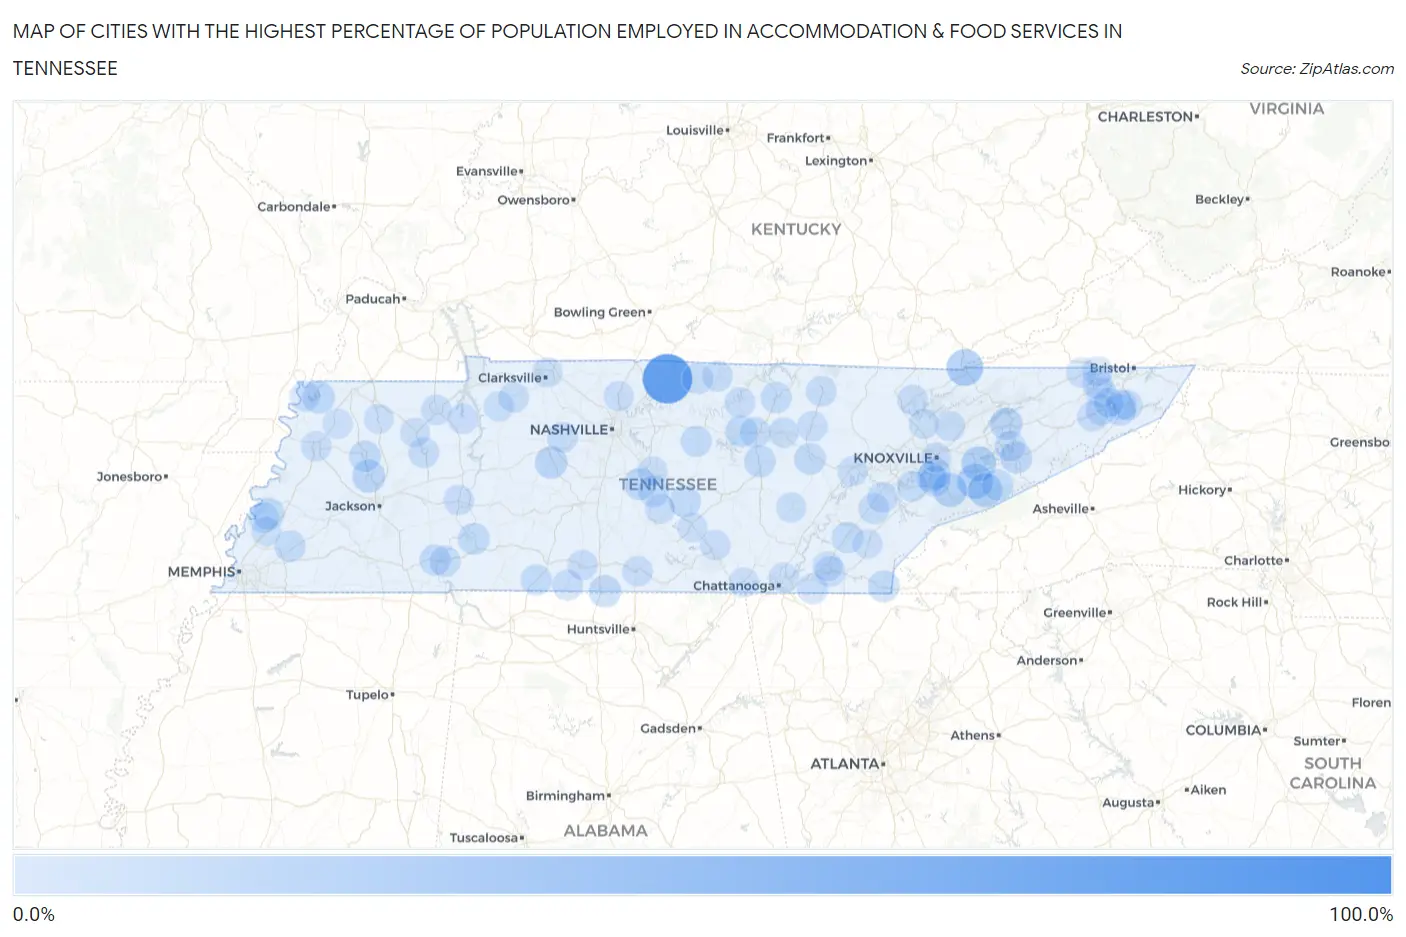
Map of Cities with the Highest Percentage of Population Employed in Accommodation & Food Services in Tennessee
0.0%
100.0%
Cities with the Highest Percentage of Population Employed in Accommodation & Food Services in Tennessee
| City | % Employed | vs State | vs National | |
| 1. | Frankewing | 100.0% | 7.4%(+92.6)#1 | 6.9%(+93.1)#17 |
| 2. | Bransford | 81.4% | 7.4%(+74.0)#2 | 6.9%(+74.5)#43 |
| 3. | Cumberland Gap | 32.9% | 7.4%(+25.5)#3 | 6.9%(+26.0)#403 |
| 4. | Shiloh | 32.1% | 7.4%(+24.7)#4 | 6.9%(+25.2)#419 |
| 5. | Pigeon Forge | 27.4% | 7.4%(+20.0)#5 | 6.9%(+20.6)#590 |
| 6. | Sevierville | 26.5% | 7.4%(+19.1)#6 | 6.9%(+19.6)#642 |
| 7. | Greenvale | 25.7% | 7.4%(+18.3)#7 | 6.9%(+18.8)#691 |
| 8. | Prospect | 25.0% | 7.4%(+17.6)#8 | 6.9%(+18.1)#738 |
| 9. | Gatlinburg | 24.4% | 7.4%(+17.0)#9 | 6.9%(+17.5)#783 |
| 10. | Walland | 24.0% | 7.4%(+16.6)#10 | 6.9%(+17.1)#814 |
| 11. | Hickman | 22.3% | 7.4%(+14.9)#11 | 6.9%(+15.4)#966 |
| 12. | Finley | 20.6% | 7.4%(+13.2)#12 | 6.9%(+13.7)#1,170 |
| 13. | Humboldt | 20.5% | 7.4%(+13.1)#13 | 6.9%(+13.6)#1,186 |
| 14. | Butler | 18.8% | 7.4%(+11.4)#14 | 6.9%(+11.9)#1,452 |
| 15. | Morristown | 18.4% | 7.4%(+11.0)#15 | 6.9%(+11.5)#1,525 |
| 16. | Bon Aqua Junction | 18.0% | 7.4%(+10.6)#16 | 6.9%(+11.1)#1,629 |
| 17. | Samburg | 17.9% | 7.4%(+10.5)#17 | 6.9%(+11.0)#1,646 |
| 18. | Rockvale | 17.5% | 7.4%(+10.1)#18 | 6.9%(+10.6)#1,718 |
| 19. | Ardmore | 17.0% | 7.4%(+9.62)#19 | 6.9%(+10.1)#1,831 |
| 20. | Rockford | 16.8% | 7.4%(+9.44)#20 | 6.9%(+9.95)#1,871 |
| 21. | Newport | 16.8% | 7.4%(+9.40)#21 | 6.9%(+9.91)#1,878 |
| 22. | Lakewood Park | 16.2% | 7.4%(+8.85)#22 | 6.9%(+9.36)#2,020 |
| 23. | Sparta | 16.1% | 7.4%(+8.72)#23 | 6.9%(+9.23)#2,068 |
| 24. | Ducktown | 15.4% | 7.4%(+7.99)#24 | 6.9%(+8.50)#2,300 |
| 25. | Clifton | 15.3% | 7.4%(+7.95)#25 | 6.9%(+8.46)#2,319 |
| 26. | Baxter | 15.3% | 7.4%(+7.92)#26 | 6.9%(+8.43)#2,329 |
| 27. | Pine Crest | 15.2% | 7.4%(+7.83)#27 | 6.9%(+8.34)#2,348 |
| 28. | Crossville | 15.2% | 7.4%(+7.80)#28 | 6.9%(+8.31)#2,360 |
| 29. | Trenton | 15.0% | 7.4%(+7.61)#29 | 6.9%(+8.12)#2,439 |
| 30. | Burlison | 15.0% | 7.4%(+7.61)#30 | 6.9%(+8.12)#2,445 |
| 31. | Riceville | 14.8% | 7.4%(+7.45)#31 | 6.9%(+7.96)#2,507 |
| 32. | Christiana | 14.5% | 7.4%(+7.10)#32 | 6.9%(+7.61)#2,642 |
| 33. | Gallaway | 14.0% | 7.4%(+6.63)#33 | 6.9%(+7.14)#2,843 |
| 34. | Crump | 13.9% | 7.4%(+6.50)#34 | 6.9%(+7.01)#2,893 |
| 35. | Pittman Center | 13.8% | 7.4%(+6.36)#35 | 6.9%(+6.87)#2,965 |
| 36. | Livingston | 13.8% | 7.4%(+6.36)#36 | 6.9%(+6.87)#2,969 |
| 37. | Alexandria | 13.7% | 7.4%(+6.28)#37 | 6.9%(+6.79)#3,012 |
| 38. | Eagleton Village | 13.6% | 7.4%(+6.24)#38 | 6.9%(+6.75)#3,043 |
| 39. | Loretto | 13.6% | 7.4%(+6.19)#39 | 6.9%(+6.70)#3,073 |
| 40. | Kahite | 13.5% | 7.4%(+6.12)#40 | 6.9%(+6.63)#3,106 |
| 41. | Lafayette | 13.3% | 7.4%(+5.93)#41 | 6.9%(+6.44)#3,205 |
| 42. | Cookeville | 13.2% | 7.4%(+5.77)#42 | 6.9%(+6.28)#3,271 |
| 43. | Savannah | 13.2% | 7.4%(+5.76)#43 | 6.9%(+6.27)#3,281 |
| 44. | Friendsville | 12.7% | 7.4%(+5.27)#44 | 6.9%(+5.78)#3,574 |
| 45. | Sweetwater | 12.6% | 7.4%(+5.25)#45 | 6.9%(+5.76)#3,583 |
| 46. | Gilt Edge | 12.5% | 7.4%(+5.11)#46 | 6.9%(+5.62)#3,669 |
| 47. | La Follette | 12.5% | 7.4%(+5.06)#47 | 6.9%(+5.57)#3,714 |
| 48. | Minor Hill | 12.4% | 7.4%(+5.02)#48 | 6.9%(+5.54)#3,735 |
| 49. | Huntingdon | 12.4% | 7.4%(+4.98)#49 | 6.9%(+5.49)#3,763 |
| 50. | Baneberry | 12.3% | 7.4%(+4.93)#50 | 6.9%(+5.44)#3,796 |
| 51. | Jonesborough | 12.3% | 7.4%(+4.90)#51 | 6.9%(+5.41)#3,821 |
| 52. | East Cleveland | 12.2% | 7.4%(+4.77)#52 | 6.9%(+5.29)#3,896 |
| 53. | Jamestown | 12.2% | 7.4%(+4.76)#53 | 6.9%(+5.27)#3,906 |
| 54. | Central | 12.1% | 7.4%(+4.75)#54 | 6.9%(+5.26)#3,915 |
| 55. | Red Boiling Springs | 12.0% | 7.4%(+4.66)#55 | 6.9%(+5.17)#3,968 |
| 56. | Philadelphia | 12.0% | 7.4%(+4.63)#56 | 6.9%(+5.14)#3,988 |
| 57. | White Bluff | 12.0% | 7.4%(+4.62)#57 | 6.9%(+5.13)#3,996 |
| 58. | Russellville | 12.0% | 7.4%(+4.56)#58 | 6.9%(+5.07)#4,039 |
| 59. | Telford | 11.9% | 7.4%(+4.50)#59 | 6.9%(+5.01)#4,086 |
| 60. | Paris | 11.9% | 7.4%(+4.48)#60 | 6.9%(+4.99)#4,102 |
| 61. | Apison | 11.8% | 7.4%(+4.44)#61 | 6.9%(+4.95)#4,131 |
| 62. | Gainesboro | 11.8% | 7.4%(+4.41)#62 | 6.9%(+4.92)#4,150 |
| 63. | Fayetteville | 11.7% | 7.4%(+4.26)#63 | 6.9%(+4.77)#4,263 |
| 64. | Tiptonville | 11.5% | 7.4%(+4.07)#64 | 6.9%(+4.58)#4,398 |
| 65. | Parsons | 11.4% | 7.4%(+4.05)#65 | 6.9%(+4.56)#4,413 |
| 66. | Clarkrange | 11.4% | 7.4%(+4.05)#66 | 6.9%(+4.56)#4,420 |
| 67. | John Sevier | 11.3% | 7.4%(+3.93)#67 | 6.9%(+4.44)#4,508 |
| 68. | Gray | 11.3% | 7.4%(+3.91)#68 | 6.9%(+4.42)#4,517 |
| 69. | Dyersburg | 11.2% | 7.4%(+3.86)#69 | 6.9%(+4.37)#4,572 |
| 70. | Alcoa | 11.2% | 7.4%(+3.84)#70 | 6.9%(+4.35)#4,591 |
| 71. | Pelham | 11.2% | 7.4%(+3.77)#71 | 6.9%(+4.28)#4,645 |
| 72. | Colonial Heights | 11.0% | 7.4%(+3.59)#72 | 6.9%(+4.10)#4,796 |
| 73. | Big Sandy | 10.9% | 7.4%(+3.54)#73 | 6.9%(+4.05)#4,843 |
| 74. | Millersville | 10.7% | 7.4%(+3.35)#74 | 6.9%(+3.86)#5,003 |
| 75. | Knoxville | 10.7% | 7.4%(+3.32)#75 | 6.9%(+3.83)#5,025 |
| 76. | Elizabethton | 10.7% | 7.4%(+3.32)#76 | 6.9%(+3.83)#5,035 |
| 77. | Bell Buckle | 10.7% | 7.4%(+3.31)#77 | 6.9%(+3.82)#5,040 |
| 78. | Pulaski | 10.6% | 7.4%(+3.24)#78 | 6.9%(+3.75)#5,097 |
| 79. | Tennessee Ridge | 10.6% | 7.4%(+3.21)#79 | 6.9%(+3.72)#5,127 |
| 80. | Cumberland City | 10.6% | 7.4%(+3.19)#80 | 6.9%(+3.70)#5,146 |
| 81. | Monterey | 10.5% | 7.4%(+3.15)#81 | 6.9%(+3.66)#5,173 |
| 82. | Pikeville | 10.5% | 7.4%(+3.12)#82 | 6.9%(+3.63)#5,212 |
| 83. | Plainview | 10.5% | 7.4%(+3.09)#83 | 6.9%(+3.60)#5,241 |
| 84. | Bloomingdale | 10.4% | 7.4%(+3.04)#84 | 6.9%(+3.55)#5,292 |
| 85. | Trimble | 10.4% | 7.4%(+3.03)#85 | 6.9%(+3.54)#5,300 |
| 86. | Rockwood | 10.4% | 7.4%(+2.98)#86 | 6.9%(+3.49)#5,356 |
| 87. | Sharon | 10.3% | 7.4%(+2.88)#87 | 6.9%(+3.39)#5,489 |
| 88. | Andersonville | 10.2% | 7.4%(+2.77)#88 | 6.9%(+3.28)#5,613 |
| 89. | Johnson City | 10.1% | 7.4%(+2.68)#89 | 6.9%(+3.19)#5,703 |
| 90. | Farner | 10.0% | 7.4%(+2.61)#90 | 6.9%(+3.12)#5,787 |
| 91. | Etowah | 10.0% | 7.4%(+2.57)#91 | 6.9%(+3.08)#5,828 |
| 92. | Murfreesboro | 9.9% | 7.4%(+2.56)#92 | 6.9%(+3.07)#5,838 |
| 93. | Jasper | 9.9% | 7.4%(+2.51)#93 | 6.9%(+3.02)#5,888 |
| 94. | Clarksville | 9.8% | 7.4%(+2.44)#94 | 6.9%(+2.95)#5,964 |
| 95. | Mckenzie | 9.8% | 7.4%(+2.44)#95 | 6.9%(+2.95)#5,965 |
| 96. | Munford | 9.8% | 7.4%(+2.40)#96 | 6.9%(+2.91)#6,015 |
| 97. | Mount Carmel | 9.8% | 7.4%(+2.39)#97 | 6.9%(+2.90)#6,030 |
| 98. | Chattanooga | 9.8% | 7.4%(+2.38)#98 | 6.9%(+2.89)#6,046 |
| 99. | Manchester | 9.8% | 7.4%(+2.36)#99 | 6.9%(+2.87)#6,079 |
| 100. | Cleveland | 9.7% | 7.4%(+2.30)#100 | 6.9%(+2.81)#6,151 |
Common Questions
What are the Top 10 Cities with the Highest Percentage of Population Employed in Accommodation & Food Services in Tennessee?
Top 10 Cities with the Highest Percentage of Population Employed in Accommodation & Food Services in Tennessee are:
#1
81.4%
#2
32.9%
#3
27.4%
#4
26.5%
#5
24.4%
#6
24.0%
#7
20.5%
#8
18.4%
#9
18.0%
#10
17.9%
What city has the Highest Percentage of Population Employed in Accommodation & Food Services in Tennessee?
Bransford has the Highest Percentage of Population Employed in Accommodation & Food Services in Tennessee with 81.4%.
What is the Percentage of Population Employed in Accommodation & Food Services in the State of Tennessee?
Percentage of Population Employed in Accommodation & Food Services in Tennessee is 7.4%.
What is the Percentage of Population Employed in Accommodation & Food Services in the United States?
Percentage of Population Employed in Accommodation & Food Services in the United States is 6.9%.