Cities with the Highest Percentage of Population Employed in Accommodation & Food Services in Oregon
RELATED REPORTS & OPTIONS
Accommodation & Food Services
Oregon
Compare Cities
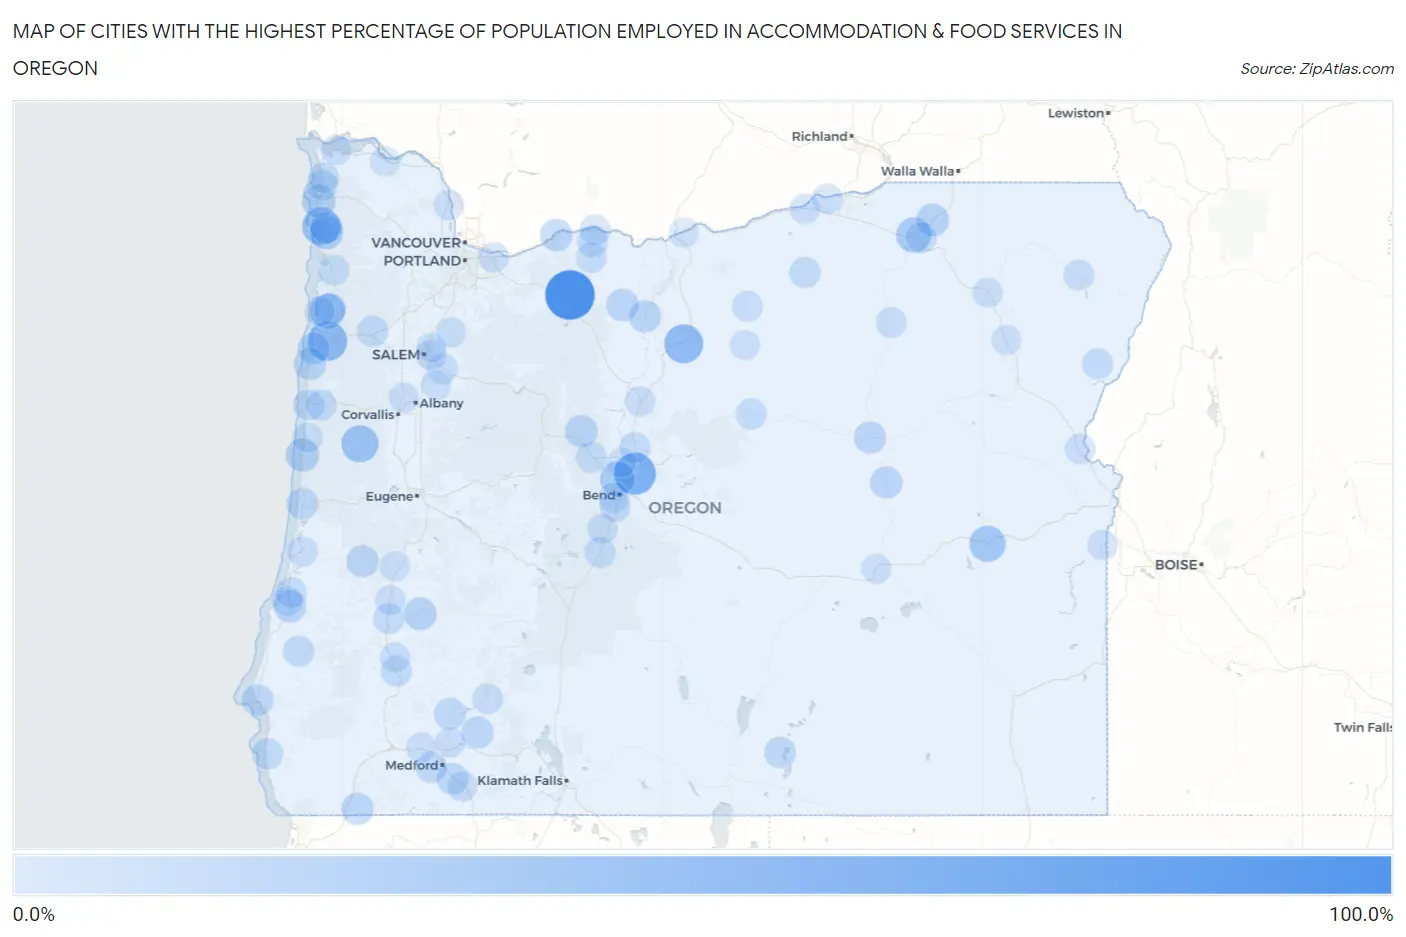
Map of Cities with the Highest Percentage of Population Employed in Accommodation & Food Services in Oregon
0.0%
100.0%
Cities with the Highest Percentage of Population Employed in Accommodation & Food Services in Oregon
| City | % Employed | vs State | vs National | |
| 1. | Government Camp | 100.0% | 7.2%(+92.8)#1 | 6.9%(+93.1)#11 |
| 2. | Pronghorn | 63.3% | 7.2%(+56.1)#2 | 6.9%(+56.4)#73 |
| 3. | Rose Lodge | 52.8% | 7.2%(+45.6)#3 | 6.9%(+45.9)#132 |
| 4. | Shaniko | 50.0% | 7.2%(+42.8)#4 | 6.9%(+43.1)#167 |
| 5. | Neahkahnie | 45.8% | 7.2%(+38.6)#5 | 6.9%(+38.9)#204 |
| 6. | Alsea | 40.9% | 7.2%(+33.7)#6 | 6.9%(+34.0)#257 |
| 7. | Juntura | 37.5% | 7.2%(+30.3)#7 | 6.9%(+30.6)#303 |
| 8. | Barnesdale | 33.9% | 7.2%(+26.6)#8 | 6.9%(+27.0)#372 |
| 9. | Cloverdale | 33.3% | 7.2%(+26.1)#9 | 6.9%(+26.5)#383 |
| 10. | Riverside | 33.2% | 7.2%(+25.9)#10 | 6.9%(+26.3)#396 |
| 11. | Tumalo | 31.0% | 7.2%(+23.8)#11 | 6.9%(+24.1)#451 |
| 12. | Wheeler | 27.4% | 7.2%(+20.2)#12 | 6.9%(+20.5)#591 |
| 13. | Yachats | 25.5% | 7.2%(+18.3)#13 | 6.9%(+18.7)#701 |
| 14. | Cannon Beach | 25.5% | 7.2%(+18.3)#14 | 6.9%(+18.7)#702 |
| 15. | Glide | 23.1% | 7.2%(+15.9)#15 | 6.9%(+16.3)#889 |
| 16. | Adams | 23.1% | 7.2%(+15.9)#16 | 6.9%(+16.2)#893 |
| 17. | Bunker Hill | 21.3% | 7.2%(+14.0)#17 | 6.9%(+14.4)#1,084 |
| 18. | Lincoln Beach | 21.2% | 7.2%(+14.0)#18 | 6.9%(+14.4)#1,088 |
| 19. | Pine Hollow | 20.9% | 7.2%(+13.7)#19 | 6.9%(+14.0)#1,134 |
| 20. | Camp Sherman | 20.8% | 7.2%(+13.6)#20 | 6.9%(+13.9)#1,148 |
| 21. | Cascade Locks | 20.3% | 7.2%(+13.1)#21 | 6.9%(+13.5)#1,200 |
| 22. | Maupin | 20.3% | 7.2%(+13.1)#22 | 6.9%(+13.4)#1,203 |
| 23. | Butte Falls | 20.1% | 7.2%(+12.9)#23 | 6.9%(+13.2)#1,227 |
| 24. | Takilma | 20.1% | 7.2%(+12.9)#24 | 6.9%(+13.2)#1,230 |
| 25. | Lincoln City | 19.9% | 7.2%(+12.6)#25 | 6.9%(+13.0)#1,271 |
| 26. | Seneca | 19.5% | 7.2%(+12.3)#26 | 6.9%(+12.7)#1,322 |
| 27. | Nehalem | 19.5% | 7.2%(+12.3)#27 | 6.9%(+12.7)#1,323 |
| 28. | Elkton | 19.2% | 7.2%(+12.0)#28 | 6.9%(+12.3)#1,382 |
| 29. | Mount Vernon | 19.0% | 7.2%(+11.8)#29 | 6.9%(+12.1)#1,418 |
| 30. | Trail | 18.3% | 7.2%(+11.1)#30 | 6.9%(+11.4)#1,563 |
| 31. | Florence | 18.2% | 7.2%(+10.9)#31 | 6.9%(+11.3)#1,596 |
| 32. | Port Orford | 17.8% | 7.2%(+10.6)#32 | 6.9%(+10.9)#1,654 |
| 33. | Hebo | 17.2% | 7.2%(+9.96)#33 | 6.9%(+10.3)#1,791 |
| 34. | Plush | 17.1% | 7.2%(+9.85)#34 | 6.9%(+10.2)#1,820 |
| 35. | Talent | 16.9% | 7.2%(+9.72)#35 | 6.9%(+10.1)#1,849 |
| 36. | Myrtle Point | 16.0% | 7.2%(+8.75)#36 | 6.9%(+9.09)#2,107 |
| 37. | Lexington | 15.7% | 7.2%(+8.46)#37 | 6.9%(+8.81)#2,206 |
| 38. | Gold Beach | 15.7% | 7.2%(+8.45)#38 | 6.9%(+8.79)#2,208 |
| 39. | Willamina | 15.6% | 7.2%(+8.38)#39 | 6.9%(+8.72)#2,234 |
| 40. | Jacksonville | 15.4% | 7.2%(+8.21)#40 | 6.9%(+8.55)#2,288 |
| 41. | Newport | 15.2% | 7.2%(+7.94)#41 | 6.9%(+8.28)#2,372 |
| 42. | Pleasant Valley | 15.2% | 7.2%(+7.93)#42 | 6.9%(+8.27)#2,376 |
| 43. | San Marine | 15.1% | 7.2%(+7.85)#43 | 6.9%(+8.19)#2,414 |
| 44. | Odell | 15.1% | 7.2%(+7.83)#44 | 6.9%(+8.17)#2,425 |
| 45. | Elmira | 15.0% | 7.2%(+7.77)#45 | 6.9%(+8.12)#2,444 |
| 46. | Glasgow | 14.9% | 7.2%(+7.71)#46 | 6.9%(+8.05)#2,471 |
| 47. | Seaside | 14.9% | 7.2%(+7.70)#47 | 6.9%(+8.05)#2,474 |
| 48. | Mission | 14.9% | 7.2%(+7.64)#48 | 6.9%(+7.98)#2,496 |
| 49. | Terrebonne | 14.8% | 7.2%(+7.60)#49 | 6.9%(+7.95)#2,509 |
| 50. | Canyonville | 14.6% | 7.2%(+7.39)#50 | 6.9%(+7.74)#2,584 |
| 51. | Tillamook | 14.5% | 7.2%(+7.24)#51 | 6.9%(+7.59)#2,650 |
| 52. | Toledo | 14.5% | 7.2%(+7.22)#52 | 6.9%(+7.57)#2,656 |
| 53. | Sisters | 14.3% | 7.2%(+7.12)#53 | 6.9%(+7.46)#2,699 |
| 54. | Roseburg North | 14.3% | 7.2%(+7.11)#54 | 6.9%(+7.46)#2,701 |
| 55. | Halfway | 14.3% | 7.2%(+7.06)#55 | 6.9%(+7.40)#2,720 |
| 56. | La Pine | 14.1% | 7.2%(+6.83)#56 | 6.9%(+7.17)#2,835 |
| 57. | Mitchell | 13.9% | 7.2%(+6.66)#57 | 6.9%(+7.01)#2,900 |
| 58. | Tetherow | 13.8% | 7.2%(+6.59)#58 | 6.9%(+6.94)#2,930 |
| 59. | Hood River | 13.7% | 7.2%(+6.52)#59 | 6.9%(+6.86)#2,975 |
| 60. | Mount Hood | 13.7% | 7.2%(+6.45)#60 | 6.9%(+6.80)#3,005 |
| 61. | Aumsville | 13.6% | 7.2%(+6.41)#61 | 6.9%(+6.76)#3,027 |
| 62. | Deschutes River Woods | 13.5% | 7.2%(+6.24)#62 | 6.9%(+6.59)#3,133 |
| 63. | Gearhart | 13.2% | 7.2%(+6.01)#63 | 6.9%(+6.36)#3,239 |
| 64. | Enterprise | 13.2% | 7.2%(+5.99)#64 | 6.9%(+6.33)#3,249 |
| 65. | Ukiah | 13.0% | 7.2%(+5.82)#65 | 6.9%(+6.16)#3,345 |
| 66. | Bayshore | 12.9% | 7.2%(+5.65)#66 | 6.9%(+5.99)#3,446 |
| 67. | Condon | 12.8% | 7.2%(+5.59)#67 | 6.9%(+5.94)#3,471 |
| 68. | Prospect | 12.8% | 7.2%(+5.55)#68 | 6.9%(+5.90)#3,495 |
| 69. | Four Corners | 12.8% | 7.2%(+5.53)#69 | 6.9%(+5.88)#3,512 |
| 70. | Reedsport | 12.3% | 7.2%(+5.05)#70 | 6.9%(+5.40)#3,829 |
| 71. | Madras | 12.2% | 7.2%(+5.00)#71 | 6.9%(+5.35)#3,859 |
| 72. | Wood Village | 12.2% | 7.2%(+4.94)#72 | 6.9%(+5.29)#3,895 |
| 73. | Huntington | 12.1% | 7.2%(+4.92)#73 | 6.9%(+5.27)#3,909 |
| 74. | Ashland | 12.1% | 7.2%(+4.88)#74 | 6.9%(+5.22)#3,935 |
| 75. | Irrigon | 12.0% | 7.2%(+4.78)#75 | 6.9%(+5.12)#4,001 |
| 76. | St Helens | 11.9% | 7.2%(+4.69)#76 | 6.9%(+5.04)#4,064 |
| 77. | Adrian | 11.8% | 7.2%(+4.60)#77 | 6.9%(+4.95)#4,135 |
| 78. | Coos Bay | 11.7% | 7.2%(+4.51)#78 | 6.9%(+4.85)#4,203 |
| 79. | Sutherlin | 11.7% | 7.2%(+4.49)#79 | 6.9%(+4.83)#4,220 |
| 80. | Astoria | 11.6% | 7.2%(+4.34)#80 | 6.9%(+4.69)#4,316 |
| 81. | Gold Hill | 11.5% | 7.2%(+4.26)#81 | 6.9%(+4.60)#4,376 |
| 82. | Adair Village | 11.4% | 7.2%(+4.16)#82 | 6.9%(+4.51)#4,450 |
| 83. | Three Rivers | 11.4% | 7.2%(+4.15)#83 | 6.9%(+4.49)#4,457 |
| 84. | Waldport | 11.3% | 7.2%(+4.09)#84 | 6.9%(+4.43)#4,512 |
| 85. | La Grande | 11.3% | 7.2%(+4.07)#85 | 6.9%(+4.41)#4,527 |
| 86. | Eagle Point | 11.2% | 7.2%(+3.99)#86 | 6.9%(+4.34)#4,600 |
| 87. | Boardman | 11.2% | 7.2%(+3.96)#87 | 6.9%(+4.31)#4,629 |
| 88. | Pacific City | 11.1% | 7.2%(+3.87)#88 | 6.9%(+4.21)#4,707 |
| 89. | Myrtle Creek | 11.0% | 7.2%(+3.74)#89 | 6.9%(+4.09)#4,805 |
| 90. | Mount Angel | 10.9% | 7.2%(+3.66)#90 | 6.9%(+4.01)#4,874 |
| 91. | Burns | 10.7% | 7.2%(+3.51)#91 | 6.9%(+3.86)#5,008 |
| 92. | Svensen | 10.7% | 7.2%(+3.46)#92 | 6.9%(+3.81)#5,050 |
| 93. | Hayesville | 10.7% | 7.2%(+3.45)#93 | 6.9%(+3.80)#5,055 |
| 94. | North Powder | 10.7% | 7.2%(+3.43)#94 | 6.9%(+3.77)#5,073 |
| 95. | Yoncalla | 10.6% | 7.2%(+3.41)#95 | 6.9%(+3.76)#5,085 |
| 96. | Fossil | 10.5% | 7.2%(+3.24)#96 | 6.9%(+3.58)#5,253 |
| 97. | Rufus | 10.4% | 7.2%(+3.16)#97 | 6.9%(+3.51)#5,332 |
| 98. | Marion | 10.3% | 7.2%(+3.04)#98 | 6.9%(+3.39)#5,484 |
| 99. | Westport | 10.2% | 7.2%(+2.93)#99 | 6.9%(+3.28)#5,612 |
| 100. | Eagle Crest | 10.1% | 7.2%(+2.88)#100 | 6.9%(+3.22)#5,675 |
Common Questions
What are the Top 10 Cities with the Highest Percentage of Population Employed in Accommodation & Food Services in Oregon?
Top 10 Cities with the Highest Percentage of Population Employed in Accommodation & Food Services in Oregon are:
#1
100.0%
#2
63.3%
#3
52.8%
#4
50.0%
#5
45.8%
#6
40.9%
#7
37.5%
#8
33.3%
#9
33.2%
#10
31.0%
What city has the Highest Percentage of Population Employed in Accommodation & Food Services in Oregon?
Government Camp has the Highest Percentage of Population Employed in Accommodation & Food Services in Oregon with 100.0%.
What is the Percentage of Population Employed in Accommodation & Food Services in the State of Oregon?
Percentage of Population Employed in Accommodation & Food Services in Oregon is 7.2%.
What is the Percentage of Population Employed in Accommodation & Food Services in the United States?
Percentage of Population Employed in Accommodation & Food Services in the United States is 6.9%.