Cities with the Highest Percentage of Population Employed in Accommodation & Food Services in Vermont
RELATED REPORTS & OPTIONS
Accommodation & Food Services
Vermont
Compare Cities
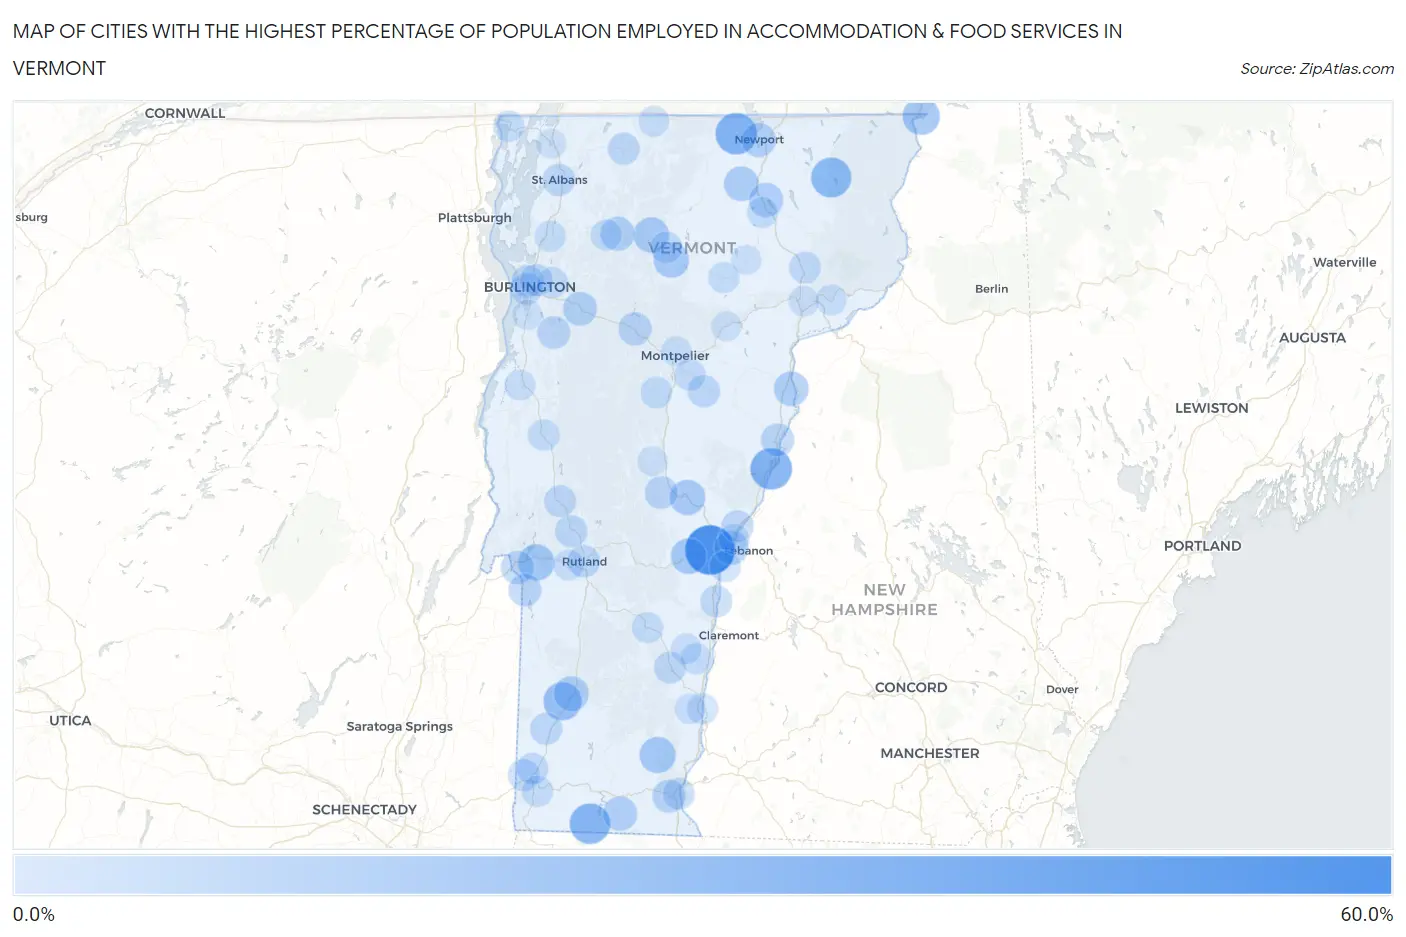
Map of Cities with the Highest Percentage of Population Employed in Accommodation & Food Services in Vermont
0.0%
60.0%
Cities with the Highest Percentage of Population Employed in Accommodation & Food Services in Vermont
| City | % Employed | vs State | vs National | |
| 1. | Quechee | 60.0% | 6.7%(+53.3)#1 | 6.9%(+53.1)#90 |
| 2. | South Woodstock | 41.7% | 6.7%(+35.0)#2 | 6.9%(+34.8)#247 |
| 3. | South Londonderry | 38.7% | 6.7%(+32.0)#3 | 6.9%(+31.8)#289 |
| 4. | Fairlee | 36.2% | 6.7%(+29.5)#4 | 6.9%(+29.3)#328 |
| 5. | Newport Center | 35.9% | 6.7%(+29.2)#5 | 6.9%(+29.0)#335 |
| 6. | Castleton Four Corners | 34.9% | 6.7%(+28.2)#6 | 6.9%(+28.0)#355 |
| 7. | Readsboro | 33.3% | 6.7%(+26.6)#7 | 6.9%(+26.5)#382 |
| 8. | Island Pond | 31.6% | 6.7%(+25.0)#8 | 6.9%(+24.8)#427 |
| 9. | North Clarendon | 28.4% | 6.7%(+21.7)#9 | 6.9%(+21.5)#545 |
| 10. | Westford | 26.9% | 6.7%(+20.2)#10 | 6.9%(+20.0)#621 |
| 11. | Manchester | 25.9% | 6.7%(+19.2)#11 | 6.9%(+19.0)#682 |
| 12. | Beecher Falls | 23.1% | 6.7%(+16.4)#12 | 6.9%(+16.2)#896 |
| 13. | West Dummerston | 22.2% | 6.7%(+15.5)#13 | 6.9%(+15.3)#986 |
| 14. | Lincoln | 21.1% | 6.7%(+14.5)#14 | 6.9%(+14.3)#1,106 |
| 15. | Castleton | 21.0% | 6.7%(+14.3)#15 | 6.9%(+14.1)#1,121 |
| 16. | Newfane | 20.2% | 6.7%(+13.5)#16 | 6.9%(+13.3)#1,223 |
| 17. | Woodstock | 19.0% | 6.7%(+12.4)#17 | 6.9%(+12.2)#1,409 |
| 18. | South Royalton | 18.4% | 6.7%(+11.8)#18 | 6.9%(+11.6)#1,524 |
| 19. | Morrisville | 18.4% | 6.7%(+11.7)#19 | 6.9%(+11.5)#1,541 |
| 20. | Johnson | 18.2% | 6.7%(+11.5)#20 | 6.9%(+11.3)#1,581 |
| 21. | West Woodstock | 17.5% | 6.7%(+10.8)#21 | 6.9%(+10.6)#1,713 |
| 22. | Lunenburg | 17.3% | 6.7%(+10.6)#22 | 6.9%(+10.4)#1,753 |
| 23. | Manchester Center | 16.9% | 6.7%(+10.2)#23 | 6.9%(+10.00)#1,858 |
| 24. | Irasburg | 16.3% | 6.7%(+9.57)#24 | 6.9%(+9.37)#2,017 |
| 25. | Wells River | 16.1% | 6.7%(+9.42)#25 | 6.9%(+9.22)#2,070 |
| 26. | Barton | 15.1% | 6.7%(+8.38)#26 | 6.9%(+8.18)#2,420 |
| 27. | Jacksonville | 15.1% | 6.7%(+8.37)#27 | 6.9%(+8.17)#2,423 |
| 28. | Jeffersonville | 14.7% | 6.7%(+7.97)#28 | 6.9%(+7.77)#2,570 |
| 29. | White River Junction | 14.6% | 6.7%(+7.90)#29 | 6.9%(+7.71)#2,598 |
| 30. | Newport | 14.5% | 6.7%(+7.82)#30 | 6.9%(+7.62)#2,638 |
| 31. | Richmond | 14.1% | 6.7%(+7.39)#31 | 6.9%(+7.19)#2,827 |
| 32. | Bradford | 11.9% | 6.7%(+5.20)#32 | 6.9%(+5.01)#4,091 |
| 33. | Waterbury | 11.7% | 6.7%(+5.05)#33 | 6.9%(+4.85)#4,205 |
| 34. | West Brattleboro | 11.7% | 6.7%(+5.00)#34 | 6.9%(+4.81)#4,242 |
| 35. | Fair Haven | 11.7% | 6.7%(+4.99)#35 | 6.9%(+4.80)#4,247 |
| 36. | Waterbury Center | 11.5% | 6.7%(+4.78)#36 | 6.9%(+4.58)#4,393 |
| 37. | Bolton Valley | 11.3% | 6.7%(+4.59)#37 | 6.9%(+4.40)#4,544 |
| 38. | Hinesburg | 11.1% | 6.7%(+4.43)#38 | 6.9%(+4.23)#4,681 |
| 39. | Bethel | 11.0% | 6.7%(+4.34)#39 | 6.9%(+4.14)#4,761 |
| 40. | Poultney | 10.5% | 6.7%(+3.83)#40 | 6.9%(+3.63)#5,208 |
| 41. | St Albans | 9.8% | 6.7%(+3.15)#41 | 6.9%(+2.95)#5,967 |
| 42. | Huntington | 9.8% | 6.7%(+3.07)#42 | 6.9%(+2.88)#6,067 |
| 43. | Burlington | 9.6% | 6.7%(+2.92)#43 | 6.9%(+2.72)#6,257 |
| 44. | Pittsford | 9.5% | 6.7%(+2.82)#44 | 6.9%(+2.62)#6,374 |
| 45. | Rutland | 9.4% | 6.7%(+2.76)#45 | 6.9%(+2.56)#6,460 |
| 46. | East Barre | 9.4% | 6.7%(+2.74)#46 | 6.9%(+2.54)#6,490 |
| 47. | Arlington | 9.4% | 6.7%(+2.71)#47 | 6.9%(+2.52)#6,518 |
| 48. | New Haven | 9.2% | 6.7%(+2.48)#48 | 6.9%(+2.28)#6,846 |
| 49. | Killington | 9.0% | 6.7%(+2.33)#49 | 6.9%(+2.14)#7,069 |
| 50. | Enosburg Falls | 9.0% | 6.7%(+2.30)#50 | 6.9%(+2.10)#7,125 |
| 51. | South Burlington | 8.7% | 6.7%(+1.98)#51 | 6.9%(+1.79)#7,590 |
| 52. | Norwich | 8.7% | 6.7%(+1.98)#52 | 6.9%(+1.78)#7,600 |
| 53. | Winooski | 8.7% | 6.7%(+1.98)#53 | 6.9%(+1.78)#7,604 |
| 54. | Brandon | 8.6% | 6.7%(+1.93)#54 | 6.9%(+1.73)#7,681 |
| 55. | Chester | 8.6% | 6.7%(+1.87)#55 | 6.9%(+1.67)#7,783 |
| 56. | Lyndonville | 8.4% | 6.7%(+1.71)#56 | 6.9%(+1.52)#8,047 |
| 57. | Wolcott | 8.3% | 6.7%(+1.65)#57 | 6.9%(+1.45)#8,179 |
| 58. | North Bennington | 8.2% | 6.7%(+1.55)#58 | 6.9%(+1.35)#8,344 |
| 59. | Windsor | 8.2% | 6.7%(+1.48)#59 | 6.9%(+1.28)#8,462 |
| 60. | Brattleboro | 8.0% | 6.7%(+1.33)#60 | 6.9%(+1.13)#8,733 |
| 61. | South Shaftsbury | 7.6% | 6.7%(+0.921)#61 | 6.9%(+0.724)#9,524 |
| 62. | Huntington Center | 7.5% | 6.7%(+0.844)#62 | 6.9%(+0.646)#9,700 |
| 63. | Hyde Park | 7.5% | 6.7%(+0.828)#63 | 6.9%(+0.631)#9,734 |
| 64. | Northfield | 7.4% | 6.7%(+0.719)#64 | 6.9%(+0.521)#9,996 |
| 65. | Middlebury | 7.4% | 6.7%(+0.695)#65 | 6.9%(+0.497)#10,032 |
| 66. | North Hartland | 7.3% | 6.7%(+0.646)#66 | 6.9%(+0.449)#10,126 |
| 67. | Pownal Center | 7.1% | 6.7%(+0.460)#67 | 6.9%(+0.262)#10,491 |
| 68. | Ludlow | 6.8% | 6.7%(+0.105)#68 | 6.9%(-0.092)#11,308 |
| 69. | Barre | 6.8% | 6.7%(+0.072)#69 | 6.9%(-0.125)#11,399 |
| 70. | Underhill Flats | 6.7% | 6.7%(+0.016)#70 | 6.9%(-0.181)#11,513 |
| 71. | Cambridge | 6.7% | 6.7%(-0.017)#71 | 6.9%(-0.214)#11,602 |
| 72. | Hardwick | 6.5% | 6.7%(-0.155)#72 | 6.9%(-0.352)#11,922 |
| 73. | Bennington | 6.5% | 6.7%(-0.159)#73 | 6.9%(-0.356)#11,933 |
| 74. | Proctor | 6.5% | 6.7%(-0.210)#74 | 6.9%(-0.407)#12,063 |
| 75. | Alburgh | 6.4% | 6.7%(-0.261)#75 | 6.9%(-0.459)#12,187 |
| 76. | Springfield | 6.2% | 6.7%(-0.457)#76 | 6.9%(-0.655)#12,658 |
| 77. | Essex Junction | 6.2% | 6.7%(-0.507)#77 | 6.9%(-0.704)#12,805 |
| 78. | Glover | 6.2% | 6.7%(-0.530)#78 | 6.9%(-0.727)#12,859 |
| 79. | Danby | 6.1% | 6.7%(-0.623)#79 | 6.9%(-0.820)#13,092 |
| 80. | Bellows Falls | 6.0% | 6.7%(-0.655)#80 | 6.9%(-0.853)#13,173 |
| 81. | Milton | 6.0% | 6.7%(-0.663)#81 | 6.9%(-0.860)#13,198 |
| 82. | West Rutland | 5.5% | 6.7%(-1.17)#82 | 6.9%(-1.37)#14,437 |
| 83. | West Pawlet | 5.4% | 6.7%(-1.26)#83 | 6.9%(-1.46)#14,671 |
| 84. | Concord | 5.4% | 6.7%(-1.28)#84 | 6.9%(-1.48)#14,714 |
| 85. | Richford | 5.3% | 6.7%(-1.36)#85 | 6.9%(-1.56)#14,918 |
| 86. | Harmonyville | 5.1% | 6.7%(-1.59)#86 | 6.9%(-1.79)#15,473 |
| 87. | Vergennes | 5.0% | 6.7%(-1.72)#87 | 6.9%(-1.92)#15,826 |
| 88. | North Springfield | 4.9% | 6.7%(-1.78)#88 | 6.9%(-1.97)#15,970 |
| 89. | Wilder | 4.6% | 6.7%(-2.05)#89 | 6.9%(-2.25)#16,657 |
| 90. | Saxtons River | 4.5% | 6.7%(-2.17)#90 | 6.9%(-2.36)#16,981 |
| 91. | St Johnsbury | 4.1% | 6.7%(-2.55)#91 | 6.9%(-2.74)#17,885 |
| 92. | Chittenden | 4.1% | 6.7%(-2.56)#92 | 6.9%(-2.76)#17,916 |
| 93. | St. George | 3.8% | 6.7%(-2.86)#93 | 6.9%(-3.05)#18,616 |
| 94. | Montpelier | 3.8% | 6.7%(-2.90)#94 | 6.9%(-3.10)#18,733 |
| 95. | South Lincoln | 3.7% | 6.7%(-2.95)#95 | 6.9%(-3.14)#18,848 |
| 96. | Shelburne | 3.7% | 6.7%(-2.99)#96 | 6.9%(-3.19)#18,958 |
| 97. | Greensboro Bend | 3.6% | 6.7%(-3.09)#97 | 6.9%(-3.28)#19,196 |
| 98. | Swanton | 3.4% | 6.7%(-3.25)#98 | 6.9%(-3.45)#19,569 |
| 99. | Randolph | 3.3% | 6.7%(-3.34)#99 | 6.9%(-3.54)#19,797 |
| 100. | Marshfield | 3.2% | 6.7%(-3.44)#100 | 6.9%(-3.64)#20,038 |
1
2Common Questions
What are the Top 10 Cities with the Highest Percentage of Population Employed in Accommodation & Food Services in Vermont?
Top 10 Cities with the Highest Percentage of Population Employed in Accommodation & Food Services in Vermont are:
#1
60.0%
#2
36.2%
#3
35.9%
#4
33.3%
#5
31.6%
#6
25.9%
#7
23.1%
#8
21.0%
#9
20.2%
#10
19.0%
What city has the Highest Percentage of Population Employed in Accommodation & Food Services in Vermont?
Quechee has the Highest Percentage of Population Employed in Accommodation & Food Services in Vermont with 60.0%.
What is the Percentage of Population Employed in Accommodation & Food Services in the State of Vermont?
Percentage of Population Employed in Accommodation & Food Services in Vermont is 6.7%.
What is the Percentage of Population Employed in Accommodation & Food Services in the United States?
Percentage of Population Employed in Accommodation & Food Services in the United States is 6.9%.