Cities with the Highest Percentage of Population Employed in Accommodation & Food Services in Kentucky
RELATED REPORTS & OPTIONS
Accommodation & Food Services
Kentucky
Compare Cities
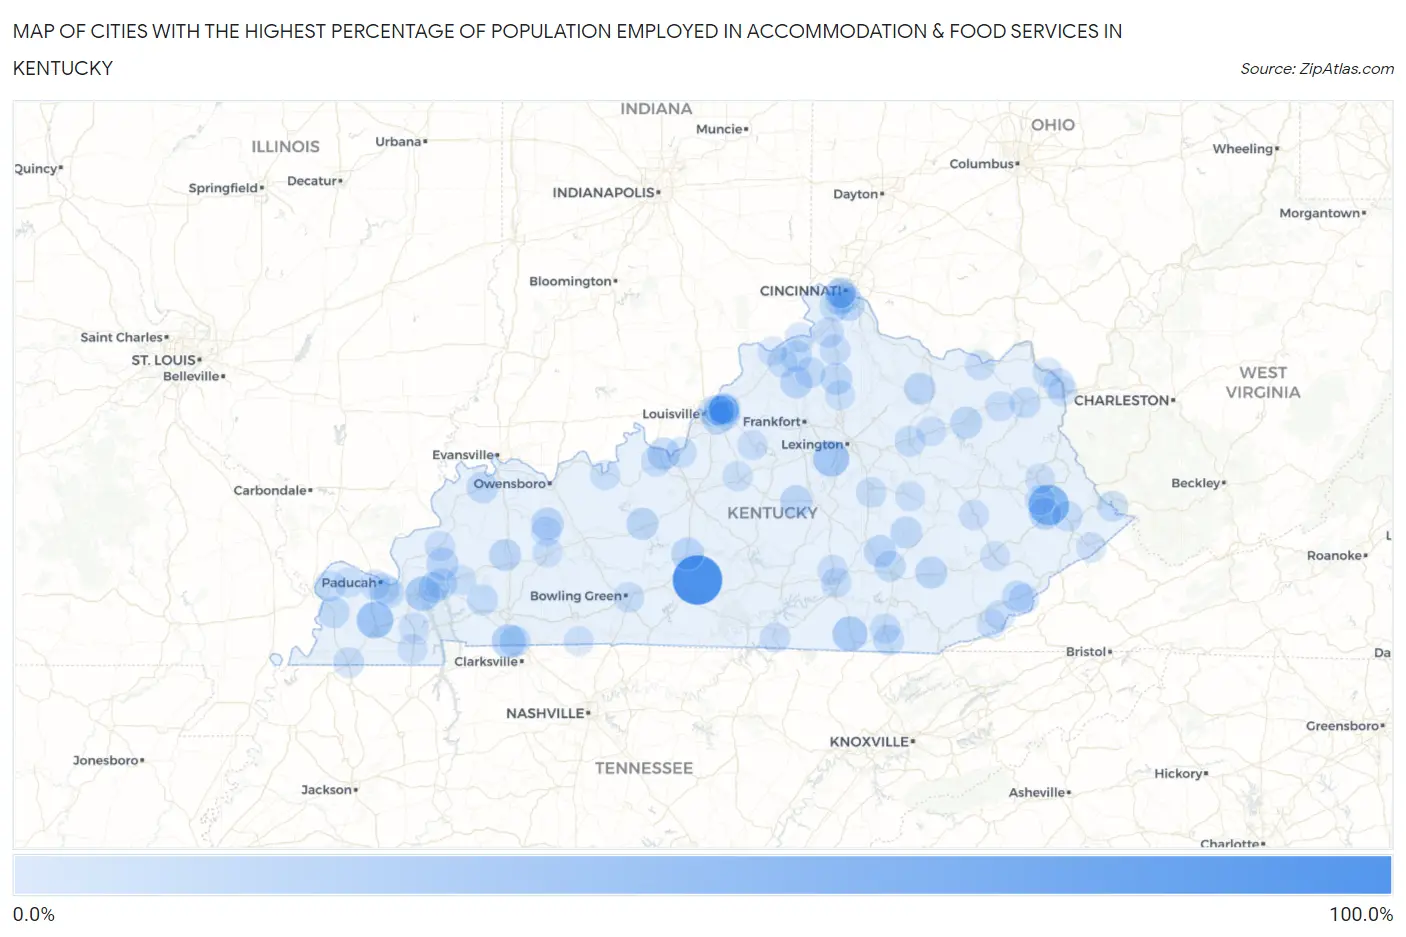
Map of Cities with the Highest Percentage of Population Employed in Accommodation & Food Services in Kentucky
0.0%
100.0%
Cities with the Highest Percentage of Population Employed in Accommodation & Food Services in Kentucky
| City | % Employed | vs State | vs National | |
| 1. | Hiseville | 100.0% | 6.7%(+93.3)#1 | 6.9%(+93.1)#10 |
| 2. | Dwale | 57.1% | 6.7%(+50.5)#2 | 6.9%(+50.3)#108 |
| 3. | Moseleyville | 51.2% | 6.7%(+44.5)#3 | 6.9%(+44.3)#143 |
| 4. | Hickory | 39.5% | 6.7%(+32.8)#4 | 6.9%(+32.6)#275 |
| 5. | Keene | 35.9% | 6.7%(+29.2)#5 | 6.9%(+29.0)#334 |
| 6. | Whitley City | 31.7% | 6.7%(+25.0)#6 | 6.9%(+24.8)#424 |
| 7. | Grand Rivers | 29.9% | 6.7%(+23.2)#7 | 6.9%(+23.0)#487 |
| 8. | Fort Campbell North | 27.0% | 6.7%(+20.3)#8 | 6.9%(+20.1)#613 |
| 9. | Munfordville | 21.2% | 6.7%(+14.5)#9 | 6.9%(+14.3)#1,097 |
| 10. | Livermore | 20.6% | 6.7%(+13.9)#10 | 6.9%(+13.7)#1,172 |
| 11. | Livingston | 20.0% | 6.7%(+13.3)#11 | 6.9%(+13.1)#1,247 |
| 12. | Doe Valley | 19.8% | 6.7%(+13.2)#12 | 6.9%(+13.0)#1,274 |
| 13. | Manchester | 19.6% | 6.7%(+12.9)#13 | 6.9%(+12.7)#1,319 |
| 14. | Fredonia | 19.4% | 6.7%(+12.7)#14 | 6.9%(+12.5)#1,348 |
| 15. | Martin | 19.4% | 6.7%(+12.7)#15 | 6.9%(+12.5)#1,353 |
| 16. | Perryville | 19.2% | 6.7%(+12.5)#16 | 6.9%(+12.3)#1,389 |
| 17. | Earlington | 19.0% | 6.7%(+12.3)#17 | 6.9%(+12.1)#1,421 |
| 18. | Ewing | 18.8% | 6.7%(+12.1)#18 | 6.9%(+11.9)#1,451 |
| 19. | Gratz | 18.8% | 6.7%(+12.1)#19 | 6.9%(+11.9)#1,464 |
| 20. | Leitchfield | 18.4% | 6.7%(+11.7)#20 | 6.9%(+11.5)#1,539 |
| 21. | Mckee | 18.3% | 6.7%(+11.6)#21 | 6.9%(+11.4)#1,553 |
| 22. | Corinth | 18.3% | 6.7%(+11.6)#22 | 6.9%(+11.4)#1,568 |
| 23. | Morehead | 18.0% | 6.7%(+11.3)#23 | 6.9%(+11.1)#1,621 |
| 24. | Hickory Hill | 17.6% | 6.7%(+11.0)#24 | 6.9%(+10.8)#1,693 |
| 25. | Meadowview Estates | 17.5% | 6.7%(+10.9)#25 | 6.9%(+10.7)#1,705 |
| 26. | Corydon | 17.4% | 6.7%(+10.7)#26 | 6.9%(+10.5)#1,745 |
| 27. | Fairview | 17.3% | 6.7%(+10.6)#27 | 6.9%(+10.4)#1,766 |
| 28. | Eddyville | 16.6% | 6.7%(+9.94)#28 | 6.9%(+9.73)#1,928 |
| 29. | Sanders | 16.2% | 6.7%(+9.50)#29 | 6.9%(+9.29)#2,041 |
| 30. | Bardwell | 16.1% | 6.7%(+9.42)#30 | 6.9%(+9.21)#2,075 |
| 31. | Oak Grove | 15.7% | 6.7%(+9.07)#31 | 6.9%(+8.86)#2,192 |
| 32. | Moorland | 15.6% | 6.7%(+8.98)#32 | 6.9%(+8.77)#2,216 |
| 33. | East Bernstadt | 15.6% | 6.7%(+8.97)#33 | 6.9%(+8.76)#2,217 |
| 34. | Cumberland | 15.6% | 6.7%(+8.92)#34 | 6.9%(+8.71)#2,241 |
| 35. | Kuttawa | 15.6% | 6.7%(+8.89)#35 | 6.9%(+8.67)#2,257 |
| 36. | Rolling Fields | 15.4% | 6.7%(+8.72)#36 | 6.9%(+8.50)#2,299 |
| 37. | Barlow | 15.0% | 6.7%(+8.33)#37 | 6.9%(+8.12)#2,443 |
| 38. | Mount Sterling | 15.0% | 6.7%(+8.29)#38 | 6.9%(+8.08)#2,462 |
| 39. | Farley | 14.6% | 6.7%(+7.94)#39 | 6.9%(+7.73)#2,588 |
| 40. | Cerulean | 14.6% | 6.7%(+7.90)#40 | 6.9%(+7.69)#2,611 |
| 41. | Kenton Vale | 14.5% | 6.7%(+7.80)#41 | 6.9%(+7.59)#2,649 |
| 42. | Pleasant View | 14.1% | 6.7%(+7.45)#42 | 6.9%(+7.24)#2,810 |
| 43. | Grayson | 14.1% | 6.7%(+7.39)#43 | 6.9%(+7.18)#2,829 |
| 44. | Reidland | 14.0% | 6.7%(+7.31)#44 | 6.9%(+7.10)#2,859 |
| 45. | Owenton | 13.9% | 6.7%(+7.25)#45 | 6.9%(+7.04)#2,878 |
| 46. | Mccarr | 13.9% | 6.7%(+7.25)#46 | 6.9%(+7.04)#2,880 |
| 47. | Elsmere | 13.8% | 6.7%(+7.16)#47 | 6.9%(+6.95)#2,928 |
| 48. | Fulton | 13.7% | 6.7%(+6.99)#48 | 6.9%(+6.77)#3,017 |
| 49. | Pleasant Ridge | 13.2% | 6.7%(+6.51)#49 | 6.9%(+6.30)#3,264 |
| 50. | Ekron | 13.1% | 6.7%(+6.43)#50 | 6.9%(+6.21)#3,321 |
| 51. | Lakeside Park | 12.9% | 6.7%(+6.25)#51 | 6.9%(+6.03)#3,413 |
| 52. | Ashland | 12.9% | 6.7%(+6.22)#52 | 6.9%(+6.01)#3,435 |
| 53. | Coal Run Village | 12.8% | 6.7%(+6.18)#53 | 6.9%(+5.97)#3,454 |
| 54. | Dry Ridge | 12.8% | 6.7%(+6.09)#54 | 6.9%(+5.88)#3,510 |
| 55. | Ludlow | 12.7% | 6.7%(+6.02)#55 | 6.9%(+5.80)#3,554 |
| 56. | West Point | 12.7% | 6.7%(+6.01)#56 | 6.9%(+5.80)#3,559 |
| 57. | Rolling Hills | 12.7% | 6.7%(+6.00)#57 | 6.9%(+5.79)#3,572 |
| 58. | Richmond | 12.6% | 6.7%(+5.94)#58 | 6.9%(+5.73)#3,604 |
| 59. | Bowling Green | 12.6% | 6.7%(+5.94)#59 | 6.9%(+5.73)#3,605 |
| 60. | Worthville | 12.3% | 6.7%(+5.66)#60 | 6.9%(+5.45)#3,792 |
| 61. | Science Hill | 12.3% | 6.7%(+5.60)#61 | 6.9%(+5.39)#3,835 |
| 62. | Prestonsburg | 12.3% | 6.7%(+5.58)#62 | 6.9%(+5.37)#3,846 |
| 63. | Albany | 12.2% | 6.7%(+5.54)#63 | 6.9%(+5.33)#3,871 |
| 64. | Williamsburg | 12.1% | 6.7%(+5.45)#64 | 6.9%(+5.24)#3,919 |
| 65. | Graymoor Devondale | 11.9% | 6.7%(+5.19)#65 | 6.9%(+4.98)#4,113 |
| 66. | Marion | 11.7% | 6.7%(+5.04)#66 | 6.9%(+4.83)#4,225 |
| 67. | Verona | 11.7% | 6.7%(+5.03)#67 | 6.9%(+4.82)#4,227 |
| 68. | Van Lear | 11.5% | 6.7%(+4.85)#68 | 6.9%(+4.63)#4,356 |
| 69. | Wildwood | 11.4% | 6.7%(+4.73)#69 | 6.9%(+4.52)#4,441 |
| 70. | Taylorsville | 11.4% | 6.7%(+4.72)#70 | 6.9%(+4.51)#4,449 |
| 71. | Raceland | 11.4% | 6.7%(+4.68)#71 | 6.9%(+4.47)#4,469 |
| 72. | Benham | 11.3% | 6.7%(+4.67)#72 | 6.9%(+4.46)#4,482 |
| 73. | Paducah | 11.3% | 6.7%(+4.59)#73 | 6.9%(+4.38)#4,564 |
| 74. | Somerset | 11.2% | 6.7%(+4.54)#74 | 6.9%(+4.33)#4,613 |
| 75. | Olive Hill | 11.0% | 6.7%(+4.34)#75 | 6.9%(+4.13)#4,767 |
| 76. | Warsaw | 11.0% | 6.7%(+4.29)#76 | 6.9%(+4.08)#4,811 |
| 77. | Vanceburg | 10.9% | 6.7%(+4.27)#77 | 6.9%(+4.06)#4,831 |
| 78. | Crossgate | 10.9% | 6.7%(+4.22)#78 | 6.9%(+4.01)#4,873 |
| 79. | Jackson | 10.9% | 6.7%(+4.21)#79 | 6.9%(+4.00)#4,879 |
| 80. | Langdon Place | 10.9% | 6.7%(+4.21)#80 | 6.9%(+4.00)#4,880 |
| 81. | Ravenna | 10.8% | 6.7%(+4.13)#81 | 6.9%(+3.92)#4,949 |
| 82. | Paintsville | 10.8% | 6.7%(+4.09)#82 | 6.9%(+3.88)#4,992 |
| 83. | Cloverport | 10.7% | 6.7%(+4.07)#83 | 6.9%(+3.86)#5,005 |
| 84. | Hardin | 10.7% | 6.7%(+4.00)#84 | 6.9%(+3.79)#5,061 |
| 85. | Bardstown | 10.6% | 6.7%(+3.96)#85 | 6.9%(+3.75)#5,092 |
| 86. | Kevil | 10.6% | 6.7%(+3.90)#86 | 6.9%(+3.69)#5,150 |
| 87. | Adairville | 10.5% | 6.7%(+3.86)#87 | 6.9%(+3.65)#5,189 |
| 88. | Hazard | 10.5% | 6.7%(+3.85)#88 | 6.9%(+3.64)#5,206 |
| 89. | Catlettsburg | 10.4% | 6.7%(+3.72)#89 | 6.9%(+3.51)#5,329 |
| 90. | Sadieville | 10.3% | 6.7%(+3.68)#90 | 6.9%(+3.46)#5,389 |
| 91. | Bromley | 10.3% | 6.7%(+3.67)#91 | 6.9%(+3.46)#5,400 |
| 92. | Owingsville | 10.3% | 6.7%(+3.62)#92 | 6.9%(+3.41)#5,447 |
| 93. | Island | 10.3% | 6.7%(+3.62)#93 | 6.9%(+3.41)#5,449 |
| 94. | Elkhorn City | 10.2% | 6.7%(+3.57)#94 | 6.9%(+3.36)#5,517 |
| 95. | Princeton | 10.2% | 6.7%(+3.57)#95 | 6.9%(+3.35)#5,522 |
| 96. | Murray | 10.2% | 6.7%(+3.53)#96 | 6.9%(+3.32)#5,560 |
| 97. | Kenvir | 10.1% | 6.7%(+3.48)#97 | 6.9%(+3.26)#5,626 |
| 98. | Carrollton | 10.1% | 6.7%(+3.46)#98 | 6.9%(+3.25)#5,642 |
| 99. | Central City | 10.1% | 6.7%(+3.44)#99 | 6.9%(+3.23)#5,672 |
| 100. | Cawood | 10.1% | 6.7%(+3.39)#100 | 6.9%(+3.17)#5,714 |
Common Questions
What are the Top 10 Cities with the Highest Percentage of Population Employed in Accommodation & Food Services in Kentucky?
Top 10 Cities with the Highest Percentage of Population Employed in Accommodation & Food Services in Kentucky are:
#1
100.0%
#2
57.1%
#3
39.5%
#4
35.9%
#5
31.7%
#6
29.9%
#7
27.0%
#8
21.2%
#9
20.6%
#10
20.0%
What city has the Highest Percentage of Population Employed in Accommodation & Food Services in Kentucky?
Hiseville has the Highest Percentage of Population Employed in Accommodation & Food Services in Kentucky with 100.0%.
What is the Percentage of Population Employed in Accommodation & Food Services in the State of Kentucky?
Percentage of Population Employed in Accommodation & Food Services in Kentucky is 6.7%.
What is the Percentage of Population Employed in Accommodation & Food Services in the United States?
Percentage of Population Employed in Accommodation & Food Services in the United States is 6.9%.