Cities with the Highest Percentage of Population Employed in Accommodation & Food Services in Missouri
RELATED REPORTS & OPTIONS
Accommodation & Food Services
Missouri
Compare Cities
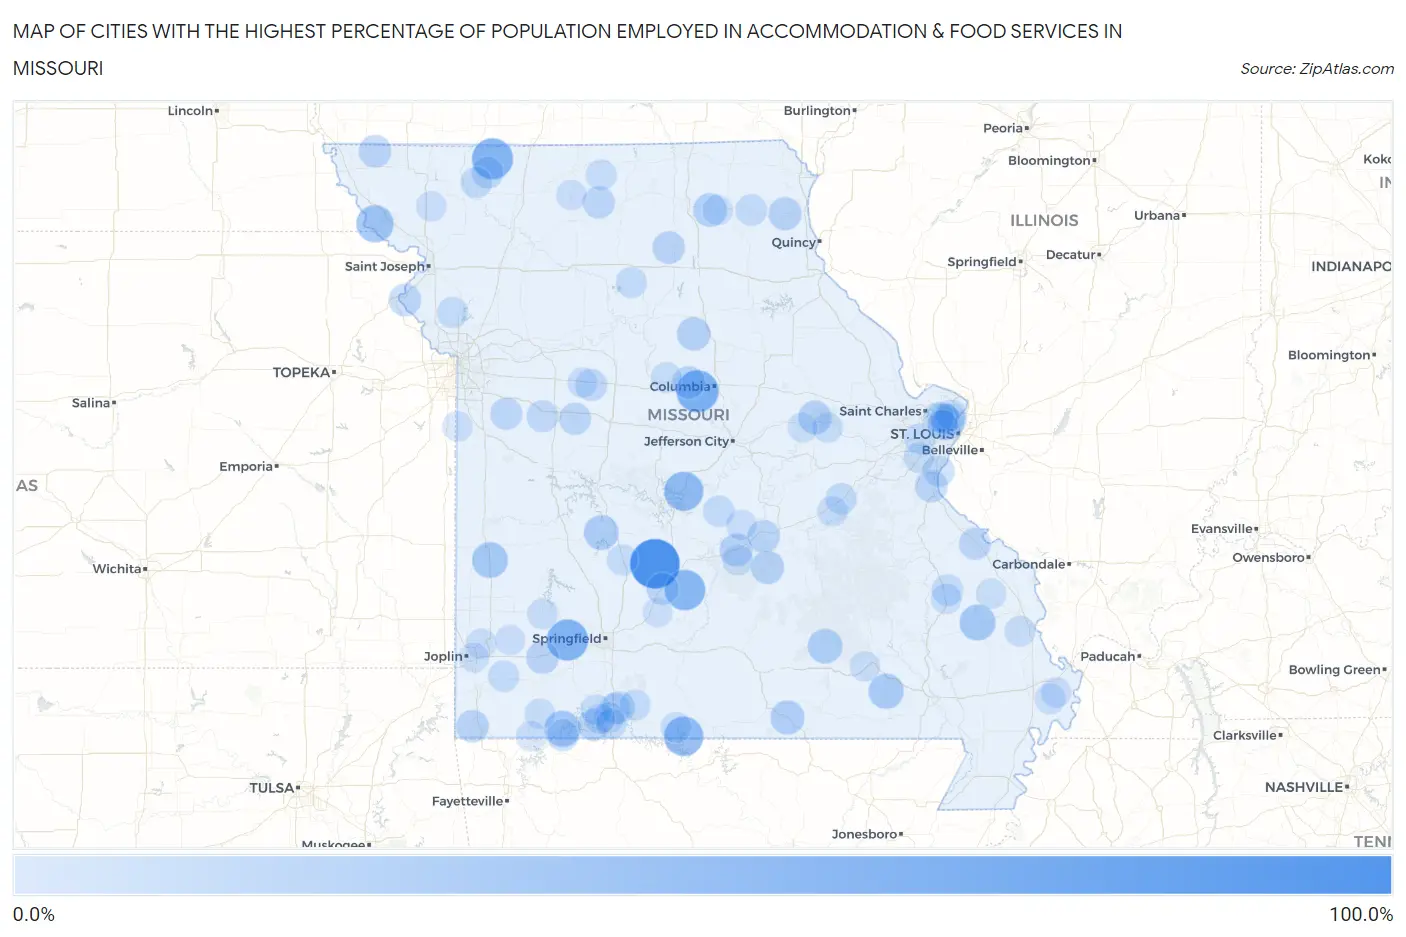
Map of Cities with the Highest Percentage of Population Employed in Accommodation & Food Services in Missouri
0.0%
100.0%
Cities with the Highest Percentage of Population Employed in Accommodation & Food Services in Missouri
| City | % Employed | vs State | vs National | |
| 1. | Bennett Springs | 100.0% | 6.6%(+93.4)#1 | 6.9%(+93.1)#8 |
| 2. | Knob Lick | 100.0% | 6.6%(+93.4)#2 | 6.9%(+93.1)#26 |
| 3. | Huntsdale | 66.7% | 6.6%(+60.1)#3 | 6.9%(+59.8)#66 |
| 4. | Halltown | 62.5% | 6.6%(+55.9)#4 | 6.9%(+55.6)#78 |
| 5. | Allendale | 61.5% | 6.6%(+55.0)#5 | 6.9%(+54.7)#85 |
| 6. | Evergreen | 59.3% | 6.6%(+52.7)#6 | 6.9%(+52.4)#96 |
| 7. | Pontiac | 53.7% | 6.6%(+47.2)#7 | 6.9%(+46.9)#125 |
| 8. | Bagnell | 53.1% | 6.6%(+46.6)#8 | 6.9%(+46.2)#128 |
| 9. | Fortescue | 44.4% | 6.6%(+37.9)#9 | 6.9%(+37.6)#218 |
| 10. | Rocky Comfort | 44.0% | 6.6%(+37.4)#10 | 6.9%(+37.1)#225 |
| 11. | Emerald Beach | 39.3% | 6.6%(+32.8)#11 | 6.9%(+32.4)#282 |
| 12. | Glen Allen | 39.1% | 6.6%(+32.6)#12 | 6.9%(+32.2)#284 |
| 13. | Milo | 38.5% | 6.6%(+31.9)#13 | 6.9%(+31.6)#292 |
| 14. | Grandin | 36.0% | 6.6%(+29.4)#14 | 6.9%(+29.1)#332 |
| 15. | Hermitage | 34.2% | 6.6%(+27.6)#15 | 6.9%(+27.3)#368 |
| 16. | Eminence | 33.5% | 6.6%(+27.0)#16 | 6.9%(+26.7)#376 |
| 17. | Blue Summit | 33.1% | 6.6%(+26.5)#17 | 6.9%(+26.2)#398 |
| 18. | Brandsville | 31.2% | 6.6%(+24.7)#18 | 6.9%(+24.4)#445 |
| 19. | Brashear | 29.6% | 6.6%(+23.1)#19 | 6.9%(+22.7)#495 |
| 20. | Mckittrick | 28.9% | 6.6%(+22.3)#20 | 6.9%(+22.0)#516 |
| 21. | Perkins | 28.8% | 6.6%(+22.2)#21 | 6.9%(+21.9)#519 |
| 22. | Higbee | 28.7% | 6.6%(+22.1)#22 | 6.9%(+21.8)#528 |
| 23. | Edgar Springs | 27.5% | 6.6%(+20.9)#23 | 6.9%(+20.6)#589 |
| 24. | St Robert | 27.1% | 6.6%(+20.6)#24 | 6.9%(+20.3)#603 |
| 25. | Monticello | 26.8% | 6.6%(+20.2)#25 | 6.9%(+19.9)#628 |
| 26. | Faucett | 26.0% | 6.6%(+19.5)#26 | 6.9%(+19.2)#667 |
| 27. | Beverly Hills | 26.0% | 6.6%(+19.4)#27 | 6.9%(+19.1)#673 |
| 28. | Rocheport | 25.8% | 6.6%(+19.3)#28 | 6.9%(+19.0)#688 |
| 29. | Burfordville | 25.0% | 6.6%(+18.4)#29 | 6.9%(+18.1)#732 |
| 30. | Ginger Blue | 25.0% | 6.6%(+18.4)#30 | 6.9%(+18.1)#736 |
| 31. | Westboro | 25.0% | 6.6%(+18.4)#31 | 6.9%(+18.1)#737 |
| 32. | Ethel | 25.0% | 6.6%(+18.4)#32 | 6.9%(+18.1)#739 |
| 33. | Hoberg | 25.0% | 6.6%(+18.4)#33 | 6.9%(+18.1)#740 |
| 34. | Horine | 24.9% | 6.6%(+18.3)#34 | 6.9%(+18.0)#750 |
| 35. | Newburg | 24.8% | 6.6%(+18.2)#35 | 6.9%(+17.9)#757 |
| 36. | Merriam Woods | 24.4% | 6.6%(+17.9)#36 | 6.9%(+17.6)#775 |
| 37. | Lewis And Clark Village | 24.1% | 6.6%(+17.5)#37 | 6.9%(+17.2)#810 |
| 38. | Latham | 23.7% | 6.6%(+17.1)#38 | 6.9%(+16.8)#846 |
| 39. | Osgood | 23.5% | 6.6%(+17.0)#39 | 6.9%(+16.6)#855 |
| 40. | Golden | 23.4% | 6.6%(+16.9)#40 | 6.9%(+16.6)#861 |
| 41. | Flordell Hills | 23.3% | 6.6%(+16.7)#41 | 6.9%(+16.4)#877 |
| 42. | Phillipsburg | 23.2% | 6.6%(+16.6)#42 | 6.9%(+16.3)#888 |
| 43. | Whiteman Afb | 23.1% | 6.6%(+16.5)#43 | 6.9%(+16.2)#891 |
| 44. | Coney Island | 23.1% | 6.6%(+16.5)#44 | 6.9%(+16.2)#898 |
| 45. | Ozora | 22.4% | 6.6%(+15.9)#45 | 6.9%(+15.6)#958 |
| 46. | Strasburg | 22.2% | 6.6%(+15.6)#46 | 6.9%(+15.3)#980 |
| 47. | Denver | 22.2% | 6.6%(+15.6)#47 | 6.9%(+15.3)#989 |
| 48. | Sweet Springs | 22.1% | 6.6%(+15.5)#48 | 6.9%(+15.2)#1,001 |
| 49. | Centerview | 21.9% | 6.6%(+15.4)#49 | 6.9%(+15.0)#1,021 |
| 50. | Kimmswick | 20.8% | 6.6%(+14.2)#50 | 6.9%(+13.9)#1,153 |
| 51. | Knox City | 20.7% | 6.6%(+14.1)#51 | 6.9%(+13.8)#1,160 |
| 52. | Cobalt | 20.4% | 6.6%(+13.8)#52 | 6.9%(+13.5)#1,199 |
| 53. | Iberia | 20.2% | 6.6%(+13.7)#53 | 6.9%(+13.4)#1,216 |
| 54. | Gentry | 20.0% | 6.6%(+13.4)#54 | 6.9%(+13.1)#1,252 |
| 55. | St Cloud | 20.0% | 6.6%(+13.4)#55 | 6.9%(+13.1)#1,258 |
| 56. | Bull Creek | 19.9% | 6.6%(+13.3)#56 | 6.9%(+13.0)#1,267 |
| 57. | Kinloch | 19.4% | 6.6%(+12.9)#57 | 6.9%(+12.5)#1,336 |
| 58. | Winchester | 19.1% | 6.6%(+12.6)#58 | 6.9%(+12.3)#1,404 |
| 59. | Ridgely | 19.0% | 6.6%(+12.5)#59 | 6.9%(+12.2)#1,413 |
| 60. | Ritchey | 19.0% | 6.6%(+12.5)#60 | 6.9%(+12.2)#1,414 |
| 61. | Rothville | 18.8% | 6.6%(+12.2)#61 | 6.9%(+11.9)#1,466 |
| 62. | Taneyville | 18.4% | 6.6%(+11.8)#62 | 6.9%(+11.5)#1,527 |
| 63. | Louisburg | 18.4% | 6.6%(+11.8)#63 | 6.9%(+11.5)#1,528 |
| 64. | Vibbard | 18.2% | 6.6%(+11.7)#64 | 6.9%(+11.4)#1,573 |
| 65. | Branson West | 18.2% | 6.6%(+11.6)#65 | 6.9%(+11.3)#1,583 |
| 66. | Leasburg | 17.6% | 6.6%(+11.0)#66 | 6.9%(+10.7)#1,696 |
| 67. | Newtown | 17.5% | 6.6%(+10.9)#67 | 6.9%(+10.6)#1,711 |
| 68. | Connelsville | 17.5% | 6.6%(+10.9)#68 | 6.9%(+10.6)#1,712 |
| 69. | Franklin | 17.4% | 6.6%(+10.8)#69 | 6.9%(+10.5)#1,736 |
| 70. | Theodosia | 17.4% | 6.6%(+10.8)#70 | 6.9%(+10.5)#1,737 |
| 71. | East Prairie | 17.4% | 6.6%(+10.8)#71 | 6.9%(+10.5)#1,742 |
| 72. | Fort Leonard Wood | 17.4% | 6.6%(+10.8)#72 | 6.9%(+10.5)#1,747 |
| 73. | Dutchtown | 17.2% | 6.6%(+10.7)#73 | 6.9%(+10.4)#1,777 |
| 74. | Branson | 17.2% | 6.6%(+10.6)#74 | 6.9%(+10.3)#1,794 |
| 75. | Castle Point | 17.1% | 6.6%(+10.5)#75 | 6.9%(+10.2)#1,813 |
| 76. | Hollister | 17.0% | 6.6%(+10.4)#76 | 6.9%(+10.1)#1,833 |
| 77. | Berger | 17.0% | 6.6%(+10.4)#77 | 6.9%(+10.1)#1,844 |
| 78. | South Greenfield | 16.7% | 6.6%(+10.1)#78 | 6.9%(+9.79)#1,911 |
| 79. | High Ridge | 16.6% | 6.6%(+10.0)#79 | 6.9%(+9.73)#1,926 |
| 80. | Cassville | 16.6% | 6.6%(+10.0)#80 | 6.9%(+9.71)#1,931 |
| 81. | Edmundson | 16.6% | 6.6%(+9.98)#81 | 6.9%(+9.67)#1,942 |
| 82. | Van Buren | 16.4% | 6.6%(+9.82)#82 | 6.9%(+9.51)#1,979 |
| 83. | Seligman | 16.3% | 6.6%(+9.71)#83 | 6.9%(+9.40)#2,008 |
| 84. | Indian Point | 16.3% | 6.6%(+9.70)#84 | 6.9%(+9.40)#2,010 |
| 85. | Cherokee Pass | 16.2% | 6.6%(+9.66)#85 | 6.9%(+9.36)#2,023 |
| 86. | Cool Valley | 16.2% | 6.6%(+9.58)#86 | 6.9%(+9.28)#2,050 |
| 87. | Hurdland | 15.9% | 6.6%(+9.35)#87 | 6.9%(+9.05)#2,126 |
| 88. | Dixon | 15.9% | 6.6%(+9.31)#88 | 6.9%(+9.00)#2,141 |
| 89. | Anniston | 15.9% | 6.6%(+9.30)#89 | 6.9%(+8.99)#2,147 |
| 90. | Hanley Hills | 15.7% | 6.6%(+9.14)#90 | 6.9%(+8.83)#2,195 |
| 91. | Cleveland | 15.6% | 6.6%(+9.02)#91 | 6.9%(+8.72)#2,238 |
| 92. | Spickard | 15.6% | 6.6%(+9.01)#92 | 6.9%(+8.70)#2,243 |
| 93. | Barnard | 15.5% | 6.6%(+8.96)#93 | 6.9%(+8.65)#2,264 |
| 94. | Brooklyn Heights | 15.5% | 6.6%(+8.94)#94 | 6.9%(+8.64)#2,268 |
| 95. | Avilla | 15.4% | 6.6%(+8.81)#95 | 6.9%(+8.50)#2,306 |
| 96. | Sedgewickville | 15.3% | 6.6%(+8.73)#96 | 6.9%(+8.43)#2,331 |
| 97. | Emma | 15.0% | 6.6%(+8.46)#97 | 6.9%(+8.16)#2,430 |
| 98. | Duquesne | 14.9% | 6.6%(+8.32)#98 | 6.9%(+8.01)#2,489 |
| 99. | Gasconade | 14.6% | 6.6%(+8.08)#99 | 6.9%(+7.77)#2,571 |
| 100. | Niangua | 14.3% | 6.6%(+7.71)#100 | 6.9%(+7.40)#2,716 |
Common Questions
What are the Top 10 Cities with the Highest Percentage of Population Employed in Accommodation & Food Services in Missouri?
Top 10 Cities with the Highest Percentage of Population Employed in Accommodation & Food Services in Missouri are:
#1
100.0%
#2
66.7%
#3
62.5%
#4
61.5%
#5
59.3%
#6
53.7%
#7
53.1%
#8
44.4%
#9
39.3%
#10
39.1%
What city has the Highest Percentage of Population Employed in Accommodation & Food Services in Missouri?
Bennett Springs has the Highest Percentage of Population Employed in Accommodation & Food Services in Missouri with 100.0%.
What is the Percentage of Population Employed in Accommodation & Food Services in the State of Missouri?
Percentage of Population Employed in Accommodation & Food Services in Missouri is 6.6%.
What is the Percentage of Population Employed in Accommodation & Food Services in the United States?
Percentage of Population Employed in Accommodation & Food Services in the United States is 6.9%.