Cities with the Highest Percentage of Population Employed in Accommodation & Food Services in New Jersey
RELATED REPORTS & OPTIONS
Accommodation & Food Services
New Jersey
Compare Cities
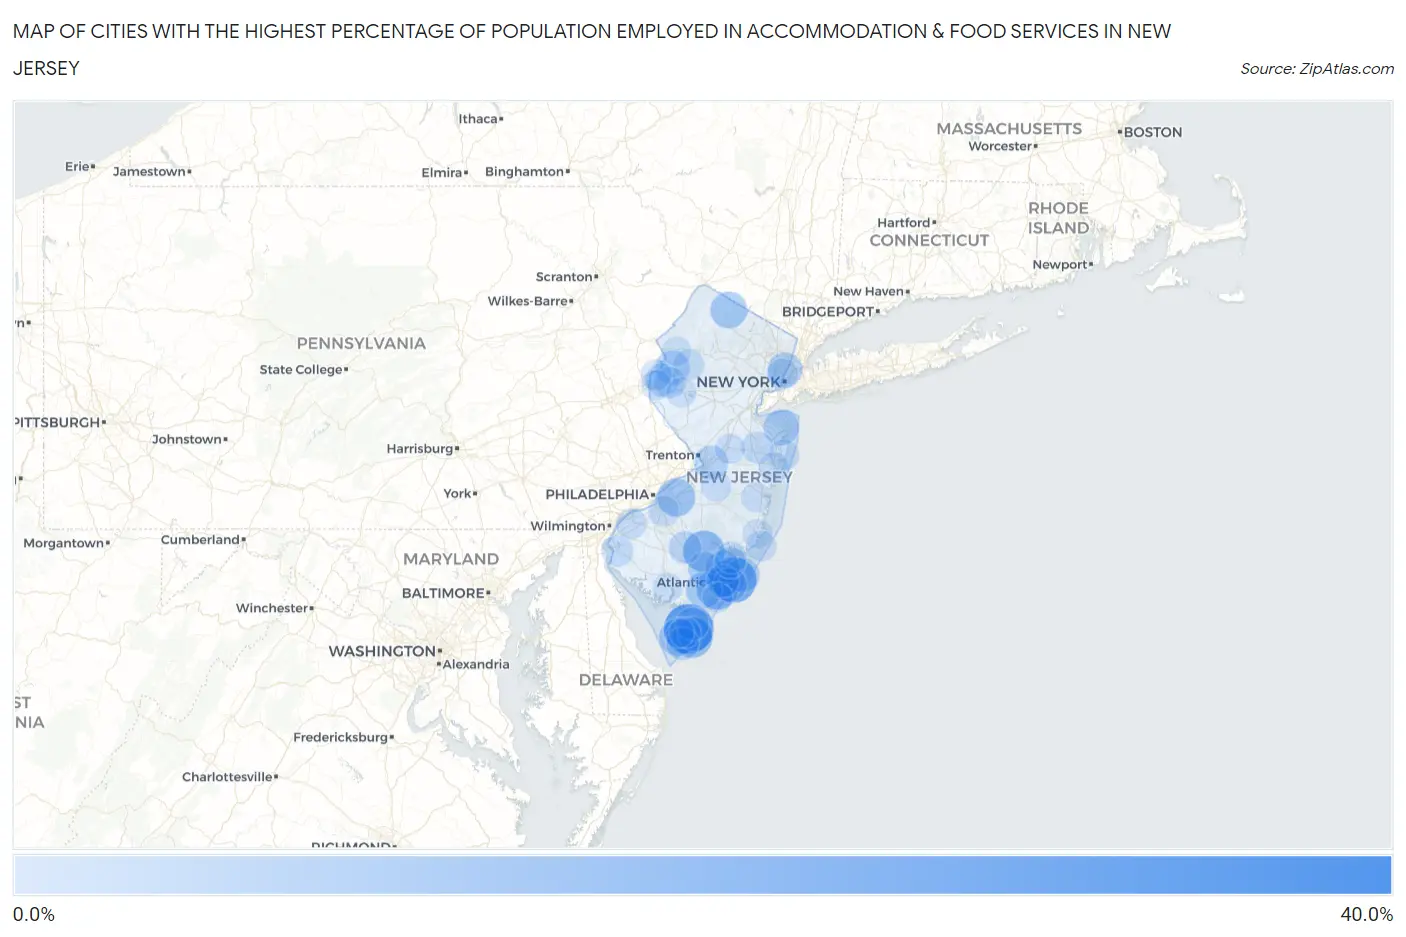
Map of Cities with the Highest Percentage of Population Employed in Accommodation & Food Services in New Jersey
0.0%
40.0%
Cities with the Highest Percentage of Population Employed in Accommodation & Food Services in New Jersey
| City | % Employed | vs State | vs National | |
| 1. | Ocean View | 33.3% | 5.3%(+28.0)#1 | 6.9%(+26.4)#394 |
| 2. | Burleigh | 29.0% | 5.3%(+23.7)#2 | 6.9%(+22.1)#514 |
| 3. | Wrightstown Borough | 27.6% | 5.3%(+22.3)#3 | 6.9%(+20.7)#582 |
| 4. | Dividing Creek | 25.2% | 5.3%(+19.9)#4 | 6.9%(+18.3)#719 |
| 5. | Atlantic City | 24.9% | 5.3%(+19.6)#5 | 6.9%(+18.0)#746 |
| 6. | Gillette | 22.7% | 5.3%(+17.4)#6 | 6.9%(+15.8)#940 |
| 7. | Montclair State University | 20.6% | 5.3%(+15.3)#7 | 6.9%(+13.7)#1,166 |
| 8. | Stockton University | 20.6% | 5.3%(+15.3)#8 | 6.9%(+13.7)#1,168 |
| 9. | Elwood | 20.6% | 5.3%(+15.3)#9 | 6.9%(+13.7)#1,169 |
| 10. | Somers Point | 20.5% | 5.3%(+15.2)#10 | 6.9%(+13.6)#1,179 |
| 11. | Ramapo College Of New Jersey | 20.0% | 5.3%(+14.7)#11 | 6.9%(+13.1)#1,262 |
| 12. | The College Of New Jersey | 19.7% | 5.3%(+14.5)#12 | 6.9%(+12.9)#1,290 |
| 13. | Wildwood | 19.3% | 5.3%(+14.0)#13 | 6.9%(+12.4)#1,366 |
| 14. | Three Bridges | 18.7% | 5.3%(+13.4)#14 | 6.9%(+11.8)#1,479 |
| 15. | Germania | 18.5% | 5.3%(+13.3)#15 | 6.9%(+11.7)#1,503 |
| 16. | Seaside Heights Borough | 18.3% | 5.3%(+13.0)#16 | 6.9%(+11.4)#1,557 |
| 17. | West Cape May Borough | 18.2% | 5.3%(+12.9)#17 | 6.9%(+11.3)#1,594 |
| 18. | William Paterson University Of New Jersey | 17.6% | 5.3%(+12.3)#18 | 6.9%(+10.7)#1,695 |
| 19. | Ramblewood | 17.1% | 5.3%(+11.8)#19 | 6.9%(+10.2)#1,812 |
| 20. | Silver Lake Cdp Essex County | 16.3% | 5.3%(+11.0)#20 | 6.9%(+9.38)#2,013 |
| 21. | North Cape May | 16.0% | 5.3%(+10.7)#21 | 6.9%(+9.09)#2,111 |
| 22. | Marmora | 15.9% | 5.3%(+10.6)#22 | 6.9%(+8.99)#2,149 |
| 23. | Vernon Center | 15.8% | 5.3%(+10.5)#23 | 6.9%(+8.91)#2,166 |
| 24. | Pleasantville | 15.6% | 5.3%(+10.3)#24 | 6.9%(+8.72)#2,237 |
| 25. | Corbin City | 15.1% | 5.3%(+9.83)#25 | 6.9%(+8.22)#2,396 |
| 26. | Navesink | 14.6% | 5.3%(+9.33)#26 | 6.9%(+7.72)#2,595 |
| 27. | Carlls Corner | 14.5% | 5.3%(+9.24)#27 | 6.9%(+7.64)#2,632 |
| 28. | Erma | 14.3% | 5.3%(+9.04)#28 | 6.9%(+7.44)#2,706 |
| 29. | Guttenberg | 14.2% | 5.3%(+8.90)#29 | 6.9%(+7.30)#2,785 |
| 30. | Penns Grove Borough | 14.1% | 5.3%(+8.79)#30 | 6.9%(+7.19)#2,826 |
| 31. | North Wildwood | 13.8% | 5.3%(+8.48)#31 | 6.9%(+6.87)#2,968 |
| 32. | Oxford | 13.6% | 5.3%(+8.37)#32 | 6.9%(+6.77)#3,019 |
| 33. | Lakeside-Beebe Run | 13.6% | 5.3%(+8.36)#33 | 6.9%(+6.76)#3,035 |
| 34. | Brigantine | 13.5% | 5.3%(+8.24)#34 | 6.9%(+6.64)#3,103 |
| 35. | Pomona | 13.5% | 5.3%(+8.22)#35 | 6.9%(+6.62)#3,117 |
| 36. | West Berlin | 13.4% | 5.3%(+8.15)#36 | 6.9%(+6.55)#3,147 |
| 37. | New Vernon | 13.2% | 5.3%(+7.88)#37 | 6.9%(+6.28)#3,274 |
| 38. | Groveville | 13.1% | 5.3%(+7.85)#38 | 6.9%(+6.25)#3,299 |
| 39. | Netcong Borough | 13.1% | 5.3%(+7.78)#39 | 6.9%(+6.18)#3,336 |
| 40. | Macopin | 12.9% | 5.3%(+7.61)#40 | 6.9%(+6.01)#3,431 |
| 41. | Mays Landing | 12.9% | 5.3%(+7.60)#41 | 6.9%(+5.99)#3,443 |
| 42. | Ventnor City | 12.7% | 5.3%(+7.44)#42 | 6.9%(+5.84)#3,527 |
| 43. | Victory Gardens Borough | 12.7% | 5.3%(+7.40)#43 | 6.9%(+5.80)#3,558 |
| 44. | Andover Borough | 12.6% | 5.3%(+7.36)#44 | 6.9%(+5.76)#3,585 |
| 45. | Mckee | 12.6% | 5.3%(+7.35)#45 | 6.9%(+5.75)#3,592 |
| 46. | Swedesboro Borough | 12.6% | 5.3%(+7.28)#46 | 6.9%(+5.68)#3,638 |
| 47. | Cedar Knolls | 12.5% | 5.3%(+7.24)#47 | 6.9%(+5.63)#3,662 |
| 48. | New Village | 12.5% | 5.3%(+7.22)#48 | 6.9%(+5.62)#3,672 |
| 49. | Lawnside Borough | 12.4% | 5.3%(+7.10)#49 | 6.9%(+5.50)#3,756 |
| 50. | Glassboro Borough | 12.4% | 5.3%(+7.10)#50 | 6.9%(+5.49)#3,764 |
| 51. | Raritan Borough | 12.1% | 5.3%(+6.78)#51 | 6.9%(+5.17)#3,966 |
| 52. | Cape May Court House | 11.9% | 5.3%(+6.66)#52 | 6.9%(+5.05)#4,050 |
| 53. | Collings Lakes | 11.7% | 5.3%(+6.45)#53 | 6.9%(+4.85)#4,209 |
| 54. | Cape May | 11.7% | 5.3%(+6.45)#54 | 6.9%(+4.84)#4,210 |
| 55. | Northfield | 11.7% | 5.3%(+6.42)#55 | 6.9%(+4.81)#4,233 |
| 56. | Point Pleasant Beach Borough | 11.2% | 5.3%(+5.94)#56 | 6.9%(+4.34)#4,604 |
| 57. | East Freehold | 11.1% | 5.3%(+5.81)#57 | 6.9%(+4.21)#4,710 |
| 58. | Belmar Borough | 10.9% | 5.3%(+5.65)#58 | 6.9%(+4.05)#4,847 |
| 59. | Port Republic | 10.8% | 5.3%(+5.52)#59 | 6.9%(+3.91)#4,957 |
| 60. | Smithville | 10.8% | 5.3%(+5.51)#60 | 6.9%(+3.90)#4,966 |
| 61. | Wildwood Crest Borough | 10.7% | 5.3%(+5.45)#61 | 6.9%(+3.84)#5,022 |
| 62. | Asbury | 10.5% | 5.3%(+5.25)#62 | 6.9%(+3.65)#5,194 |
| 63. | Rutgers University-Livingston Campus | 10.5% | 5.3%(+5.23)#63 | 6.9%(+3.62)#5,217 |
| 64. | Salem | 10.5% | 5.3%(+5.23)#64 | 6.9%(+3.62)#5,218 |
| 65. | Flemington Borough | 10.5% | 5.3%(+5.18)#65 | 6.9%(+3.57)#5,263 |
| 66. | Sussex Borough | 10.3% | 5.3%(+5.03)#66 | 6.9%(+3.43)#5,425 |
| 67. | Kean University | 10.2% | 5.3%(+4.92)#67 | 6.9%(+3.32)#5,558 |
| 68. | Glendora | 10.2% | 5.3%(+4.90)#68 | 6.9%(+3.30)#5,588 |
| 69. | Asbury Park | 10.2% | 5.3%(+4.89)#69 | 6.9%(+3.28)#5,608 |
| 70. | Cream Ridge | 10.1% | 5.3%(+4.77)#70 | 6.9%(+3.17)#5,715 |
| 71. | Beattystown | 10.0% | 5.3%(+4.77)#71 | 6.9%(+3.17)#5,717 |
| 72. | Highlands Borough | 10.0% | 5.3%(+4.75)#72 | 6.9%(+3.15)#5,744 |
| 73. | Rio Grande | 10.0% | 5.3%(+4.70)#73 | 6.9%(+3.09)#5,813 |
| 74. | Harmony | 9.9% | 5.3%(+4.66)#74 | 6.9%(+3.06)#5,854 |
| 75. | Union City | 9.9% | 5.3%(+4.64)#75 | 6.9%(+3.03)#5,875 |
| 76. | Allenwood | 9.8% | 5.3%(+4.57)#76 | 6.9%(+2.96)#5,949 |
| 77. | Beckett | 9.8% | 5.3%(+4.55)#77 | 6.9%(+2.95)#5,966 |
| 78. | Keansburg Borough | 9.8% | 5.3%(+4.49)#78 | 6.9%(+2.88)#6,056 |
| 79. | Marlboro | 9.7% | 5.3%(+4.40)#79 | 6.9%(+2.80)#6,166 |
| 80. | North Beach Haven | 9.7% | 5.3%(+4.39)#80 | 6.9%(+2.79)#6,169 |
| 81. | Villas | 9.6% | 5.3%(+4.34)#81 | 6.9%(+2.74)#6,226 |
| 82. | Milford Borough | 9.6% | 5.3%(+4.34)#82 | 6.9%(+2.73)#6,242 |
| 83. | Landing | 9.5% | 5.3%(+4.27)#83 | 6.9%(+2.66)#6,326 |
| 84. | Rainbow Lakes | 9.5% | 5.3%(+4.22)#84 | 6.9%(+2.61)#6,391 |
| 85. | Fort Dix | 9.5% | 5.3%(+4.21)#85 | 6.9%(+2.60)#6,407 |
| 86. | Dunellen Borough | 9.4% | 5.3%(+4.14)#86 | 6.9%(+2.53)#6,496 |
| 87. | Holiday Heights | 9.4% | 5.3%(+4.12)#87 | 6.9%(+2.52)#6,516 |
| 88. | Freehold Borough | 9.4% | 5.3%(+4.11)#88 | 6.9%(+2.51)#6,528 |
| 89. | Twin Rivers | 9.4% | 5.3%(+4.09)#89 | 6.9%(+2.49)#6,558 |
| 90. | Woodlynne Borough | 9.4% | 5.3%(+4.09)#90 | 6.9%(+2.48)#6,567 |
| 91. | Hamburg Borough | 9.4% | 5.3%(+4.08)#91 | 6.9%(+2.47)#6,579 |
| 92. | Menlo Park Terrace | 9.3% | 5.3%(+4.04)#92 | 6.9%(+2.43)#6,631 |
| 93. | Greenwich | 9.3% | 5.3%(+4.00)#93 | 6.9%(+2.39)#6,682 |
| 94. | Layton | 9.2% | 5.3%(+3.97)#94 | 6.9%(+2.36)#6,726 |
| 95. | Ocean City | 9.2% | 5.3%(+3.96)#95 | 6.9%(+2.36)#6,734 |
| 96. | Clinton | 9.2% | 5.3%(+3.95)#96 | 6.9%(+2.35)#6,741 |
| 97. | Hope | 9.2% | 5.3%(+3.93)#97 | 6.9%(+2.32)#6,786 |
| 98. | Manahawkin | 9.2% | 5.3%(+3.89)#98 | 6.9%(+2.28)#6,842 |
| 99. | Laurel Lake | 9.1% | 5.3%(+3.86)#99 | 6.9%(+2.26)#6,880 |
| 100. | Bloomsbury Borough | 9.1% | 5.3%(+3.85)#100 | 6.9%(+2.25)#6,889 |
Common Questions
What are the Top 10 Cities with the Highest Percentage of Population Employed in Accommodation & Food Services in New Jersey?
Top 10 Cities with the Highest Percentage of Population Employed in Accommodation & Food Services in New Jersey are:
#1
29.0%
#2
24.9%
#3
20.6%
#4
20.5%
#5
19.3%
#6
17.1%
#7
16.0%
#8
15.8%
#9
15.6%
#10
15.1%
What city has the Highest Percentage of Population Employed in Accommodation & Food Services in New Jersey?
Burleigh has the Highest Percentage of Population Employed in Accommodation & Food Services in New Jersey with 29.0%.
What is the Percentage of Population Employed in Accommodation & Food Services in the State of New Jersey?
Percentage of Population Employed in Accommodation & Food Services in New Jersey is 5.3%.
What is the Percentage of Population Employed in Accommodation & Food Services in the United States?
Percentage of Population Employed in Accommodation & Food Services in the United States is 6.9%.