Cities with the Highest Percentage of Population Employed in Accommodation & Food Services in Connecticut
RELATED REPORTS & OPTIONS
Accommodation & Food Services
Connecticut
Compare Cities
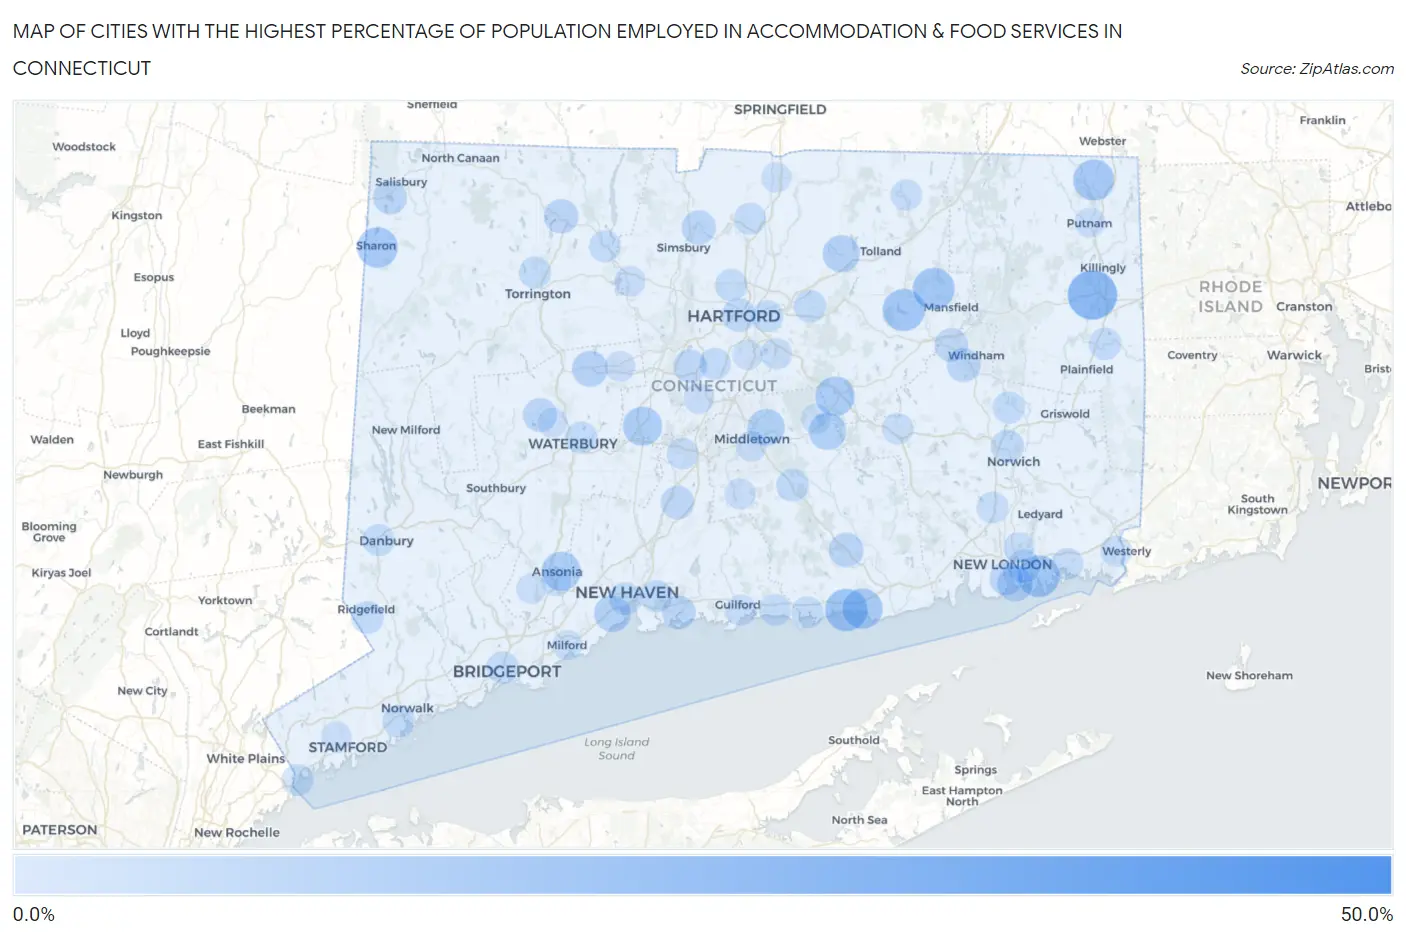
Map of Cities with the Highest Percentage of Population Employed in Accommodation & Food Services in Connecticut
0.0%
50.0%
Cities with the Highest Percentage of Population Employed in Accommodation & Food Services in Connecticut
| City | % Employed | vs State | vs National | |
| 1. | Candlewood Lake Club | 48.8% | 5.6%(+43.2)#1 | 6.9%(+41.9)#178 |
| 2. | Sacred Heart University | 27.9% | 5.6%(+22.3)#2 | 6.9%(+21.0)#570 |
| 3. | East Brooklyn | 25.9% | 5.6%(+20.3)#3 | 6.9%(+19.1)#675 |
| 4. | Danielson Borough | 22.3% | 5.6%(+16.7)#4 | 6.9%(+15.4)#967 |
| 5. | Candlewood Orchards | 18.9% | 5.6%(+13.3)#5 | 6.9%(+12.1)#1,431 |
| 6. | Westbrook Center | 18.2% | 5.6%(+12.6)#6 | 6.9%(+11.3)#1,579 |
| 7. | South Coventry | 17.8% | 5.6%(+12.2)#7 | 6.9%(+11.0)#1,651 |
| 8. | Poquonock Bridge | 17.7% | 5.6%(+12.0)#8 | 6.9%(+10.8)#1,687 |
| 9. | Storrs | 17.5% | 5.6%(+11.8)#9 | 6.9%(+10.6)#1,719 |
| 10. | Taylor Corners | 16.8% | 5.6%(+11.2)#10 | 6.9%(+9.93)#1,875 |
| 11. | North Grosvenor Dale | 16.7% | 5.6%(+11.1)#11 | 6.9%(+9.84)#1,889 |
| 12. | Sharon | 16.1% | 5.6%(+10.4)#12 | 6.9%(+9.20)#2,078 |
| 13. | Saybrook Manor | 15.9% | 5.6%(+10.3)#13 | 6.9%(+9.03)#2,131 |
| 14. | Brookfield Center | 15.1% | 5.6%(+9.45)#14 | 6.9%(+8.20)#2,411 |
| 15. | Terramuggus | 14.8% | 5.6%(+9.17)#15 | 6.9%(+7.93)#2,519 |
| 16. | Plantsville | 14.4% | 5.6%(+8.80)#16 | 6.9%(+7.55)#2,661 |
| 17. | Ansonia | 14.4% | 5.6%(+8.78)#17 | 6.9%(+7.53)#2,674 |
| 18. | Bantam Borough | 13.0% | 5.6%(+7.37)#18 | 6.9%(+6.12)#3,370 |
| 19. | East Hampton | 12.4% | 5.6%(+6.76)#19 | 6.9%(+5.52)#3,746 |
| 20. | Portland | 12.3% | 5.6%(+6.69)#20 | 6.9%(+5.44)#3,794 |
| 21. | Rockville | 12.3% | 5.6%(+6.63)#21 | 6.9%(+5.38)#3,837 |
| 22. | Fairfield University | 12.0% | 5.6%(+6.38)#22 | 6.9%(+5.13)#3,997 |
| 23. | Hawleyville | 11.8% | 5.6%(+6.21)#23 | 6.9%(+4.96)#4,125 |
| 24. | West Haven | 11.8% | 5.6%(+6.18)#24 | 6.9%(+4.93)#4,139 |
| 25. | Fenwick Borough | 11.8% | 5.6%(+6.13)#25 | 6.9%(+4.88)#4,192 |
| 26. | Candlewood Shores | 11.1% | 5.6%(+5.48)#26 | 6.9%(+4.23)#4,680 |
| 27. | Terryville | 11.0% | 5.6%(+5.37)#27 | 6.9%(+4.12)#4,781 |
| 28. | Groton | 10.8% | 5.6%(+5.13)#28 | 6.9%(+3.88)#4,986 |
| 29. | Bigelow Corners | 10.7% | 5.6%(+5.05)#29 | 6.9%(+3.80)#5,056 |
| 30. | Stonington Borough | 10.5% | 5.6%(+4.87)#30 | 6.9%(+3.62)#5,219 |
| 31. | Riverton | 9.9% | 5.6%(+4.23)#31 | 6.9%(+2.99)#5,920 |
| 32. | Quinnipiac University | 9.7% | 5.6%(+4.11)#32 | 6.9%(+2.87)#6,083 |
| 33. | Candlewood Knolls | 9.7% | 5.6%(+4.09)#33 | 6.9%(+2.84)#6,116 |
| 34. | Deep River Center | 9.4% | 5.6%(+3.74)#34 | 6.9%(+2.50)#6,539 |
| 35. | Winsted | 9.3% | 5.6%(+3.62)#35 | 6.9%(+2.37)#6,715 |
| 36. | Tariffville | 9.2% | 5.6%(+3.59)#36 | 6.9%(+2.34)#6,759 |
| 37. | Old Hill | 9.2% | 5.6%(+3.52)#37 | 6.9%(+2.27)#6,856 |
| 38. | Jewett City Borough | 9.2% | 5.6%(+3.52)#38 | 6.9%(+2.27)#6,858 |
| 39. | Lakeville | 8.8% | 5.6%(+3.13)#39 | 6.9%(+1.88)#7,457 |
| 40. | Watertown | 8.7% | 5.6%(+3.11)#40 | 6.9%(+1.86)#7,481 |
| 41. | South Windham | 8.7% | 5.6%(+3.02)#41 | 6.9%(+1.77)#7,615 |
| 42. | Branford Center | 8.6% | 5.6%(+3.00)#42 | 6.9%(+1.75)#7,652 |
| 43. | Hartford | 8.5% | 5.6%(+2.91)#43 | 6.9%(+1.66)#7,803 |
| 44. | Long Hill | 8.5% | 5.6%(+2.88)#44 | 6.9%(+1.63)#7,862 |
| 45. | Wallingford Center | 8.5% | 5.6%(+2.87)#45 | 6.9%(+1.63)#7,864 |
| 46. | Willimantic | 8.4% | 5.6%(+2.79)#46 | 6.9%(+1.55)#7,993 |
| 47. | New London | 8.2% | 5.6%(+2.61)#47 | 6.9%(+1.36)#8,330 |
| 48. | New Britain | 8.1% | 5.6%(+2.47)#48 | 6.9%(+1.22)#8,563 |
| 49. | Newtown Borough | 7.9% | 5.6%(+2.26)#49 | 6.9%(+1.01)#8,945 |
| 50. | Norwich | 7.9% | 5.6%(+2.23)#50 | 6.9%(+0.982)#8,995 |
| 51. | Trumbull Center | 7.8% | 5.6%(+2.12)#51 | 6.9%(+0.869)#9,219 |
| 52. | Higganum | 7.6% | 5.6%(+1.98)#52 | 6.9%(+0.737)#9,488 |
| 53. | New Haven | 7.5% | 5.6%(+1.90)#53 | 6.9%(+0.657)#9,668 |
| 54. | Candlewood Isle | 7.4% | 5.6%(+1.79)#54 | 6.9%(+0.540)#9,931 |
| 55. | Norwalk | 7.2% | 5.6%(+1.61)#55 | 6.9%(+0.362)#10,279 |
| 56. | Ridgefield | 7.2% | 5.6%(+1.58)#56 | 6.9%(+0.334)#10,337 |
| 57. | Manchester | 7.2% | 5.6%(+1.57)#57 | 6.9%(+0.323)#10,356 |
| 58. | Oronoque | 7.1% | 5.6%(+1.51)#58 | 6.9%(+0.267)#10,474 |
| 59. | East Haven | 7.1% | 5.6%(+1.51)#59 | 6.9%(+0.260)#10,523 |
| 60. | Bridgeport | 7.1% | 5.6%(+1.49)#60 | 6.9%(+0.238)#10,551 |
| 61. | Moosup | 7.1% | 5.6%(+1.45)#61 | 6.9%(+0.203)#10,619 |
| 62. | Waterbury | 6.9% | 5.6%(+1.28)#62 | 6.9%(+0.032)#11,000 |
| 63. | Baltic | 6.9% | 5.6%(+1.27)#63 | 6.9%(+0.027)#11,015 |
| 64. | Blue Hills | 6.9% | 5.6%(+1.25)#64 | 6.9%(-0.000)#11,071 |
| 65. | Torrington | 6.8% | 5.6%(+1.18)#65 | 6.9%(-0.070)#11,263 |
| 66. | Clinton | 6.8% | 5.6%(+1.15)#66 | 6.9%(-0.102)#11,336 |
| 67. | Danbury | 6.7% | 5.6%(+1.11)#67 | 6.9%(-0.136)#11,424 |
| 68. | Byram | 6.6% | 5.6%(+0.987)#68 | 6.9%(-0.260)#11,713 |
| 69. | East Hartford | 6.6% | 5.6%(+0.965)#69 | 6.9%(-0.283)#11,767 |
| 70. | Madison Center | 6.6% | 5.6%(+0.952)#70 | 6.9%(-0.296)#11,807 |
| 71. | Windsor Locks | 6.5% | 5.6%(+0.896)#71 | 6.9%(-0.351)#11,919 |
| 72. | New Hartford Center | 6.5% | 5.6%(+0.896)#72 | 6.9%(-0.352)#11,920 |
| 73. | Newington | 6.5% | 5.6%(+0.853)#73 | 6.9%(-0.395)#12,027 |
| 74. | Oxoboxo River | 6.4% | 5.6%(+0.730)#74 | 6.9%(-0.517)#12,324 |
| 75. | Mystic | 6.3% | 5.6%(+0.653)#75 | 6.9%(-0.595)#12,510 |
| 76. | Colchester | 6.1% | 5.6%(+0.503)#76 | 6.9%(-0.745)#12,899 |
| 77. | Meriden | 6.1% | 5.6%(+0.480)#77 | 6.9%(-0.768)#12,959 |
| 78. | Pawcatuck | 6.1% | 5.6%(+0.458)#78 | 6.9%(-0.790)#13,015 |
| 79. | Glastonbury Center | 5.9% | 5.6%(+0.274)#79 | 6.9%(-0.974)#13,471 |
| 80. | Stafford Springs | 5.8% | 5.6%(+0.138)#80 | 6.9%(-1.11)#13,805 |
| 81. | Guilford Center | 5.4% | 5.6%(-0.205)#81 | 6.9%(-1.45)#14,653 |
| 82. | Durham | 5.4% | 5.6%(-0.241)#82 | 6.9%(-1.49)#14,748 |
| 83. | Collinsville | 5.4% | 5.6%(-0.277)#83 | 6.9%(-1.52)#14,836 |
| 84. | Middletown | 5.3% | 5.6%(-0.346)#84 | 6.9%(-1.59)#15,009 |
| 85. | Bristol | 5.1% | 5.6%(-0.496)#85 | 6.9%(-1.74)#15,378 |
| 86. | Putnam | 5.1% | 5.6%(-0.576)#86 | 6.9%(-1.82)#15,562 |
| 87. | Conning Towers Nautilus Park | 5.0% | 5.6%(-0.646)#87 | 6.9%(-1.89)#15,768 |
| 88. | Kensington | 4.9% | 5.6%(-0.695)#88 | 6.9%(-1.94)#15,888 |
| 89. | Stamford | 4.9% | 5.6%(-0.755)#89 | 6.9%(-2.00)#16,042 |
| 90. | Wethersfield | 4.8% | 5.6%(-0.786)#90 | 6.9%(-2.03)#16,131 |
| 91. | Derby | 4.8% | 5.6%(-0.842)#91 | 6.9%(-2.09)#16,261 |
| 92. | Lake Pocotopaug | 4.8% | 5.6%(-0.867)#92 | 6.9%(-2.11)#16,312 |
| 93. | Shelton | 4.8% | 5.6%(-0.880)#93 | 6.9%(-2.13)#16,359 |
| 94. | Daniels Farm | 4.7% | 5.6%(-0.918)#94 | 6.9%(-2.17)#16,444 |
| 95. | Litchfield Borough | 4.7% | 5.6%(-0.922)#95 | 6.9%(-2.17)#16,456 |
| 96. | Milford City Balance | 4.7% | 5.6%(-0.923)#96 | 6.9%(-2.17)#16,460 |
| 97. | Sandy Hook | 4.6% | 5.6%(-0.998)#97 | 6.9%(-2.25)#16,650 |
| 98. | Mill Plain | 4.6% | 5.6%(-1.01)#98 | 6.9%(-2.26)#16,672 |
| 99. | Oakville | 4.6% | 5.6%(-1.03)#99 | 6.9%(-2.27)#16,719 |
| 100. | Thompsonville | 4.6% | 5.6%(-1.08)#100 | 6.9%(-2.33)#16,871 |
Common Questions
What are the Top 10 Cities with the Highest Percentage of Population Employed in Accommodation & Food Services in Connecticut?
Top 10 Cities with the Highest Percentage of Population Employed in Accommodation & Food Services in Connecticut are:
#1
25.9%
#2
18.2%
#3
17.8%
#4
17.7%
#5
17.5%
#6
16.7%
#7
16.1%
#8
15.9%
#9
14.8%
#10
14.4%
What city has the Highest Percentage of Population Employed in Accommodation & Food Services in Connecticut?
East Brooklyn has the Highest Percentage of Population Employed in Accommodation & Food Services in Connecticut with 25.9%.
What is the Percentage of Population Employed in Accommodation & Food Services in the State of Connecticut?
Percentage of Population Employed in Accommodation & Food Services in Connecticut is 5.6%.
What is the Percentage of Population Employed in Accommodation & Food Services in the United States?
Percentage of Population Employed in Accommodation & Food Services in the United States is 6.9%.