Cities with the Highest Percentage of Population Employed in Accommodation & Food Services in Utah
RELATED REPORTS & OPTIONS
Accommodation & Food Services
Utah
Compare Cities
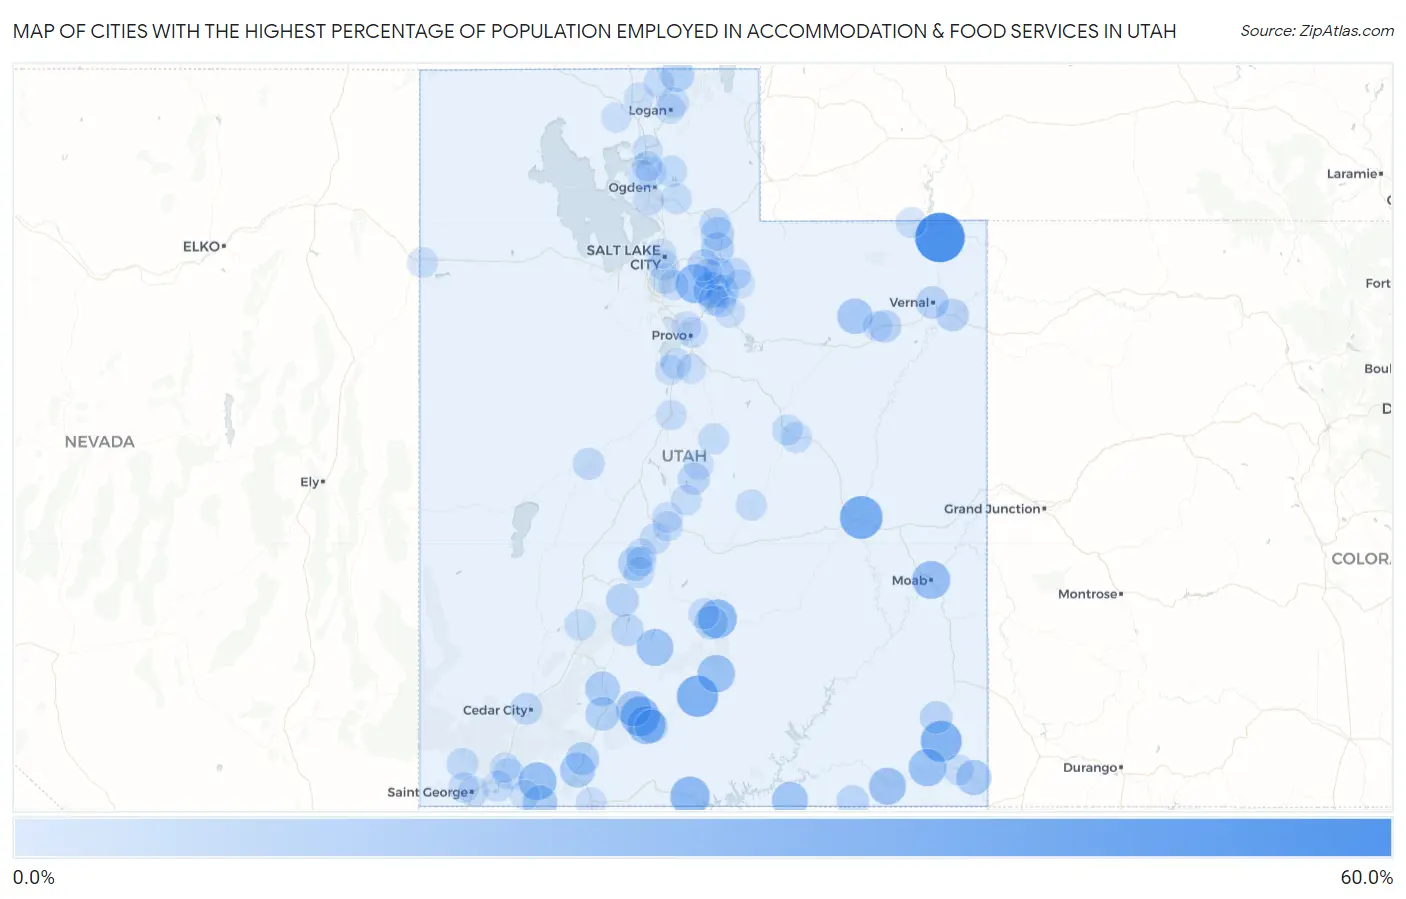
Map of Cities with the Highest Percentage of Population Employed in Accommodation & Food Services in Utah
0.0%
60.0%
Cities with the Highest Percentage of Population Employed in Accommodation & Food Services in Utah
| City | % Employed | vs State | vs National | |
| 1. | Flaming Gorge | 57.6% | 6.1%(+51.5)#1 | 6.9%(+50.7)#103 |
| 2. | Green River | 39.4% | 6.1%(+33.3)#2 | 6.9%(+32.6)#277 |
| 3. | Escalante | 35.6% | 6.1%(+29.5)#3 | 6.9%(+28.7)#341 |
| 4. | White Mesa | 34.6% | 6.1%(+28.5)#4 | 6.9%(+27.7)#362 |
| 5. | Tropic | 30.6% | 6.1%(+24.4)#5 | 6.9%(+23.7)#465 |
| 6. | Big Water | 30.5% | 6.1%(+24.4)#6 | 6.9%(+23.6)#467 |
| 7. | Torrey | 29.1% | 6.1%(+22.9)#7 | 6.9%(+22.2)#510 |
| 8. | Alta | 28.7% | 6.1%(+22.6)#8 | 6.9%(+21.9)#523 |
| 9. | Cannonville | 27.3% | 6.1%(+21.2)#9 | 6.9%(+20.5)#594 |
| 10. | Moab | 27.0% | 6.1%(+20.9)#10 | 6.9%(+20.1)#615 |
| 11. | Springdale | 26.8% | 6.1%(+20.7)#11 | 6.9%(+19.9)#625 |
| 12. | Bluff | 25.9% | 6.1%(+19.8)#12 | 6.9%(+19.0)#681 |
| 13. | Boulder | 25.7% | 6.1%(+19.5)#13 | 6.9%(+18.8)#693 |
| 14. | Halchita | 24.7% | 6.1%(+18.6)#14 | 6.9%(+17.9)#760 |
| 15. | Antimony | 24.1% | 6.1%(+18.0)#15 | 6.9%(+17.3)#802 |
| 16. | Navajo Mountain | 22.2% | 6.1%(+16.1)#16 | 6.9%(+15.3)#974 |
| 17. | Interlaken | 21.8% | 6.1%(+15.7)#17 | 6.9%(+14.9)#1,028 |
| 18. | Bryce Canyon City | 20.8% | 6.1%(+14.7)#18 | 6.9%(+13.9)#1,143 |
| 19. | Bluebell | 20.5% | 6.1%(+14.3)#19 | 6.9%(+13.6)#1,189 |
| 20. | Aneth | 20.0% | 6.1%(+13.9)#20 | 6.9%(+13.1)#1,242 |
| 21. | Orderville | 19.7% | 6.1%(+13.6)#21 | 6.9%(+12.8)#1,297 |
| 22. | Panguitch | 18.3% | 6.1%(+12.2)#22 | 6.9%(+11.4)#1,552 |
| 23. | Hildale | 18.2% | 6.1%(+12.1)#23 | 6.9%(+11.3)#1,577 |
| 24. | Elsinore | 16.7% | 6.1%(+10.6)#24 | 6.9%(+9.85)#1,888 |
| 25. | Hatch | 16.7% | 6.1%(+10.5)#25 | 6.9%(+9.79)#1,909 |
| 26. | Teasdale | 16.3% | 6.1%(+10.2)#26 | 6.9%(+9.45)#1,993 |
| 27. | Cove | 16.3% | 6.1%(+10.1)#27 | 6.9%(+9.38)#2,012 |
| 28. | Coalville | 15.4% | 6.1%(+9.29)#28 | 6.9%(+8.52)#2,293 |
| 29. | Henrieville | 15.2% | 6.1%(+9.05)#29 | 6.9%(+8.29)#2,368 |
| 30. | Glendale | 15.1% | 6.1%(+9.01)#30 | 6.9%(+8.25)#2,388 |
| 31. | Marysvale | 14.9% | 6.1%(+8.73)#31 | 6.9%(+7.97)#2,499 |
| 32. | Wanship | 14.6% | 6.1%(+8.46)#32 | 6.9%(+7.70)#2,602 |
| 33. | Blanding | 13.6% | 6.1%(+7.53)#33 | 6.9%(+6.77)#3,021 |
| 34. | Ballard | 13.6% | 6.1%(+7.52)#34 | 6.9%(+6.76)#3,023 |
| 35. | Jensen | 13.6% | 6.1%(+7.49)#35 | 6.9%(+6.72)#3,060 |
| 36. | Vernal | 13.5% | 6.1%(+7.35)#36 | 6.9%(+6.59)#3,130 |
| 37. | Heber | 13.4% | 6.1%(+7.32)#37 | 6.9%(+6.55)#3,144 |
| 38. | Hideout | 13.2% | 6.1%(+7.03)#38 | 6.9%(+6.27)#3,280 |
| 39. | Junction | 13.0% | 6.1%(+6.84)#39 | 6.9%(+6.08)#3,382 |
| 40. | Oljato Monument Valley | 12.6% | 6.1%(+6.48)#40 | 6.9%(+5.72)#3,610 |
| 41. | Daniel | 12.4% | 6.1%(+6.31)#41 | 6.9%(+5.55)#3,730 |
| 42. | Snyderville | 12.1% | 6.1%(+5.94)#42 | 6.9%(+5.18)#3,963 |
| 43. | Manti | 11.8% | 6.1%(+5.71)#43 | 6.9%(+4.95)#4,130 |
| 44. | Delta | 11.8% | 6.1%(+5.64)#44 | 6.9%(+4.88)#4,194 |
| 45. | Dammeron Valley | 11.5% | 6.1%(+5.42)#45 | 6.9%(+4.66)#4,334 |
| 46. | Cedar City | 11.2% | 6.1%(+5.06)#46 | 6.9%(+4.30)#4,632 |
| 47. | Kamas | 11.1% | 6.1%(+4.96)#47 | 6.9%(+4.20)#4,715 |
| 48. | Wolf Creek | 10.7% | 6.1%(+4.62)#48 | 6.9%(+3.86)#5,006 |
| 49. | La Verkin | 10.3% | 6.1%(+4.15)#49 | 6.9%(+3.39)#5,479 |
| 50. | Echo | 10.3% | 6.1%(+4.14)#50 | 6.9%(+3.38)#5,505 |
| 51. | Beaver | 10.0% | 6.1%(+3.89)#51 | 6.9%(+3.13)#5,763 |
| 52. | Monroe | 10.0% | 6.1%(+3.87)#52 | 6.9%(+3.11)#5,800 |
| 53. | Wellington | 9.9% | 6.1%(+3.83)#53 | 6.9%(+3.07)#5,841 |
| 54. | Ferron | 9.7% | 6.1%(+3.59)#54 | 6.9%(+2.83)#6,123 |
| 55. | Sigurd | 9.6% | 6.1%(+3.53)#55 | 6.9%(+2.77)#6,195 |
| 56. | Bicknell | 9.6% | 6.1%(+3.50)#56 | 6.9%(+2.74)#6,219 |
| 57. | Hurricane | 9.6% | 6.1%(+3.44)#57 | 6.9%(+2.68)#6,315 |
| 58. | Mount Pleasant | 9.5% | 6.1%(+3.42)#58 | 6.9%(+2.66)#6,330 |
| 59. | Price | 9.5% | 6.1%(+3.40)#59 | 6.9%(+2.64)#6,356 |
| 60. | South Salt Lake | 9.5% | 6.1%(+3.40)#60 | 6.9%(+2.64)#6,358 |
| 61. | West Mountain | 9.4% | 6.1%(+3.32)#61 | 6.9%(+2.56)#6,459 |
| 62. | Mountain Green | 9.4% | 6.1%(+3.32)#62 | 6.9%(+2.56)#6,463 |
| 63. | Pleasant View | 9.3% | 6.1%(+3.15)#63 | 6.9%(+2.39)#6,690 |
| 64. | Manila | 9.2% | 6.1%(+3.10)#64 | 6.9%(+2.34)#6,764 |
| 65. | Richfield | 9.2% | 6.1%(+3.09)#65 | 6.9%(+2.33)#6,774 |
| 66. | North Logan | 9.2% | 6.1%(+3.06)#66 | 6.9%(+2.30)#6,819 |
| 67. | Trenton | 9.0% | 6.1%(+2.88)#67 | 6.9%(+2.12)#7,094 |
| 68. | Brighton | 9.0% | 6.1%(+2.87)#68 | 6.9%(+2.11)#7,102 |
| 69. | Santa Clara | 9.0% | 6.1%(+2.87)#69 | 6.9%(+2.10)#7,118 |
| 70. | Montezuma Creek | 9.0% | 6.1%(+2.84)#70 | 6.9%(+2.07)#7,174 |
| 71. | Charleston | 8.9% | 6.1%(+2.75)#71 | 6.9%(+1.99)#7,309 |
| 72. | Wendover | 8.8% | 6.1%(+2.67)#72 | 6.9%(+1.91)#7,426 |
| 73. | Sunset | 8.8% | 6.1%(+2.66)#73 | 6.9%(+1.90)#7,437 |
| 74. | Redmond | 8.7% | 6.1%(+2.55)#74 | 6.9%(+1.79)#7,584 |
| 75. | Mayfield | 8.6% | 6.1%(+2.45)#75 | 6.9%(+1.69)#7,743 |
| 76. | Nephi | 8.6% | 6.1%(+2.45)#76 | 6.9%(+1.69)#7,761 |
| 77. | Midvale | 8.5% | 6.1%(+2.34)#77 | 6.9%(+1.57)#7,953 |
| 78. | Perry | 8.4% | 6.1%(+2.27)#78 | 6.9%(+1.51)#8,054 |
| 79. | Provo | 8.4% | 6.1%(+2.24)#79 | 6.9%(+1.48)#8,108 |
| 80. | Park City | 8.4% | 6.1%(+2.24)#80 | 6.9%(+1.48)#8,110 |
| 81. | Independence | 8.3% | 6.1%(+2.21)#81 | 6.9%(+1.45)#8,183 |
| 82. | Kanab | 8.3% | 6.1%(+2.20)#82 | 6.9%(+1.43)#8,206 |
| 83. | Salina | 8.3% | 6.1%(+2.17)#83 | 6.9%(+1.41)#8,250 |
| 84. | Logan | 8.1% | 6.1%(+1.99)#84 | 6.9%(+1.22)#8,561 |
| 85. | Roosevelt | 8.1% | 6.1%(+1.95)#85 | 6.9%(+1.19)#8,616 |
| 86. | St George | 7.8% | 6.1%(+1.72)#86 | 6.9%(+0.955)#9,059 |
| 87. | South Willard | 7.8% | 6.1%(+1.65)#87 | 6.9%(+0.886)#9,180 |
| 88. | Granite | 7.8% | 6.1%(+1.64)#88 | 6.9%(+0.878)#9,202 |
| 89. | Ephraim | 7.7% | 6.1%(+1.53)#89 | 6.9%(+0.769)#9,420 |
| 90. | Toquerville | 7.6% | 6.1%(+1.51)#90 | 6.9%(+0.744)#9,473 |
| 91. | Thatcher | 7.5% | 6.1%(+1.41)#91 | 6.9%(+0.648)#9,687 |
| 92. | Central Valley | 7.5% | 6.1%(+1.40)#92 | 6.9%(+0.640)#9,708 |
| 93. | Salt Lake City | 7.4% | 6.1%(+1.31)#93 | 6.9%(+0.552)#9,905 |
| 94. | Genola | 7.4% | 6.1%(+1.28)#94 | 6.9%(+0.521)#9,995 |
| 95. | Fielding | 7.4% | 6.1%(+1.24)#95 | 6.9%(+0.483)#10,064 |
| 96. | Apple Valley | 7.3% | 6.1%(+1.19)#96 | 6.9%(+0.427)#10,176 |
| 97. | Plain City | 7.2% | 6.1%(+1.10)#97 | 6.9%(+0.337)#10,331 |
| 98. | Woodland Hills | 7.2% | 6.1%(+1.09)#98 | 6.9%(+0.334)#10,338 |
| 99. | Orem | 7.2% | 6.1%(+1.08)#99 | 6.9%(+0.316)#10,372 |
| 100. | Woodland | 7.1% | 6.1%(+1.02)#100 | 6.9%(+0.262)#10,492 |
Common Questions
What are the Top 10 Cities with the Highest Percentage of Population Employed in Accommodation & Food Services in Utah?
Top 10 Cities with the Highest Percentage of Population Employed in Accommodation & Food Services in Utah are:
#1
57.6%
#2
39.4%
#3
35.6%
#4
34.6%
#5
30.6%
#6
30.5%
#7
29.1%
#8
28.7%
#9
27.3%
#10
27.0%
What city has the Highest Percentage of Population Employed in Accommodation & Food Services in Utah?
Flaming Gorge has the Highest Percentage of Population Employed in Accommodation & Food Services in Utah with 57.6%.
What is the Percentage of Population Employed in Accommodation & Food Services in the State of Utah?
Percentage of Population Employed in Accommodation & Food Services in Utah is 6.1%.
What is the Percentage of Population Employed in Accommodation & Food Services in the United States?
Percentage of Population Employed in Accommodation & Food Services in the United States is 6.9%.