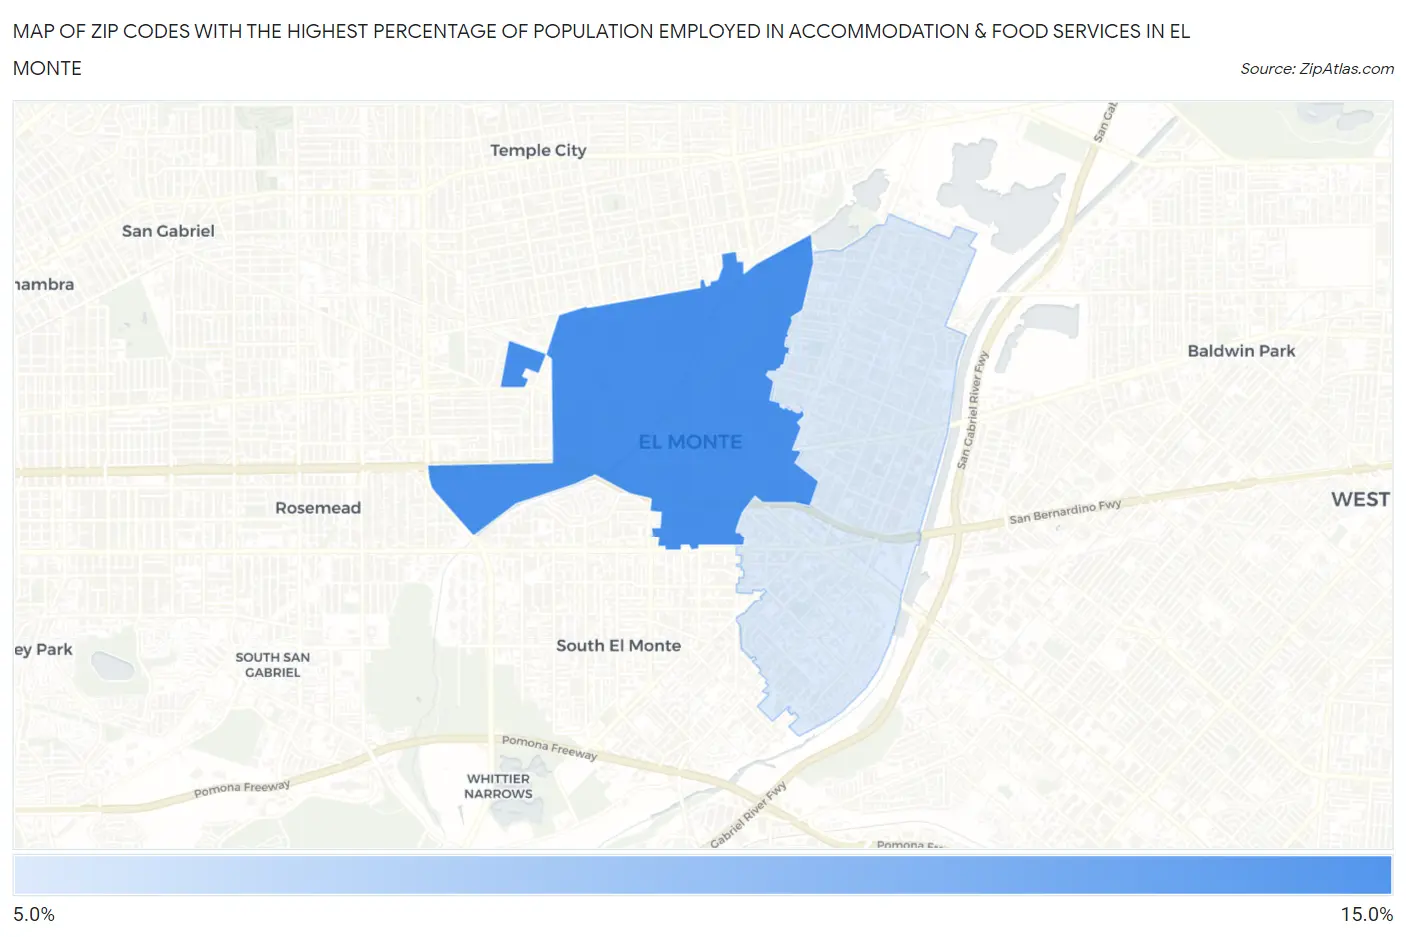
Zip Codes with the Highest Percentage of Population Employed in Accommodation & Food Services in El Monte, CA
RELATED REPORTS & OPTIONS
Accommodation & Food Services
El Monte
Compare Zip Codes
Map of Zip Codes with the Highest Percentage of Population Employed in Accommodation & Food Services in El Monte
10.0%
12.1%
Zip Codes with the Highest Percentage of Population Employed in Accommodation & Food Services in El Monte, CA
| Zip Code | % Employed | vs State | vs National | |
| 1. | 91731 | 12.1% | 7.2%(+4.98)#172 | 6.9%(+5.27)#2,751 |
| 2. | 91732 | 10.0% | 7.2%(+2.84)#291 | 6.9%(+3.13)#4,523 |
1
Common Questions
What are the Top Zip Codes with the Highest Percentage of Population Employed in Accommodation & Food Services in El Monte, CA?
Top Zip Codes with the Highest Percentage of Population Employed in Accommodation & Food Services in El Monte, CA are:
What zip code has the Highest Percentage of Population Employed in Accommodation & Food Services in El Monte, CA?
91731 has the Highest Percentage of Population Employed in Accommodation & Food Services in El Monte, CA with 12.1%.
What is the Percentage of Population Employed in Accommodation & Food Services in El Monte, CA?
Percentage of Population Employed in Accommodation & Food Services in El Monte is 10.4%.
What is the Percentage of Population Employed in Accommodation & Food Services in California?
Percentage of Population Employed in Accommodation & Food Services in California is 7.2%.
What is the Percentage of Population Employed in Accommodation & Food Services in the United States?
Percentage of Population Employed in Accommodation & Food Services in the United States is 6.9%.