Cities with the Highest Percentage of Population Employed in Accommodation & Food Services in Montana
RELATED REPORTS & OPTIONS
Accommodation & Food Services
Montana
Compare Cities
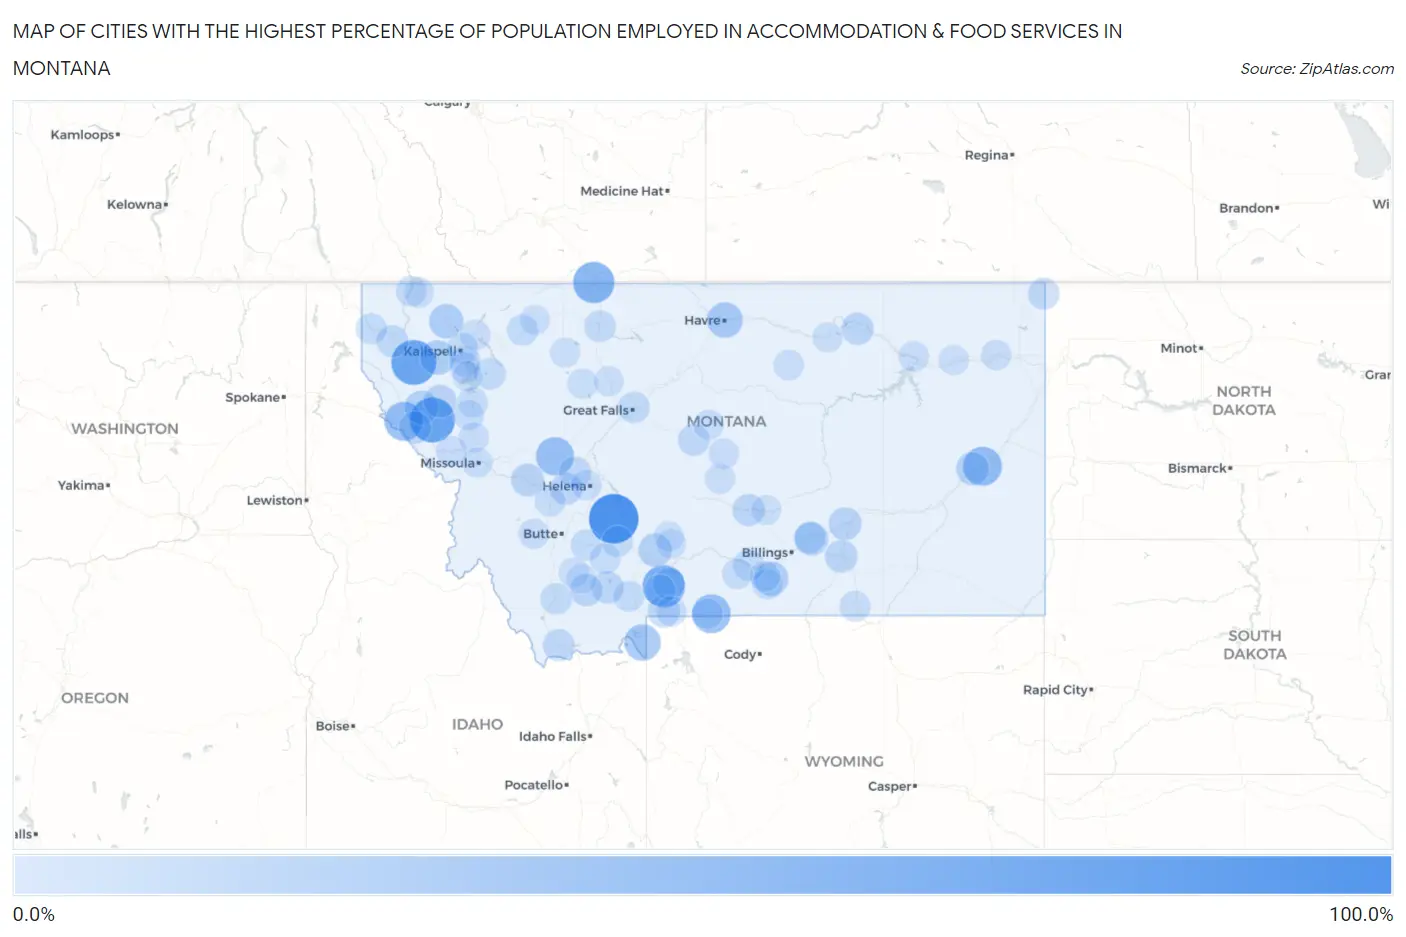
Map of Cities with the Highest Percentage of Population Employed in Accommodation & Food Services in Montana
0.0%
100.0%
Cities with the Highest Percentage of Population Employed in Accommodation & Food Services in Montana
| City | % Employed | vs State | vs National | |
| 1. | Radersburg | 100.0% | 8.3%(+91.7)#1 | 6.9%(+93.1)#16 |
| 2. | Midway Colony | 100.0% | 8.3%(+91.7)#2 | 6.9%(+93.1)#22 |
| 3. | Moccasin | 100.0% | 8.3%(+91.7)#3 | 6.9%(+93.1)#23 |
| 4. | Dell | 100.0% | 8.3%(+91.7)#5 | 6.9%(+93.1)#25 |
| 5. | Landusky | 100.0% | 8.3%(+91.7)#6 | 6.9%(+93.1)#26 |
| 6. | Twodot | 100.0% | 8.3%(+91.7)#7 | 6.9%(+93.1)#30 |
| 7. | Racetrack | 100.0% | 8.3%(+91.7)#8 | 6.9%(+93.1)#34 |
| 8. | Paradise | 78.9% | 8.3%(+70.7)#9 | 6.9%(+72.1)#45 |
| 9. | Happys Inn | 78.2% | 8.3%(+69.9)#10 | 6.9%(+71.3)#46 |
| 10. | Emigrant | 66.9% | 8.3%(+58.6)#11 | 6.9%(+60.0)#64 |
| 11. | Sweet Grass | 61.5% | 8.3%(+53.3)#12 | 6.9%(+54.7)#84 |
| 12. | Haugan | 53.8% | 8.3%(+45.6)#13 | 6.9%(+47.0)#124 |
| 13. | St. Mary | 51.3% | 8.3%(+43.1)#14 | 6.9%(+44.4)#141 |
| 14. | Fallon | 50.7% | 8.3%(+42.5)#15 | 6.9%(+43.9)#146 |
| 15. | Cooke City | 50.0% | 8.3%(+41.7)#16 | 6.9%(+43.1)#154 |
| 16. | De Borgia | 50.0% | 8.3%(+41.7)#17 | 6.9%(+43.1)#157 |
| 17. | Acton | 48.6% | 8.3%(+40.4)#18 | 6.9%(+41.8)#179 |
| 18. | Lincoln | 46.4% | 8.3%(+38.1)#19 | 6.9%(+39.5)#199 |
| 19. | West Yellowstone | 39.5% | 8.3%(+31.3)#20 | 6.9%(+32.7)#274 |
| 20. | Helmville | 38.9% | 8.3%(+30.6)#21 | 6.9%(+32.0)#287 |
| 21. | Havre North | 35.7% | 8.3%(+27.5)#22 | 6.9%(+28.9)#336 |
| 22. | Little Bitterroot Lake | 30.8% | 8.3%(+22.5)#23 | 6.9%(+23.9)#461 |
| 23. | Olney | 30.0% | 8.3%(+21.7)#24 | 6.9%(+23.1)#483 |
| 24. | Edgar | 29.3% | 8.3%(+21.0)#25 | 6.9%(+22.4)#503 |
| 25. | Weeksville | 28.1% | 8.3%(+19.8)#26 | 6.9%(+21.2)#562 |
| 26. | Ballantine | 27.3% | 8.3%(+19.0)#27 | 6.9%(+20.4)#596 |
| 27. | Montaqua | 26.3% | 8.3%(+18.0)#28 | 6.9%(+19.4)#654 |
| 28. | Bridger | 25.9% | 8.3%(+17.7)#29 | 6.9%(+19.0)#679 |
| 29. | Unionville | 24.3% | 8.3%(+16.0)#30 | 6.9%(+17.4)#789 |
| 30. | Terry | 24.2% | 8.3%(+16.0)#31 | 6.9%(+17.4)#794 |
| 31. | Drummond | 23.8% | 8.3%(+15.5)#32 | 6.9%(+16.9)#838 |
| 32. | Hot Springs | 23.8% | 8.3%(+15.5)#33 | 6.9%(+16.9)#840 |
| 33. | Custer | 23.4% | 8.3%(+15.1)#34 | 6.9%(+16.5)#869 |
| 34. | Homestead | 23.1% | 8.3%(+14.8)#35 | 6.9%(+16.2)#901 |
| 35. | Hardin | 22.3% | 8.3%(+14.0)#36 | 6.9%(+15.4)#972 |
| 36. | Ennis | 21.3% | 8.3%(+13.0)#37 | 6.9%(+14.4)#1,080 |
| 37. | Saco | 21.2% | 8.3%(+13.0)#38 | 6.9%(+14.4)#1,087 |
| 38. | Alder | 21.1% | 8.3%(+12.8)#39 | 6.9%(+14.2)#1,116 |
| 39. | Elliston | 21.0% | 8.3%(+12.7)#40 | 6.9%(+14.1)#1,124 |
| 40. | Ryegate | 20.6% | 8.3%(+12.4)#41 | 6.9%(+13.7)#1,165 |
| 41. | St Regis | 20.6% | 8.3%(+12.3)#42 | 6.9%(+13.7)#1,171 |
| 42. | Gardiner | 20.1% | 8.3%(+11.8)#43 | 6.9%(+13.2)#1,231 |
| 43. | Pray | 19.8% | 8.3%(+11.5)#44 | 6.9%(+12.9)#1,284 |
| 44. | Pioneer Junction | 19.1% | 8.3%(+10.8)#45 | 6.9%(+12.2)#1,405 |
| 45. | Lima | 18.9% | 8.3%(+10.7)#46 | 6.9%(+12.0)#1,433 |
| 46. | Marysville | 18.9% | 8.3%(+10.7)#47 | 6.9%(+12.0)#1,435 |
| 47. | Stanford | 18.3% | 8.3%(+10.1)#48 | 6.9%(+11.5)#1,542 |
| 48. | Westby | 18.2% | 8.3%(+9.91)#49 | 6.9%(+11.3)#1,588 |
| 49. | Black Eagle | 18.1% | 8.3%(+9.82)#50 | 6.9%(+11.2)#1,606 |
| 50. | Swan Lake | 17.7% | 8.3%(+9.44)#51 | 6.9%(+10.8)#1,675 |
| 51. | Shelby | 17.5% | 8.3%(+9.22)#52 | 6.9%(+10.6)#1,715 |
| 52. | Dillon | 17.3% | 8.3%(+9.01)#53 | 6.9%(+10.4)#1,767 |
| 53. | Essex | 17.2% | 8.3%(+8.97)#54 | 6.9%(+10.4)#1,781 |
| 54. | Columbus | 16.9% | 8.3%(+8.61)#55 | 6.9%(+9.99)#1,859 |
| 55. | Whitehall | 16.6% | 8.3%(+8.32)#56 | 6.9%(+9.71)#1,932 |
| 56. | East Glacier Park Village | 16.5% | 8.3%(+8.27)#57 | 6.9%(+9.65)#1,944 |
| 57. | South Glastonbury | 16.4% | 8.3%(+8.10)#58 | 6.9%(+9.48)#1,984 |
| 58. | Troy | 16.3% | 8.3%(+8.07)#59 | 6.9%(+9.45)#1,992 |
| 59. | Evergreen | 16.3% | 8.3%(+8.01)#60 | 6.9%(+9.39)#2,011 |
| 60. | Worden | 16.0% | 8.3%(+7.77)#61 | 6.9%(+9.15)#2,091 |
| 61. | Wheatland | 15.9% | 8.3%(+7.59)#62 | 6.9%(+8.98)#2,154 |
| 62. | Fromberg | 15.4% | 8.3%(+7.12)#63 | 6.9%(+8.50)#2,302 |
| 63. | Big Sky | 15.3% | 8.3%(+7.01)#64 | 6.9%(+8.39)#2,340 |
| 64. | Somers | 15.1% | 8.3%(+6.80)#65 | 6.9%(+8.18)#2,418 |
| 65. | Wyola | 14.9% | 8.3%(+6.66)#66 | 6.9%(+8.04)#2,477 |
| 66. | Rexford | 14.7% | 8.3%(+6.44)#67 | 6.9%(+7.82)#2,550 |
| 67. | Harrison | 14.3% | 8.3%(+6.02)#68 | 6.9%(+7.40)#2,743 |
| 68. | Lakeside | 14.1% | 8.3%(+5.79)#69 | 6.9%(+7.18)#2,833 |
| 69. | Deer Lodge | 13.8% | 8.3%(+5.56)#70 | 6.9%(+6.95)#2,925 |
| 70. | Absarokee | 13.8% | 8.3%(+5.55)#71 | 6.9%(+6.94)#2,931 |
| 71. | Pablo | 13.8% | 8.3%(+5.51)#72 | 6.9%(+6.90)#2,953 |
| 72. | Silver Gate | 13.7% | 8.3%(+5.46)#73 | 6.9%(+6.84)#2,985 |
| 73. | Hungry Horse | 13.5% | 8.3%(+5.27)#74 | 6.9%(+6.66)#3,092 |
| 74. | Alberton | 13.5% | 8.3%(+5.26)#75 | 6.9%(+6.64)#3,100 |
| 75. | Lodge Pole | 13.4% | 8.3%(+5.16)#76 | 6.9%(+6.55)#3,145 |
| 76. | Helena West Side | 13.3% | 8.3%(+4.99)#77 | 6.9%(+6.38)#3,232 |
| 77. | Joliet | 13.2% | 8.3%(+4.96)#78 | 6.9%(+6.34)#3,245 |
| 78. | Nashua | 13.0% | 8.3%(+4.69)#79 | 6.9%(+6.08)#3,380 |
| 79. | Denton | 12.9% | 8.3%(+4.68)#80 | 6.9%(+6.07)#3,394 |
| 80. | Charlo | 12.9% | 8.3%(+4.67)#81 | 6.9%(+6.06)#3,398 |
| 81. | Arlee | 12.9% | 8.3%(+4.67)#82 | 6.9%(+6.06)#3,403 |
| 82. | Jardine | 12.9% | 8.3%(+4.64)#83 | 6.9%(+6.02)#3,424 |
| 83. | Moore | 12.7% | 8.3%(+4.46)#84 | 6.9%(+5.85)#3,522 |
| 84. | Anaconda Deer Lodge County | 12.7% | 8.3%(+4.40)#85 | 6.9%(+5.79)#3,570 |
| 85. | Brockton | 12.5% | 8.3%(+4.23)#86 | 6.9%(+5.62)#3,673 |
| 86. | Missoula | 12.5% | 8.3%(+4.22)#87 | 6.9%(+5.61)#3,701 |
| 87. | Choteau | 12.3% | 8.3%(+4.01)#88 | 6.9%(+5.40)#3,822 |
| 88. | Dutton | 12.1% | 8.3%(+3.83)#89 | 6.9%(+5.22)#3,938 |
| 89. | Browning | 12.0% | 8.3%(+3.73)#90 | 6.9%(+5.12)#4,005 |
| 90. | Dupuyer | 12.0% | 8.3%(+3.73)#91 | 6.9%(+5.12)#4,013 |
| 91. | Twin Bridges | 11.9% | 8.3%(+3.67)#92 | 6.9%(+5.06)#4,044 |
| 92. | Wolf Point | 11.9% | 8.3%(+3.64)#93 | 6.9%(+5.03)#4,069 |
| 93. | Judith Gap | 11.9% | 8.3%(+3.60)#94 | 6.9%(+4.98)#4,112 |
| 94. | Rollins | 11.8% | 8.3%(+3.57)#95 | 6.9%(+4.96)#4,126 |
| 95. | Wilsall | 11.8% | 8.3%(+3.50)#96 | 6.9%(+4.88)#4,180 |
| 96. | Eureka | 11.7% | 8.3%(+3.46)#97 | 6.9%(+4.84)#4,211 |
| 97. | Sheridan | 11.7% | 8.3%(+3.43)#98 | 6.9%(+4.82)#4,229 |
| 98. | Malta | 11.6% | 8.3%(+3.33)#99 | 6.9%(+4.72)#4,298 |
| 99. | Lavina | 11.5% | 8.3%(+3.27)#100 | 6.9%(+4.66)#4,339 |
| 100. | Clyde Park | 11.5% | 8.3%(+3.25)#101 | 6.9%(+4.63)#4,357 |
Common Questions
What are the Top 10 Cities with the Highest Percentage of Population Employed in Accommodation & Food Services in Montana?
Top 10 Cities with the Highest Percentage of Population Employed in Accommodation & Food Services in Montana are:
#1
100.0%
#2
78.9%
#3
78.2%
#4
66.9%
#5
61.5%
#6
50.7%
#7
50.0%
#8
50.0%
#9
46.4%
#10
39.5%
What city has the Highest Percentage of Population Employed in Accommodation & Food Services in Montana?
Radersburg has the Highest Percentage of Population Employed in Accommodation & Food Services in Montana with 100.0%.
What is the Percentage of Population Employed in Accommodation & Food Services in the State of Montana?
Percentage of Population Employed in Accommodation & Food Services in Montana is 8.3%.
What is the Percentage of Population Employed in Accommodation & Food Services in the United States?
Percentage of Population Employed in Accommodation & Food Services in the United States is 6.9%.