Zip Codes with the Highest Percentage of Population Employed in Accommodation & Food Services in Arcadia, CA
RELATED REPORTS & OPTIONS
Accommodation & Food Services
Arcadia
Compare Zip Codes
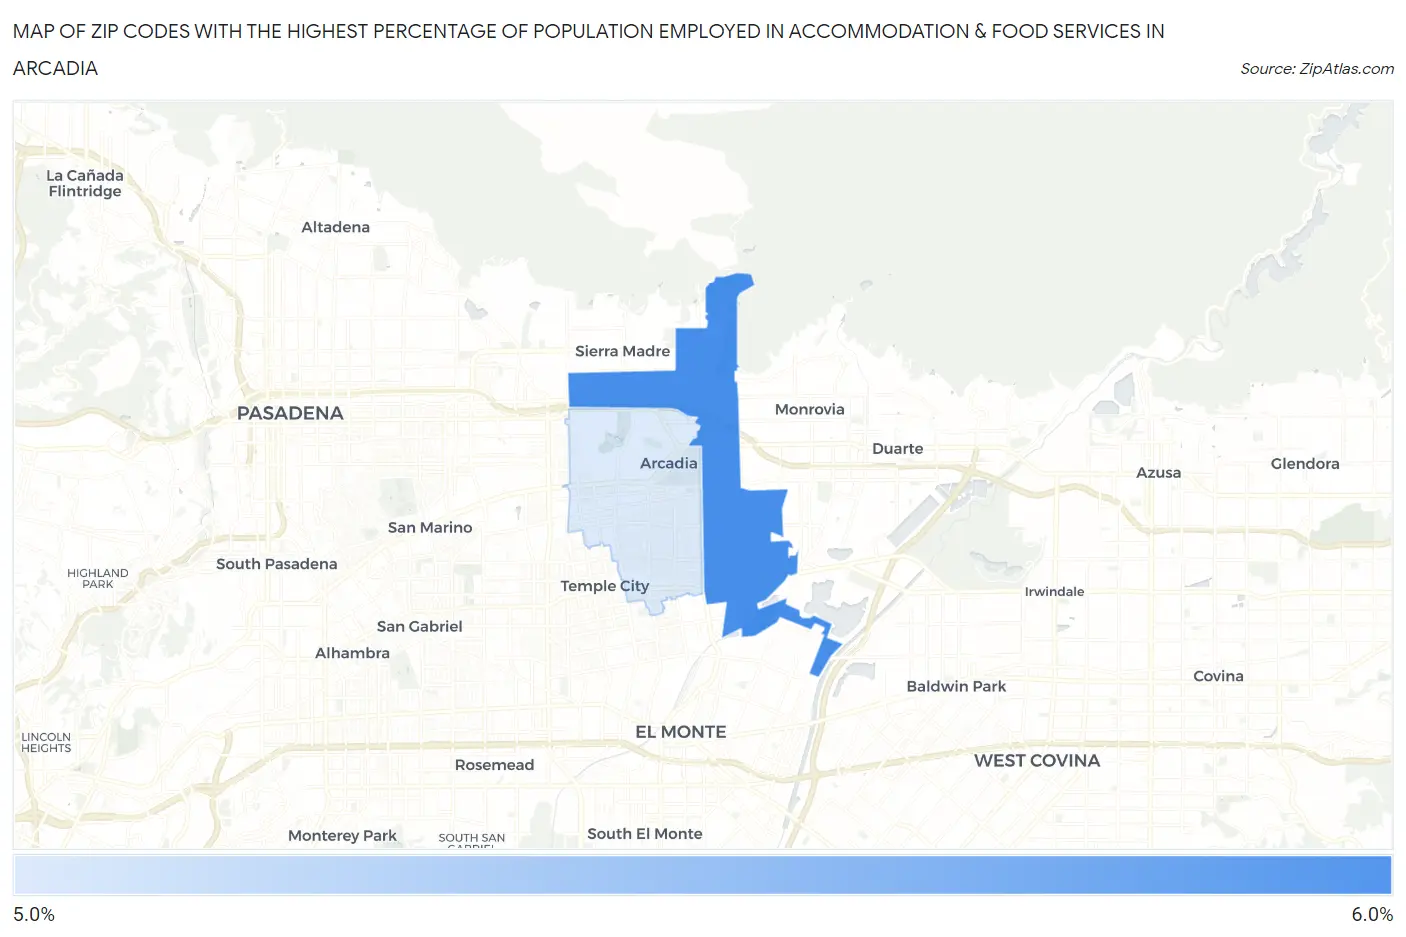
Map of Zip Codes with the Highest Percentage of Population Employed in Accommodation & Food Services in Arcadia
5.1%
5.5%
Zip Codes with the Highest Percentage of Population Employed in Accommodation & Food Services in Arcadia, CA
| Zip Code | % Employed | vs State | vs National | |
| 1. | 91006 | 5.5% | 7.2%(-1.67)#1,019 | 6.9%(-1.38)#15,051 |
| 2. | 91007 | 5.1% | 7.2%(-2.04)#1,095 | 6.9%(-1.75)#16,361 |
1
Common Questions
What are the Top Zip Codes with the Highest Percentage of Population Employed in Accommodation & Food Services in Arcadia, CA?
Top Zip Codes with the Highest Percentage of Population Employed in Accommodation & Food Services in Arcadia, CA are:
What zip code has the Highest Percentage of Population Employed in Accommodation & Food Services in Arcadia, CA?
91006 has the Highest Percentage of Population Employed in Accommodation & Food Services in Arcadia, CA with 5.5%.
What is the Percentage of Population Employed in Accommodation & Food Services in Arcadia, CA?
Percentage of Population Employed in Accommodation & Food Services in Arcadia is 5.2%.
What is the Percentage of Population Employed in Accommodation & Food Services in California?
Percentage of Population Employed in Accommodation & Food Services in California is 7.2%.
What is the Percentage of Population Employed in Accommodation & Food Services in the United States?
Percentage of Population Employed in Accommodation & Food Services in the United States is 6.9%.