Zip Codes with the Highest Percentage of Population Employed in Accommodation & Food Services in Moraga, CA
RELATED REPORTS & OPTIONS
Accommodation & Food Services
Moraga
Compare Zip Codes
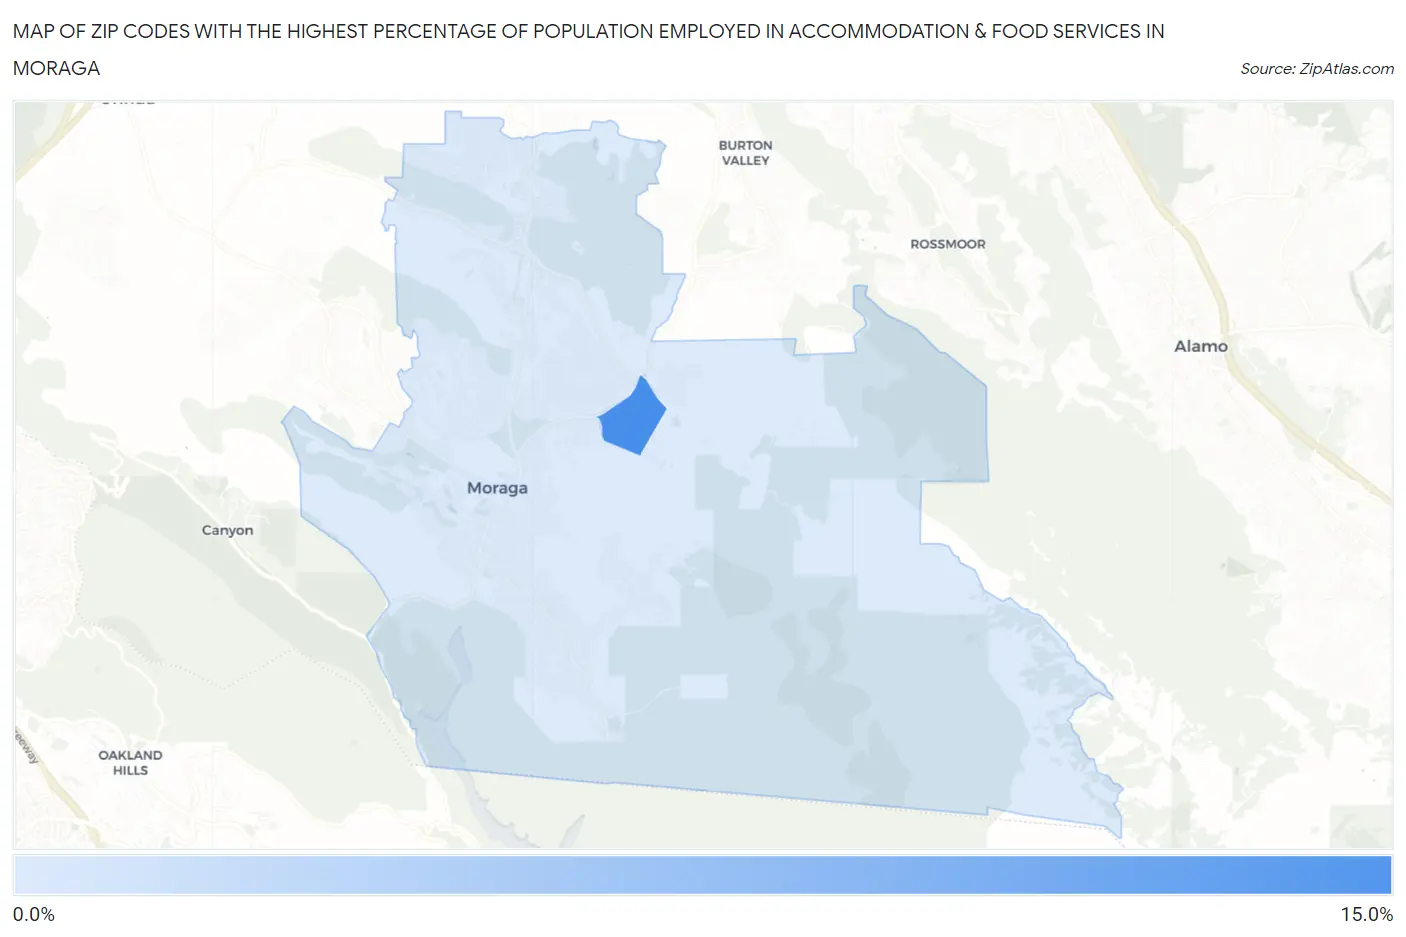
Map of Zip Codes with the Highest Percentage of Population Employed in Accommodation & Food Services in Moraga
4.0%
12.2%
Zip Codes with the Highest Percentage of Population Employed in Accommodation & Food Services in Moraga, CA
| Zip Code | % Employed | vs State | vs National | |
| 1. | 94575 | 12.2% | 7.2%(+5.04)#168 | 6.9%(+5.33)#2,711 |
| 2. | 94556 | 4.0% | 7.2%(-3.13)#1,285 | 6.9%(-2.84)#20,005 |
1
Common Questions
What are the Top Zip Codes with the Highest Percentage of Population Employed in Accommodation & Food Services in Moraga, CA?
Top Zip Codes with the Highest Percentage of Population Employed in Accommodation & Food Services in Moraga, CA are:
What zip code has the Highest Percentage of Population Employed in Accommodation & Food Services in Moraga, CA?
94575 has the Highest Percentage of Population Employed in Accommodation & Food Services in Moraga, CA with 12.2%.
What is the Percentage of Population Employed in Accommodation & Food Services in Moraga, CA?
Percentage of Population Employed in Accommodation & Food Services in Moraga is 4.5%.
What is the Percentage of Population Employed in Accommodation & Food Services in California?
Percentage of Population Employed in Accommodation & Food Services in California is 7.2%.
What is the Percentage of Population Employed in Accommodation & Food Services in the United States?
Percentage of Population Employed in Accommodation & Food Services in the United States is 6.9%.