Cities with the Highest Percentage of Population Employed in Accommodation & Food Services in Kansas
RELATED REPORTS & OPTIONS
Accommodation & Food Services
Kansas
Compare Cities
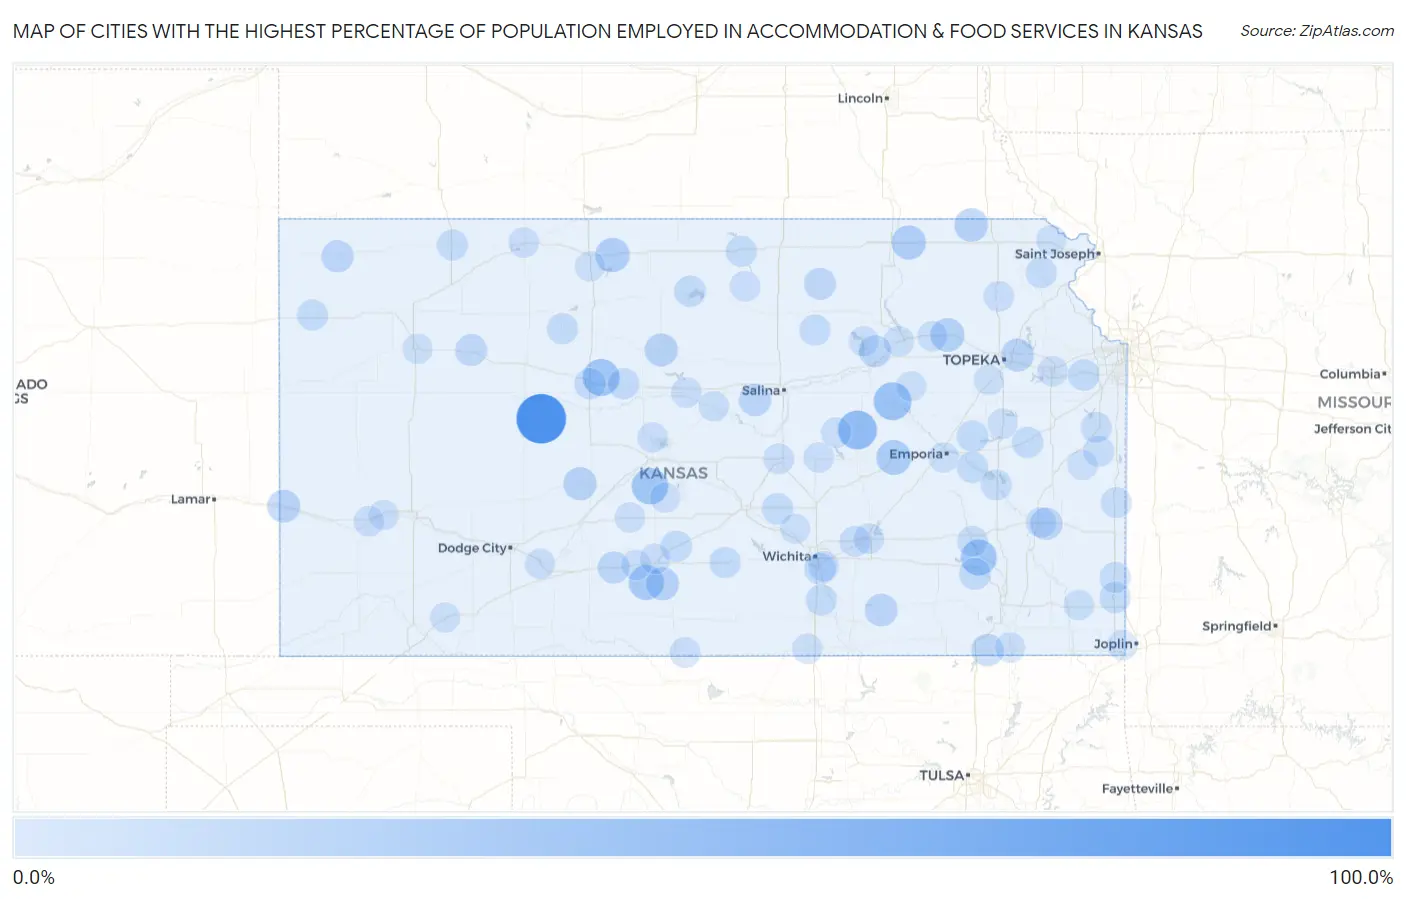
Map of Cities with the Highest Percentage of Population Employed in Accommodation & Food Services in Kansas
0.0%
100.0%
Cities with the Highest Percentage of Population Employed in Accommodation & Food Services in Kansas
| City | % Employed | vs State | vs National | |
| 1. | Brownell | 100.0% | 6.2%(+93.8)#1 | 6.9%(+93.1)#29 |
| 2. | Kelly | 100.0% | 6.2%(+93.8)#2 | 6.9%(+93.1)#37 |
| 3. | Greenwich | 68.3% | 6.2%(+62.1)#3 | 6.9%(+61.4)#60 |
| 4. | Centropolis | 54.3% | 6.2%(+48.1)#4 | 6.9%(+47.5)#119 |
| 5. | Monument | 52.9% | 6.2%(+46.7)#5 | 6.9%(+46.1)#130 |
| 6. | Lost Springs | 48.6% | 6.2%(+42.4)#6 | 6.9%(+41.8)#180 |
| 7. | Murdock | 43.8% | 6.2%(+37.5)#7 | 6.9%(+36.9)#233 |
| 8. | Parkerville | 42.9% | 6.2%(+36.6)#8 | 6.9%(+36.0)#238 |
| 9. | Catharine | 39.3% | 6.2%(+33.1)#9 | 6.9%(+32.4)#281 |
| 10. | Seward | 36.8% | 6.2%(+30.6)#10 | 6.9%(+30.0)#316 |
| 11. | Coyville | 35.7% | 6.2%(+29.5)#11 | 6.9%(+28.8)#339 |
| 12. | St. Marks | 33.3% | 6.2%(+27.1)#12 | 6.9%(+26.5)#385 |
| 13. | Coats | 30.9% | 6.2%(+24.7)#13 | 6.9%(+24.0)#455 |
| 14. | Elmdale | 29.4% | 6.2%(+23.2)#14 | 6.9%(+22.5)#500 |
| 15. | Agra | 27.0% | 6.2%(+20.8)#15 | 6.9%(+20.1)#612 |
| 16. | Home | 26.7% | 6.2%(+20.4)#16 | 6.9%(+19.8)#634 |
| 17. | Belvue | 24.7% | 6.2%(+18.5)#17 | 6.9%(+17.9)#761 |
| 18. | Yale | 24.1% | 6.2%(+17.9)#18 | 6.9%(+17.2)#811 |
| 19. | Bern | 23.3% | 6.2%(+17.1)#19 | 6.9%(+16.5)#875 |
| 20. | Rozel | 22.2% | 6.2%(+16.0)#20 | 6.9%(+15.3)#981 |
| 21. | Luray | 21.7% | 6.2%(+15.5)#21 | 6.9%(+14.8)#1,041 |
| 22. | Sawyer | 21.6% | 6.2%(+15.4)#22 | 6.9%(+14.7)#1,049 |
| 23. | Grantville | 21.2% | 6.2%(+15.0)#23 | 6.9%(+14.3)#1,095 |
| 24. | Coolidge | 20.5% | 6.2%(+14.2)#24 | 6.9%(+13.6)#1,190 |
| 25. | Burden | 19.9% | 6.2%(+13.7)#25 | 6.9%(+13.0)#1,266 |
| 26. | Williamstown | 18.6% | 6.2%(+12.4)#26 | 6.9%(+11.7)#1,489 |
| 27. | Tyro | 18.4% | 6.2%(+12.2)#27 | 6.9%(+11.5)#1,526 |
| 28. | La Harpe | 18.3% | 6.2%(+12.1)#28 | 6.9%(+11.4)#1,565 |
| 29. | Brookville | 17.8% | 6.2%(+11.6)#29 | 6.9%(+10.9)#1,659 |
| 30. | Bird City | 17.6% | 6.2%(+11.4)#30 | 6.9%(+10.8)#1,690 |
| 31. | Fort Riley | 17.4% | 6.2%(+11.2)#31 | 6.9%(+10.5)#1,733 |
| 32. | Haviland | 17.2% | 6.2%(+11.0)#32 | 6.9%(+10.4)#1,783 |
| 33. | Park | 16.9% | 6.2%(+10.7)#33 | 6.9%(+10.0)#1,851 |
| 34. | Vining | 16.7% | 6.2%(+10.4)#34 | 6.9%(+9.79)#1,916 |
| 35. | New Albany | 15.4% | 6.2%(+9.16)#35 | 6.9%(+8.50)#2,307 |
| 36. | Oaklawn Sunview | 14.8% | 6.2%(+8.57)#36 | 6.9%(+7.92)#2,520 |
| 37. | De Soto | 14.6% | 6.2%(+8.43)#37 | 6.9%(+7.77)#2,572 |
| 38. | Reading | 14.6% | 6.2%(+8.41)#38 | 6.9%(+7.75)#2,580 |
| 39. | Ludell | 14.3% | 6.2%(+8.06)#39 | 6.9%(+7.40)#2,748 |
| 40. | Cawker City | 14.0% | 6.2%(+7.78)#40 | 6.9%(+7.12)#2,852 |
| 41. | Burrton | 13.9% | 6.2%(+7.71)#41 | 6.9%(+7.05)#2,876 |
| 42. | Williamsburg | 13.9% | 6.2%(+7.63)#42 | 6.9%(+6.97)#2,915 |
| 43. | Hays | 13.8% | 6.2%(+7.53)#43 | 6.9%(+6.87)#2,970 |
| 44. | Hartford | 13.7% | 6.2%(+7.52)#44 | 6.9%(+6.86)#2,972 |
| 45. | Preston | 13.6% | 6.2%(+7.41)#45 | 6.9%(+6.76)#3,036 |
| 46. | Gorham | 13.5% | 6.2%(+7.29)#46 | 6.9%(+6.63)#3,108 |
| 47. | Kingman | 13.3% | 6.2%(+7.11)#47 | 6.9%(+6.45)#3,190 |
| 48. | Formoso | 13.0% | 6.2%(+6.82)#48 | 6.9%(+6.16)#3,351 |
| 49. | Pittsburg | 12.8% | 6.2%(+6.60)#49 | 6.9%(+5.95)#3,467 |
| 50. | Goodland | 12.8% | 6.2%(+6.55)#50 | 6.9%(+5.90)#3,493 |
| 51. | Oberlin | 12.7% | 6.2%(+6.47)#51 | 6.9%(+5.81)#3,549 |
| 52. | Belle Plaine | 12.7% | 6.2%(+6.45)#52 | 6.9%(+5.79)#3,566 |
| 53. | Palco | 12.5% | 6.2%(+6.28)#53 | 6.9%(+5.62)#3,681 |
| 54. | Huron | 12.5% | 6.2%(+6.28)#54 | 6.9%(+5.62)#3,695 |
| 55. | Oak Hill | 12.5% | 6.2%(+6.28)#55 | 6.9%(+5.62)#3,699 |
| 56. | Burlington | 12.3% | 6.2%(+6.07)#56 | 6.9%(+5.42)#3,808 |
| 57. | Arma | 11.9% | 6.2%(+5.68)#57 | 6.9%(+5.02)#4,071 |
| 58. | Fontana | 11.9% | 6.2%(+5.66)#58 | 6.9%(+5.01)#4,092 |
| 59. | Prescott | 11.7% | 6.2%(+5.46)#59 | 6.9%(+4.81)#4,240 |
| 60. | Paola | 11.6% | 6.2%(+5.42)#60 | 6.9%(+4.77)#4,266 |
| 61. | Towanda | 11.5% | 6.2%(+5.26)#61 | 6.9%(+4.60)#4,377 |
| 62. | Toronto | 11.1% | 6.2%(+4.89)#62 | 6.9%(+4.23)#4,691 |
| 63. | Kiowa | 10.8% | 6.2%(+4.62)#63 | 6.9%(+3.96)#4,912 |
| 64. | Mcpherson | 10.7% | 6.2%(+4.50)#64 | 6.9%(+3.85)#5,019 |
| 65. | Lawrence | 10.6% | 6.2%(+4.39)#65 | 6.9%(+3.74)#5,110 |
| 66. | Scottsville | 10.5% | 6.2%(+4.30)#66 | 6.9%(+3.65)#5,200 |
| 67. | El Dorado | 10.3% | 6.2%(+4.12)#67 | 6.9%(+3.46)#5,383 |
| 68. | Holton | 10.2% | 6.2%(+4.00)#68 | 6.9%(+3.34)#5,531 |
| 69. | Lehigh | 10.2% | 6.2%(+3.98)#69 | 6.9%(+3.32)#5,554 |
| 70. | Lakin | 10.1% | 6.2%(+3.92)#70 | 6.9%(+3.26)#5,635 |
| 71. | Wilson | 10.1% | 6.2%(+3.88)#71 | 6.9%(+3.22)#5,676 |
| 72. | Mcconnell Afb | 10.1% | 6.2%(+3.86)#72 | 6.9%(+3.20)#5,691 |
| 73. | Norton | 10.0% | 6.2%(+3.79)#73 | 6.9%(+3.13)#5,755 |
| 74. | Ford | 9.8% | 6.2%(+3.61)#74 | 6.9%(+2.96)#5,960 |
| 75. | Manhattan | 9.7% | 6.2%(+3.51)#75 | 6.9%(+2.86)#6,093 |
| 76. | Wamego | 9.7% | 6.2%(+3.45)#76 | 6.9%(+2.80)#6,160 |
| 77. | Mccune | 9.7% | 6.2%(+3.43)#77 | 6.9%(+2.77)#6,191 |
| 78. | Tampa | 9.6% | 6.2%(+3.39)#78 | 6.9%(+2.73)#6,236 |
| 79. | Ellsworth | 9.6% | 6.2%(+3.36)#79 | 6.9%(+2.71)#6,278 |
| 80. | Hoisington | 9.5% | 6.2%(+3.28)#80 | 6.9%(+2.63)#6,369 |
| 81. | Gas | 9.5% | 6.2%(+3.28)#81 | 6.9%(+2.63)#6,371 |
| 82. | Pratt | 9.5% | 6.2%(+3.26)#82 | 6.9%(+2.61)#6,399 |
| 83. | Milford | 9.4% | 6.2%(+3.15)#83 | 6.9%(+2.49)#6,545 |
| 84. | Cullison | 9.4% | 6.2%(+3.15)#84 | 6.9%(+2.49)#6,553 |
| 85. | Glade | 9.4% | 6.2%(+3.15)#85 | 6.9%(+2.49)#6,556 |
| 86. | Macksville | 9.3% | 6.2%(+3.08)#86 | 6.9%(+2.42)#6,644 |
| 87. | Parker | 9.3% | 6.2%(+3.04)#87 | 6.9%(+2.38)#6,709 |
| 88. | Emporia | 9.1% | 6.2%(+2.91)#88 | 6.9%(+2.25)#6,886 |
| 89. | Hudson | 9.1% | 6.2%(+2.87)#89 | 6.9%(+2.21)#6,965 |
| 90. | Galena | 9.0% | 6.2%(+2.77)#90 | 6.9%(+2.11)#7,099 |
| 91. | South Haven | 9.0% | 6.2%(+2.76)#91 | 6.9%(+2.11)#7,112 |
| 92. | Coffeyville | 8.9% | 6.2%(+2.68)#92 | 6.9%(+2.02)#7,255 |
| 93. | Deerfield | 8.9% | 6.2%(+2.67)#93 | 6.9%(+2.01)#7,278 |
| 94. | Auburn | 8.8% | 6.2%(+2.62)#94 | 6.9%(+1.96)#7,352 |
| 95. | Alta Vista | 8.8% | 6.2%(+2.62)#95 | 6.9%(+1.96)#7,353 |
| 96. | Oakley | 8.7% | 6.2%(+2.52)#96 | 6.9%(+1.87)#7,473 |
| 97. | Highland | 8.7% | 6.2%(+2.50)#97 | 6.9%(+1.84)#7,511 |
| 98. | Bentley | 8.7% | 6.2%(+2.45)#98 | 6.9%(+1.79)#7,585 |
| 99. | Plains | 8.7% | 6.2%(+2.43)#99 | 6.9%(+1.77)#7,626 |
| 100. | Lyndon | 8.6% | 6.2%(+2.40)#100 | 6.9%(+1.74)#7,664 |
Common Questions
What are the Top 10 Cities with the Highest Percentage of Population Employed in Accommodation & Food Services in Kansas?
Top 10 Cities with the Highest Percentage of Population Employed in Accommodation & Food Services in Kansas are:
#1
100.0%
#2
48.6%
#3
42.9%
#4
39.3%
#5
36.8%
#6
35.7%
#7
30.9%
#8
29.4%
#9
27.0%
#10
26.7%
What city has the Highest Percentage of Population Employed in Accommodation & Food Services in Kansas?
Brownell has the Highest Percentage of Population Employed in Accommodation & Food Services in Kansas with 100.0%.
What is the Percentage of Population Employed in Accommodation & Food Services in the State of Kansas?
Percentage of Population Employed in Accommodation & Food Services in Kansas is 6.2%.
What is the Percentage of Population Employed in Accommodation & Food Services in the United States?
Percentage of Population Employed in Accommodation & Food Services in the United States is 6.9%.